Single-Supply Portable ECG Monitor
Author: Robert Crews (netID: rlc359)
ECE 4760 Final Project
Cornell University
December 2019
--
Introduction
The aim of this project was to produce a
portable ECG monitor that displays the ECG signal of an Einthoven triangle
configuration of electrodes (3 leads). The motivation of this project comes
from the pervasiveness of cardiac problems in the world, which cause the
highest number of death, as well as the relatively uncommon tendency of people
to monitor electrophysiological condition. This device, as it stands since the
conclusion of this project, allows a user to easily apply the ECG electrodes to
themselves in order to see their cardiac signal and instantaneous heart rate. If
this device were to hit the market, it would include instructions on how to use
it, as well as guidelines on common pathologies visible on a three-lead ECG
signal. By providing people with an easily accessible and cost-effective device
to monitor their heart condition, we can have a positive effect on the
occurrence of early intervention in treating harmful cardiac pathologies.
Design Details
Background and Motivation
Electrocardiograms provide a window to
cardiac condition through electrical activity at the surface of the skin, but
requiring hospital visits for routine monitoring can be expensive,
time-consuming, and frustrating. Therefore, having access to intelligent
hardware and software packages that are portable, cheap, and user-friendly
would allow patients to monitor themselves and get access to healthcare when
use of the device suggests a problem. Signs of abnormal cardiac behavior would
prompt the user to visit the hospital for perhaps a 12-lead ECG and electrophysiology
(EP) study, if necessary. In performing analyses of cardiac rhythm and signal,
and prompting a hospital visit for diagnosis and treatment places this device
within the growing market of wellness devices. Wellness devices provide users
with a better intuition into their physiological condition, but do not make
diagnoses of medical conditions.
Before discussing the technical
considerations for this device, it is critical to understand the signal
resulting from normal cardiac functioning. The heart is composed of four
chambers—two atria and two ventricles (one of each on each side of the
heart)—which serve to pump blood throughout the body. They are designed to contract
such that blood moves from the atria to ventricles, and then from ventricles to
the body. To accomplish this, atria contract first, pumping blood into the
ventricles. If the ventricles contracted at the same time as the atria, then
they would not be adequately filled and would not distribute blood efficiently to
the body. Therefore, there is a small delay between the atrial contraction and
ventricular contraction, causing two distinct and audible beats throughout one
whole cardiac cycle. On an electrophysiological level, this translates to the
following signal:
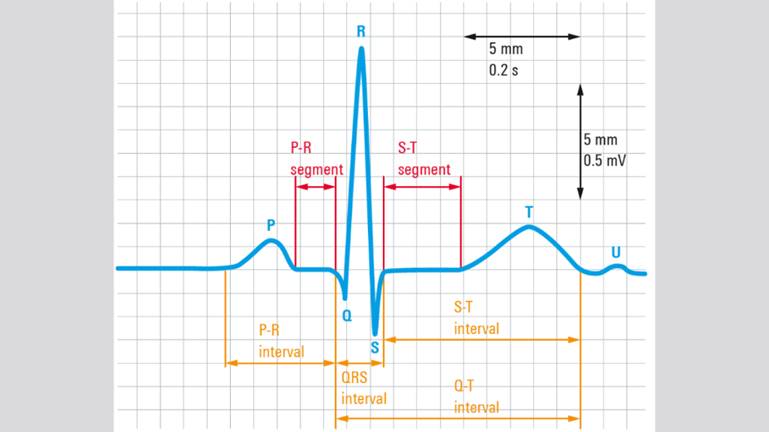
Figure 1: Standard morphology of a cardiac
electrical cycle [1].
The P-wave in the above signal is the
electrical pattern associated with atrial contraction. The P-R segment
describes the delay between atrial contraction and ventricular contraction,
which corresponds to ventricular filling. The large QRS complex signal is typically
the highest frequency and amplitude signal, and is the electrical signal
associated with ventricular contraction. Finally, the T-wave is the signal
associated with the ventricles relaxing (repolarization of the cells). In
general, the morphology of these distinct waves can vary in frequency and
amplitude, but the pattern is relatively consistent between patients
demonstrating normal rhythm and functionality.
When using the device to monitor cardiac
rhythm, it is important to have an understanding of how various pathologies can
cause different electrical patterns such as arrythmias (irregular heartbeats),
especially when they are harmful. Examples of arrythmias that could be
detectable include atrial fibrillation and flutter, a couple of the most common
arrhythmias of the heart. These tachycardias (accelerated heart rate) reduce
the ability to efficiently pump blood and may cause lethal conditions such as
stroke [2]. They are seen as a series of P-waves, followed by a QRS complex
(the P-wave to QRS complex ratio is not 1:1 with this arrythmia). It could look
something like this:
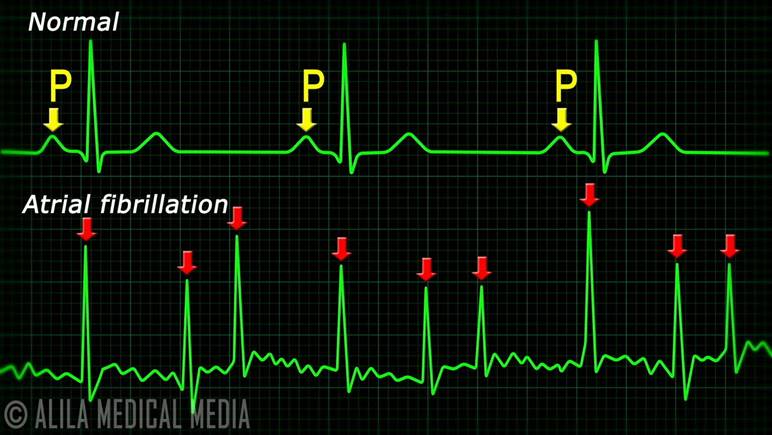
Figure 2: Comparison between normal
cardiac signal morphology and atrial fibrillation [3].
Technical Considerations
The signal output of an ECG is
unfortunately not a smooth, direct representation of what is happening in just
the heart. The signal to noise ratio is rather poor, because sources of
undesired signals come from numerous other locations. Namely, 60 Hz powerline
noise and electromyographical (EMG) noise from muscles surrounding the
electrodes add to the overall signal. Therefore, when taking an ECG signal from
a person, it is important to implement analog and sometimes digital filters to
your system to limit the undesired noise and amplify the desired signal. Since
noise from the powerline is 60 Hz and EMG noise is typically higher frequency,
a low pass filter that attenuates those frequencies is crucial for recovering a
clean ECG signal. Fortunately, the power of the cardiac signal is highest at
frequencies below these sources of noise, so filtering out the unwanted signals
conveniently passes the desired signal as an output. These filters can be
implemented using both analog and digital filters, and by using digital
filtering after analog filtering, a very nice signal can be outputted. An
analog filter (using resistors and capacitors) uses the following equation in
its design:
![]()
where ![]() is the cutoff frequency where the signal
starts to attenuate (after this frequency for low pass filters and below this
frequency for high pass filters). If we use, say, 1 microfarad capacitors, and
we know the cutoff frequency that we are targeting, then R is the only variable
that changes. Much
of the ECG signal power is below 40 Hz, so targeting frequencies above ~40 Hz
for attenuation can be done by using a lowpass filter with a resistor of about
4.7k to 5.6k
is the cutoff frequency where the signal
starts to attenuate (after this frequency for low pass filters and below this
frequency for high pass filters). If we use, say, 1 microfarad capacitors, and
we know the cutoff frequency that we are targeting, then R is the only variable
that changes. Much
of the ECG signal power is below 40 Hz, so targeting frequencies above ~40 Hz
for attenuation can be done by using a lowpass filter with a resistor of about
4.7k to 5.6k![]() . This leads to
attenuation of -20dB per decade of frequency starting at just over 30 Hz. Implementing
a second order filter doubles the attenuation per decade of frequency, allowing
for stronger attenuation of powerline and EMG noise.
. This leads to
attenuation of -20dB per decade of frequency starting at just over 30 Hz. Implementing
a second order filter doubles the attenuation per decade of frequency, allowing
for stronger attenuation of powerline and EMG noise.
These filters, coupled with amplifiers and
a high-pass filter (cutoff frequency of about 1 Hz) to remove DC offset, allow
us to capture the ECG signal effectively on the output of the analog circuit
and input it into an analog to digital converter and microcontroller for further
signal processing and display. Low pass filters can be done by averaging a
cluster of samples, and high pass filters can be made using either difference
equations or, in this case, by averaging a larger number of samples and
subtracting that average from the output of the low pass filter. These
combinations of low and high pass filters effectively form a band pass filter,
which pass signals within a range of frequencies. In this case, signals are
passed between about 1 Hz and 40 Hz.
The ADC is 10-bit on the MCU, and the
voltage range is 0 to 3.3 V. This means that there is about 3 mV resolution
capability. Therefore, it is important to consider the amplitude of
corresponding ECG waveform components to determine required gain for clear
visibility of the signal on a display.
P-wave: ~0.1 mV
QRS: 1 to 3 mV
T-wave: 0.5 to 1 mV
The ranges above [4,5] give us insight
into how much gain is required to be able to distinguish between these waves on
a display which shows a signal from what the ADC receives. Given the 3 mV
resolution, we need a gain of at least 60 for the P-wave, 3 for the QRS
complex, and 6 for the T-wave. However, to have any sort of visual insight into
cardiac condition, we need to be able to span a much larger range of the ADC. If
we were to span about 200 units, then we would require a gain 200 times higher
than previously calculated, because those gains were the requirements to show a
change of one ADC unit. To be able to see everything very clearly, we would
need a gain of about 1200. The TFT display used in this project has a height of
240 pixels. If we use the targeted span and draw within the 0 to 240 pixels,
then we can see the signal on a large portion of the screen. Adjusting the gain
may be required to more appropriately plot the signal. With this, and
considering the sampling rate of the system, it is important to find a balance
between gain and visual appearance of the signal on screen. Too much gain would
make the signal too erratic because pixels would be separated by a much larger
margin.
Hardware Design
Refer to Appendix C for the circuit
design. This design splits the voltage from a 9V battery into +/- 4.5V and
produces a virtual ground. This creates a single-use scenario which limits the
required number of batteries required in the design. Rather than using one
battery for V+ and another for V-, we use one battery to produce both by making
ground at what would normally have been 4.5V.
The instrumentation amp (INA121) used in
this project receives the ECG signal at its two inputs. The schematic from the
INA121 datasheet, shown in Appendix C below, provides information regarding the
pinout and internal workings of the instrumentation amplifier (external
connections are indicated by pin numbers):
Lead I of an ECG has three electrode
attachments to the body. The electrodes to receive the signal through the
instrumentation amp are the electrodes attached at the end of each arm. Each of
those two leads are inputted into one of the input terminals (pins 2 and 3). In
my design implementation, I connected the electrode on the right arm to Vin+
and the electrode on the left arm to Vin-. The resistor RG spanning
between pins 1 and 8 determines the gain of the signal on the output. In this
design, a 51k![]() resistor is used to amplify the signal by 2. Further
amplification is performed by the gain stages following the instrumentation
amplifier. The pins V+ and V- are powered by +4.5V and -4.5V, respectively. The
reference pin (Ref) is connected to ground, which is connected to the reference
electrode (electrode 3) connected to the bottom of the leg.
resistor is used to amplify the signal by 2. Further
amplification is performed by the gain stages following the instrumentation
amplifier. The pins V+ and V- are powered by +4.5V and -4.5V, respectively. The
reference pin (Ref) is connected to ground, which is connected to the reference
electrode (electrode 3) connected to the bottom of the leg.
Following the instrumentation amp is a
high pass filter with a cutoff frequency of about 1 Hz, which serves to
eliminate DC offset before going through extensive amplification in the gain
stages to follow [6]. Amplifying DC offset is undesirable in this scenario and
would further limit the already narrow working range of the op-amps, provided
the limited provided voltage range. Because we are working with very small
signals, we do not require large voltage ranges that power the circuit, which
would be impractical to achieve using a portable design in any case. To prevent
saturation, especially with the large gains required to amplify the signals to
a working level, the high pass filter is critical. The ECG signal with the DC
signal removed then passes through a buffer before beginning a series of low
pass filters and signal amplification stages.
The remainder of the circuit consists of
alternating low pass filters and gain stages [6]. Each low pass filter has a
cutoff frequency of about 31 Hz, and each gain stage amplifies the signal by
about 20. To prevent loading issues following each low pass filter, the gain
resistors at the inverting input and feedback loop were increased in value to
limit current and increase impedance on the low pass output. By the end, the
signal has passed through two low pass filters and has a gain of about 400,
which means that we can expect signal attenuation to occur at about 40 dB per
decade of frequency starting just after 30 Hz. If the signal we care about has
some component with a frequency slightly above 30 Hz, then there will be some
attenuation, but it will not be very severe. Moving the cutoff frequency back
just a bit more than suggested prior (40 or 50 Hz) gives us more room for
attenuating powerline noise that is not too far from the max frequency we are
working with. This is an overall beneficial hardware tradeoff, similar to
maintaining portability by limiting the number of batteries and voltage, but
having to be careful with gain and DC offset. As a matter of fact, this is the
reason that the gain is limited to 400 in the analog portion of the circuit;
the remainder of the gain will be implemented in software after digital signal
processing further cleans the signal.
Just as we ensure that the bounds of the
op-amp supply voltages are not surpassed by output voltages, we need to ensure
that the ADC is not saturated so that we can maintain the entire signal
morphology. To accomplish this, the output of the analog circuitry is sent
through a voltage divider which serves to split the 3.3 V line on the MCU
SECABB board in half, allowing the signal to fluctuate around about 1.7 V (~500
ADC units) by summing the altered signal with the divided voltage. This is
accomplished in this project using two 5kOhm resistors using the following
configuration:
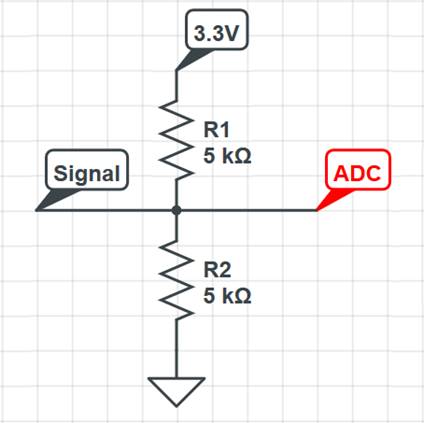
Figure 3: Voltage divider configuration to
raise the voltage before inputting into the ADC. This allows for the signal to
be centered around the middle of the ADC range.
This circuit outputs a signal which goes
to the ADC in the PIC32 microcontroller. In this project, the SECABB v2.1
development board with TFT attachment was used to develop the software and
program the TFT to display the signal and data [7]. Important connections
between the analog circuitry and programming board include connecting the 3.3V
line to the voltage divider mentioned prior, tying the grounds together, and
sending the data to the ADC (pin RB13). The following image shows the two
boards that make up the entire device:
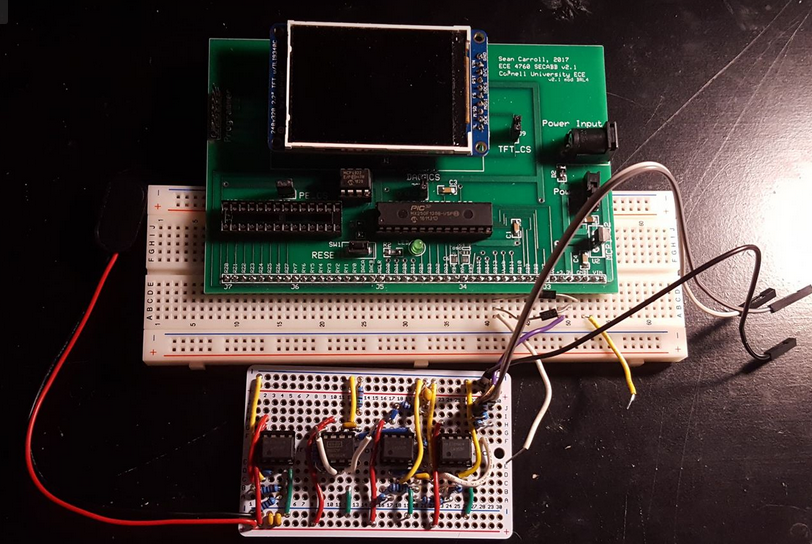
Figure 4: Final hardware design of the
portable ECG monitor.
The right side of the soldered circuit has
lengthy wires extending from it. They connect to the pins mentioned prior—3.3V,
RB13, and ground.
Software Design
The primary function of the software is to
further process the input signals on the ADC and display the signal on the
screen for the user to see. It also detects heartbeats and displays the
instantaneous heart rate. Smaller details include a beat counter that displays
the number of beats on the upper right corner of the screen, as well as a
“waiting for signal” message when the system detects an uncharacteristic signal
or upon startup. The code was written using MPLAB v3.05 IDE, and used
Protothreads C-structure to easily and efficiently permit multiple simultaneous
threads. Furthermore, to maintain processor speed and efficiency, most of the
arithmetic uses fixed-point math and bit shifting for multiplication and
division. This is important to allow for rapid calculation and plotting at the
rate required for smooth signal viewing—in this case, the thread runs 200 times
per second. The tradeoff here is that to maintain the ability of using bit
shifting, especially, you must do all multiplication and division by powers of
two, which can sometimes result in an approximated answer instead of an exact
answer. However, the benefit of speed and efficiency outweighs the mathematical
challenge and compromises.
Besides necessary initialization code to
set up the TFT and ADC, the code is broken into two primary sections. Firstly,
functions to fill various stacks of data for processing are written to be
called by the TFT thread. The TFT thread reads the ADC, stores data points, and
performs digital signal processing (DSP) on the raw data input to produce a
signal for displaying and beat detection.
Stack Functions:
·
push_input
·
push_output
·
push_deriv
·
push_detect
·
push_time
All of these functions fill a stack, and
then proceed to “push” values into the stack, such that the newest value is the
last value in the stack array, and the oldest is removed from the stack. Individually,
it is important to understand when each of these stack functions are used
before understanding the functionality of the DSP and algorithmic procedures of
the TFT thread.
The function push_input stores 256 values
of raw data input.
The function push_output stores 256 values
of band-pass filtered input data. In other words, it is the raw signal
filtered. Data is called from this output stack to plot on the TFT display.
The function push_deriv stores 256 values
of filtered (output) data differences, which approximate a derivative. This
data is further processed in order to detect heartbeats.
The function push_detect stores 256 values
of the further processed differences to be used in the conditional algorithm
for beat detection.
The function push_time stores 2 time
values. These time values are used to calculate the instantaneous heart rate.
The other major part of the program, the
TFT thread, uses these functions to process the incoming signal and display it
on the screen along with the heart rate and beat counter. The functional order
of the thread is as follows:
·
Read
the ADC
·
Store
the ADC value in the input stack
·
Perform
an 8-sample average (low pass filter)
·
Perform
a full-stack (256 sample) average and subtract this value from the low pass
filter average
·
Store
the difference of the averages in the output stack
o
This
marks the end of the signal processing for displaying
·
Take
the difference between the most recent samples that are 4 samples apart
(current sample and 4 samples ago)
·
Store
the difference value into the derivative stack (push_deriv)
·
Take
a second derivative (another difference), but this time of the values stored in
the deriv stack and only between the last two recent samples
·
Store
this value into the detect stack (push_detect)
·
Define
threshold and enter conditional statements (threshold condition and time
condition) that, when true, perform the heartrate algorithm and visual
detection cue
·
Plot
the data by defining a TFT y-position over a thread-incremented x-position
(x-position scrolls and loops with time and the space directly in front of the
current x-position is cleared for new plot points)
The initial 8-sample averaging serves as a
low pass filter because by averaging a group of samples, slow changes in
amplitude are retained and high-frequency fluctuations (especially those that
are lower amplitude compared to the lower frequency desired signal) are
smoothed. The average of the higher frequency noise signals can be assumed to
fall on the lower frequency waveform. The number of samples that are averaged
with respect to the sampling rate to get one output sample determines the
cutoff frequency of the averaging filter. The fewer the samples in the average,
the higher the cutoff frequency and vice versa. Therefore, it is important to
find an appropriate number of samples to average that results in a low pass
cutoff frequency similar to those used in the analog low pass filters. Going by
powers of two for bit shifting, reasonable numbers of samples to average
include 2, 4, 8, and 16 (right shift by 1, 2, 3, and 4, respectively). Averaging
2 and 4 samples results in too much noise retention, and 16 smooths the signal
too much, so averaging 8 is an appropriate amount while maintaining the ability
to bit shift. Again, this is a slight tradeoff because 8 samples slightly
smooths the QRS complex (the highest frequency component of the ECG waveform). It
does, however, maintain most of the characteristics of the waveform—it just
loses some of the sharpness usually associated with it.
Following the low pass averaging, the
program averages an entire stack worth of samples (256 samples), which
essentially retrieves the DC offset associated with baseline voltage drift
commonly found in unprocessed ECG signals. Since this is the target for attenuation
by a low cutoff frequency high pass filter, averaging the signal and getting an
approximation of the DC offset allows us to subtract that off from the low pass
averaged signal to achieve the desired result. This is effectively a bandpass
filter, which at this point leaves the signal ready for printing on the display.
Because the signal can vary between
people, it is important to continue processing using different methods behind
the scenes in order to more reliably detect QRS complexes between users. A
threshold could be set to detect rising peaks in the filtered waveform, but the
amplitude can vary and there can still be some drift because the high pass
averaging is not perfect, causing some peaks to miss the target if it dips
below. The way that this problem was solved in the program was to continue
processing by taking the difference of points in the filtered signal. It was
experimentally determined that taking the difference between samples four
samples apart led to very nice amplification of the QRS complex and some
attenuation of the large T-wave. It eliminated the P-wave. Furthermore, taking
the derivative nearly completely eliminates all remaining DC offset. However,
only one derivative did not adequately eliminate the T-wave. To combat this, an
average of the derivative data was attempted, but it did not always provide
desirable results. Therefore, it was discovered that taking a second derivative
nearly completely eliminated what remained of the T-wave and maintained the
intensity of the QRS complex. This second derivative took the difference
between adjacent samples, because the first derivative created quite rapid
changes in the QRS signal, but not so much in the T-wave signal, which explains
why the T-wave was practically removed (the points within the T-wave were much
more condensed). It should be noted here this algorithm was inspired by the Pan
and Tompkins algorithm developed for real-time QRS detection [8]. In their
algorithm, a bandpass filter is implemented using precise low and high pass
filters using difference equations, followed by signal differentiation,
squaring, and a moving average filter that allowed for consistent and accurate
QRS detections. This method is highly effective but requires more arithmetic
than the method implemented in this project. The algorithm used in this project
requires very little computing power in order to detect QRS complexes, because
it only requires taking a couple of differences that approximate a real-time
double derivative and a condition check before implementing the post-detection
software protocol.
During this process, there were points
that went negative, so to remove those, they were set to 0 to avoid confusion
(especially during troubleshooting because they derivatives were plotted on the
screen). Since the DC offset was completely eliminated by the derivatives, it
was easy to center the derivative signal around a certain y-position on the TFT
by adding 180 pixels (the y-axis consists of 240 pixels, where pixel 0 is on
the top of the screen when viewed in the orientation shown above) to bring the
signal down about 2/3 down the screen. The pulses associated with each beat
were of consistent amplitude, which surpassed a pixel value of 140 every time,
especially with some gain. Therefore, a threshold was set for the second
derivative value that, when surpassed, indicated a heartbeat. This indication
only occurred if the time difference between the current time and the last
detection is over 100 milliseconds, which equates to an impossible heart rate
for humans (600 beats/minute). This double condition also prevents false
detections from especially large T-waves that may not have been entirely wiped
out by the second derivative.
When a QRS detection occurs, the time is
stored in the time stack, and the heart rate is determined by the following
equation:
![]()
This is the only part of the program that
uses floating point arithmetic, because it is important to calculate more
precise values for heart rate. To provide further robustness in the software,
there is another condition implemented that checks if the heart rate is above
200 or below 50 beats per minute. If it is true, then the screen prints
“waiting for signal” because the behavior of the signal is erratic when no
contact is made with the electrodes, which inherently makes its way through the
first two conditions very rapidly or slowly. This is, in a sense, a detector
for whether or not contact is being made with the electrodes. It is not
perfect, however, and does sometimes manage to “detect” complexes within a
normal heart rate range, falsely displaying a reasonable heart rate. This is a
tradeoff, but the condition is an easy implementation that improves usability
and provides insight into the state of the device.
Following this analysis, heart rate
calculations, and printing, the filtered signal is plotted onto the TFT. As
mentioned before, the remainder of the gain would be applied in software. When
printing, the value of the bandpass filter output is multiplied by 2, resulting
in an overall gain of about 800. On screen, this spans about 1/3 of the screen,
which is an acceptable amount of coverage that maintains signal clarity and
high resolution. More gain made the signal noisier on screen. Additionally,
because the signal was centered around the middle of the ADC range, the output
value must be decreased to a level that corresponds to a pixel range between 0
and 240. By experimental analysis, it was determined that 380 ADC units taken
off the signal nicely positioned the signal on the TFT and kept it on screen
without overlapping with the data/messages printed at the top.
Logical Flow of this Device
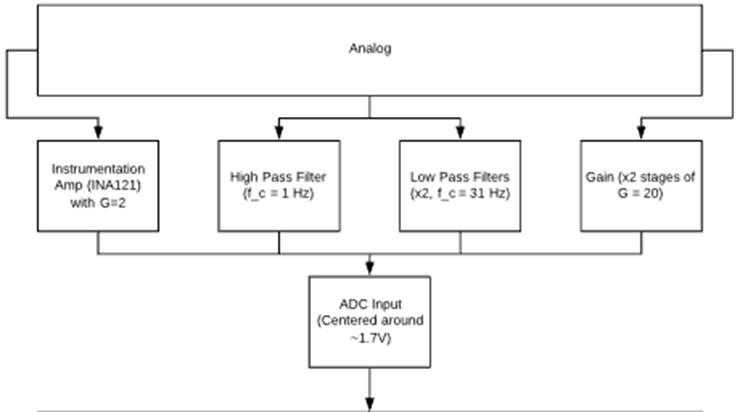
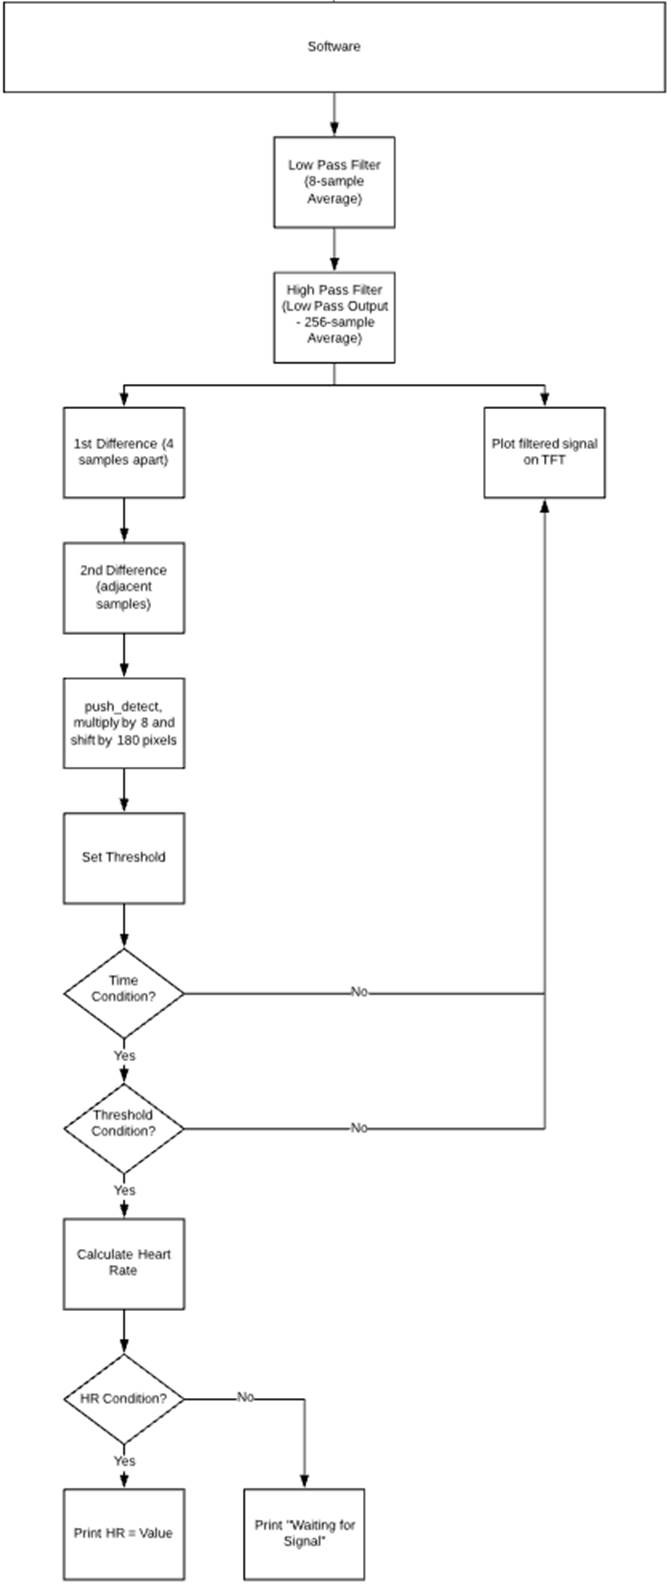
Figure 5: Flowchart describing the logical
flow of this device.
Applicable Standards and Existing
Devices
Devices with medical/wellness intent have
applicable standards surrounding patient/user safety. For this project, it is
especially important to consider the electrical safety standards. Namely, the
IEC 60601-1-11, which covers medical electrical equipment, and the general
basic safety requirements and essential performance [9].
Similar devices include wellness devices
on the market for ECG monitoring, which range in price between $50 and $150. Other
devices include more features for more comprehensive vital signs monitoring and
can cost upwards of $500. There are even mobile apps that interface with
hardware (namely, KardiaMobile) to display ECG signals. More clinically
prevalent are devices called Holter monitors, which monitor cardiac
electrophysiology over time for physicians to assess. It provides more
information about how the heart functions over a longer time period than a
short ECG analysis in the clinic would provide [10].
My device does not use any copyrighted,
trademarked, or otherwise published intellectual property, but does perform
similar functions to many products on the market.
Results of the Design
The efforts put forth in this project have
led to the creation of a device that successfully reads and displays a clean
ECG signal and instantaneous heart rate. The device only requires that one
electrode is placed on the body as a reference; the other two electrodes can
make contact at a fingertip of each hand. This design also does not require the
use of conductive electrode gel to produce a clean signal. These design
characteristics improve usability and convenience to users, because they limit
prep time and complexity of use. The most time-consuming part of the process
comes with applying the reference electrode, but this preparatory process could
have been exacerbated by requiring the application of three electrodes. Furthermore,
it supports use by people with disabilities. At the start of this project, a
concern regarding user independence included people with radioulnar synostosis,
who have limited rotational capability in their wrists. This was before the
discovery that the signal can travel equally well through fingertips. With this
knowledge, there is more freedom for users using this device. However, people
who have lost their vision or have always been blind would not be able to use
this device independently as it currently stands, because it does not have an
auditory component delivering the same information that can be gathered by the
screen.
By the end of the production of this
device prototype, the circuit was condensed onto a solderable protoboard. This
condensed circuit was robust with strong and consistent electrical connections.
The breadboard that the circuit was originally built on featured many more
wires, which were not trimmed to perfect length creating more entry points for
electrical noise. Furthermore, the components were susceptible to inconsistent
connections in the solderless channels, especially if the circuit was bumped or
moved. After the circuit was condensed strategically and secured with solder,
the signal received on the ADC was much more consistent and smooth, and did not
change under various conditions. It has proven its robustness during many
repeated uses, including after moving from room to room, inside to outside, and
in various temperatures. Refer to the image below which shows a comparison of
the circuit construction before and after soldering.
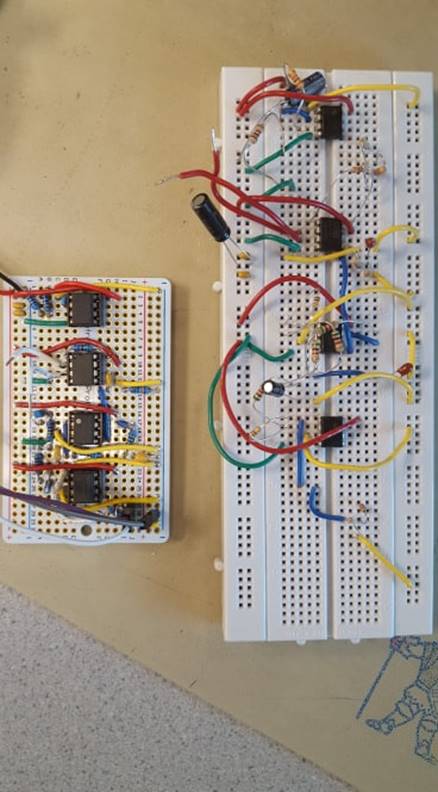
Figure 6: Evolution of the analog circuit
design and implementation.
To ensure safety while using this device,
it was designed to be powered only by batteries. This system was designed to
work with 9V and +/-4.5 V for the analog circuitry, but throughout testing and
use, it has been shown that the system and display works just as expected with
a range of 7V to 9V. This means that the device will work with a battery
throughout most of its battery life, which is great for usability and
convenience, as well as financially by preventing excessive battery purchases. Environmentally,
this is good because it reduces battery waste and/or reduces the frequency of
recharging if rechargeable batteries are used. Currently, the device requires
two batteries—one for the analog circuit and one for the SECABB development
board. In the future, the use of only one battery by using a different build of
the SECABB board without the barrel jack port that will instead include leads
to connect to the common power source will be considered.
Regarding device development and testing,
this device was designed primarily using my own ECG signal. However, upon
testing on a few different people, the device seems to work consistently and as
expected, which supports the claims of its robustness.
Notes on speed and accuracy:
·
Due
to the focus on fixed-point algorithms, there is no noticeable hesitation and
the screen is easy to monitor.
·
The
accuracy of the heart rate is high (instantaneous) because fixed-point
approximations are not used—floating point arithmetic is used to retrieve a
more precise heart rate between beats.
·
When
the system is not connected to the electrode contact points on the fingers,
there is sometimes flicker due to rapid redrawing of “Waiting for Signal”, but
in normal operation, there is no noticeable flicker because messages are not drawn
every single time and are only drawn when the conditions are satisfied. Furthermore,
when the heart rate is consistent, the only major drawing that occurs besides
the plotted signal is the value of the heart rate—if the printed line “Heart
Rate =” is printed during normal operation, it does not get redrawn until the
conditions change. This optimized performance and visual appearance, and is
especially important considering the sample rate of 200 samples per second.
·
As
mentioned, prior, the averaging that was done in the DSP portion of the signal
processing chain slightly smoothed some of the sharper characteristics of the
ECG signal (namely the QRS complex), which is a slightly inaccurate
representation of the true morphology of the signal. However, this was done as
a tradeoff in order to have vastly superior fixed-point and bit-shifting
arithmetic capability.
See the video posted to YouTube using the
link below; it shows the system being operated and includes a brief explanation
of the different components, both hardware and software, included in the
design.
Video – Electrocardiogram
to Heart Rate
Ethical Considerations
This project follows all aspects of the ethical
code described in the IEEE Code of Ethics. One important note, though, is to
remember that this device does have the potential to expose adverse and/or
abnormal health conditions related to the heart. Therefore, all users must be
willing to make that information “public” to individuals witnessing the
resultant signal, else take caution in using the device where private
information regarding user health may be leaked.
Conclusions
In this project, I was successfully able
to create a portable ECG monitor powered only by batteries. I claim that it has
the ability to display a filtered electrophysiological signal originating from
the heart. My expectations at the start were to be able to implement the
Pan-Tompkins algorithm in software to filter an ECG signal and identify QRS
complexes from the human body. This signal would be printed on the TFT display
in a scrolling fashion, and a small speaker would be used to cause a beep upon
recognition of a heartbeat. This plan changed slightly during the development
of this project as I learned more about digital signal processing options. I
spent more time writing algorithms that made intuitive sense and allowed for
easy changes to filter parameters such as cutoff frequency and gain. In the
end, I was left with a software design that was efficient to run on the
microcontroller, as well as easy to understand by a user. This iteration of the
design does not include an auditory component, but future iterations will
include this feature. Despite changing my approach to the software and going a
more intuitive route that is helpful for the user and perhaps easier on the
microcontroller, I would like to explore the Pan-Tompkins algorithm further to
evaluate its similarities and differences to my approach.
It was critical to design this device
using stringent safety measures. Namely, this device needed an isolated power
supply, so it was designed to work with batteries with no connection to the
main power supply. This ensures safety and conformity to the electrical safety
standards (IEC 60601-1-11). Furthermore, the circuit is designed to draw very
little current, which further ensures safety when using electrodes attached to
the body. This device also heavily considers ethics and recognizes that users
should be wary of exposing any known or unknown health conditions related to
the heart.
Regarding intellectual property
considerations, this design borrowed code written by Bruce Land that
specifically sets up the ADC on the PIC32 [11], and the development board for
the PIC32. The rest of the project hardware and code did not borrow any prior
art, published or otherwise, in the analog circuitry or software other than
components such as operational amplifiers [12,13]. This project in itself was
more of an attempt to gain understanding in cardiac electrophysiology, analog
circuit and filter design, and digital signal processing. I did not aim to
attempt to create anything particularly novel, and I did not aim to produce
publishable material. Nonetheless, it was a phenomenal learning experience for
someone with less experience in electrical engineering and software, and I
greatly enjoyed the project.
References
[1] KG, R. (2019).
Capturing small ECG signals in medical applications. [online]
Rohde-schwarz.com. Available at: https://www.rohde-schwarz.com/us/applications/capturing-small-ecg-signals-in-medical-applications-application-card_56279-152385.html.
[2] Cedars-sinai.org.
(2019). Atrial Flutter | Cedars-Sinai. [online] Available at:
https://www.cedars-sinai.org/health-library/diseases-and-conditions/a/atrial-flutter-1.html.
[3] Atrial
Fibrillation Anatomy, ECG and Stroke, Animation. (2019). YouTube.
[online] Available at: https://www.youtube.com/watch?v=tPqs4xKPG3A.
[4] Cvphysiology.com.
(2019). CV Physiology | Electrocardiogram (EKG, ECG). [online] Available
at: https://www.cvphysiology.com/Arrhythmias/A009.
[5] R. A. Wolthuis, V.
F. Froelicher, A. Hopkirk, J. R. Fischer, and N. Keiser, “Normal
electrocardiographic waveform characteristics during treadmill exercise
testing.,” Circulation, vol. 60, no. 5, pp. 1028–1035, 1979.
[6] Popovic,
Djordje. Noise in ECG and how to deal with it. Lecture (PowerPoint) from
University of Southern California.
[7] Carrol, Sean. SECABB
v2.1 Development Board Designer. Cornell University, ECE. 2017.
[8] Pan, J. and
Tompkins, W. (1985). A Real-Time QRS Detection Algorithm. IEEE Transactions
on Biomedical Engineering, BME-32(3), pp.230-236.
[9] D.L.S. Electronic
Systems, Inc. (2019). IEC 60601-1-11: Medical electrical equipment - General
requirements for basic safety and essential performance - Collateral standard:
Requirements for medical electrical equipment and medical electrical systems
used in the home healthcare environment - D.L.S. Electronic Systems, Inc..
[online] Available at:
https://www.dlsemc.com/ms-iec-60601-1-11-medical-electrical-equipment-general-requirements-for-basic-safety-and-essential-performance-collateral-standard-requirements-for-medical-electrical-equipment-and-medical-e/.
[10] Healthline.
(2019). 24-Hour Holter Monitoring: Purpose, Procedure, and Results.
[online] Available at: https://www.healthline.com/health/holter-monitor-24h.
[11] Land, B. PIC32
architecture code. Accessed at: http://people.ece.cornell.edu/land/courses/ece4760/PIC32/index_ADC.html
[12] Burr Brown, “Low
Power Instrumentation Amplifier,” PDS-1412A, 1997.
[13] Texas Instruments, “LMx58-N
Low-Power, Dual-Operational Amplifiers,” SNOSBT3I, 2000.
Appendix
A – Permissions
I
approve this report for inclusion on the course website.
I
approve the video inclusion on the course YouTube channel.
Appendix
B – Cost Analysis
Table
B1 – Cost Breakdown of the Project
|
Item |
Quantity |
Cost ($) |
From: |
|
9V Battery |
2 |
4 |
ECE Lab |
|
INA121 |
1 |
4 |
Burr Brown |
|
LM358 |
3 |
1 |
Texas Instruments |
|
ECG Electrodes |
Cost Approximated |
5 |
Retrieved from ECE Lab |
|
Resistors/Capacitors/Wires |
~10 each |
1 |
ECE Lab |
|
SECABB v2.1 |
1 |
10 |
ECE Lab |
|
Small Solder Board |
1 |
1 |
ECE Lab |
|
PIC32MX250F128B |
1 |
5 |
Microchip |
|
TFT Display |
1 |
10 |
ECE Lab |
|
Total |
41 |
|
|
Appendix
C – Schematics
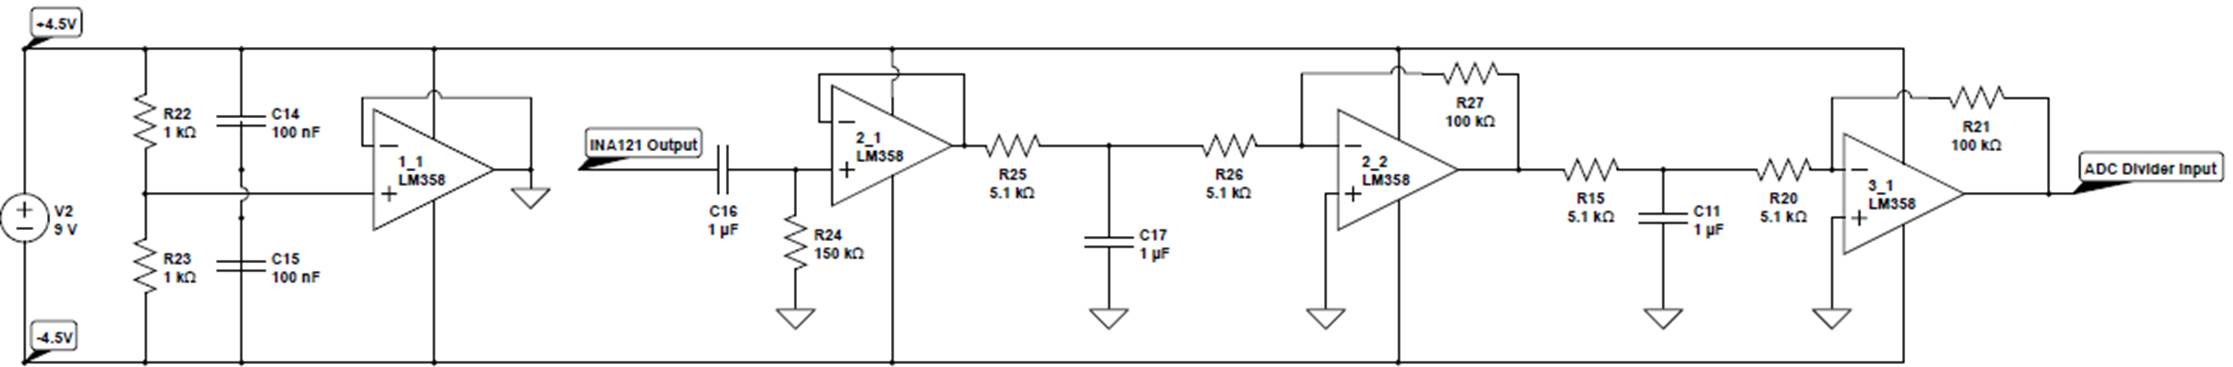
Figure
C1 – Overall circuit design
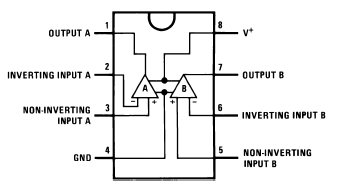
Figure
C2 – LM358 pinout [13]
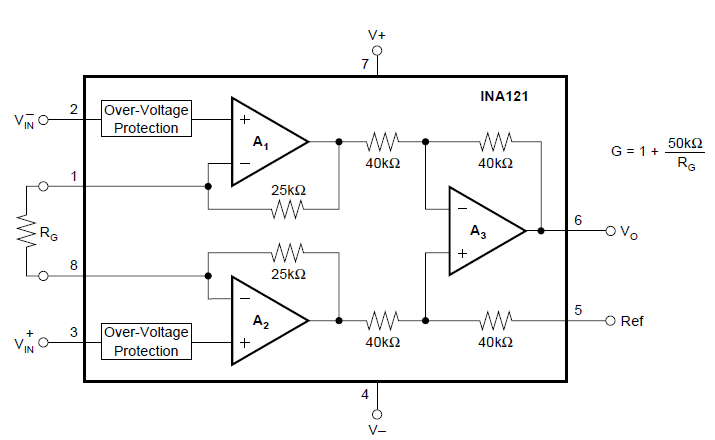
Figure
C3 – INA121 pinout and wiring [12]
Appendix
D – Acknowledgements
I
wish to acknowledge Professor Bruce Land and the teaching assistants for their
extremely helpful roles in the development of this project.
Appendix
E – Program Listing
Built using Protothreads and compiled
in MPLAB X IDE v3.05