BioNB 2220: Introduction to Neurobiology
Computational Section – Final Project
Exploring
a Case of Emergent Synchronization
by Billy Podlaski
Introduction
I began my final project intending to study simple network motifs in the hope that I might stumble upon something interesting to explore. During the process, I came across a particular behavior that I found intriguing, and it was seemingly unexplainable.
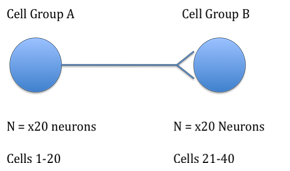
Using the Izhikevich Model of the neuron in matlab (http://vesicle.nsi.edu/users/izhikevich/publications/spikes.htm), I created a system of 40 neurons, all tonically firing (cell type 1). The cells were equally divided into two groups, which I refer to as group A and group B. Group A, consisting of twenty neurons, had no synaptic input from any cells, but synapsed with each of the twenty neurons in group B. The cells in group B did not have any other synaptic connections.
In order to simulate this in matlab, I made a grid for synaptic strength:
SynStrength = zeros(nNeuron,nNeuron);
SynStrength(1:fix(nNeuron/2),fix(nNeuron/2)+1:nNeuron)=z;
SenseStrength = zeros(nNeuron,nNeuron);
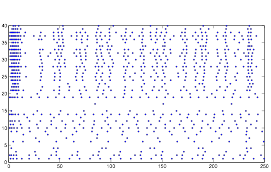
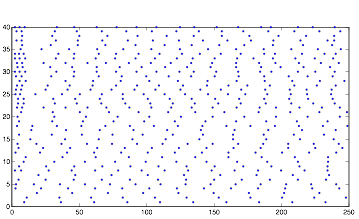
While modeling this system, I discovered what I thought was very unusual behavior. It appeared as though the cells of group B were expressing emergent synchronization, with no overt cause. The picture below is an example of the output from one such simulation, with a positive synaptic strength, and randomness both in the voltage and current of all cells equally. (r = 10.*randn(1,100);)
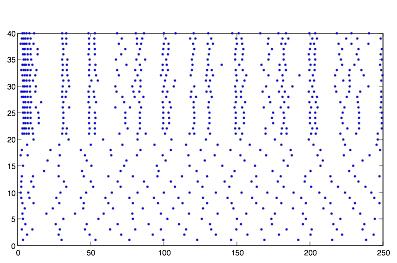
Figure:
2: Sample Behavior of System
So for the majority of my project, I focused on this phenomenon. I studied it with three specific variables in mind: synaptic strength between the cell groups, randomness in the input current to the cells, and randomness in the resting potential of the cells. Each variable was held consistent during each trial, so that each cell sustained the same synaptic strength, and the random distribution was the same for each cell (but not the actual value).
Methods
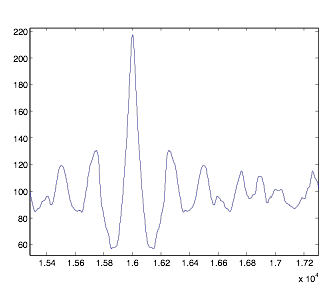
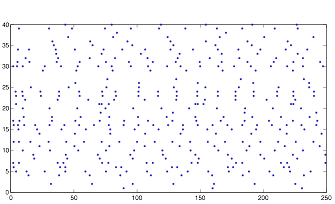
The main method I used in my study was autocorrelation, which is a tool for finding underlying patterns in data. Normally, one would compare the correlation of two functions with one another; autocorrelation simply means that the one series is being compared with itself, slightly shifted. Just as an example, here is one arbitrary graph, so that I may explain how I analyzed the graph of autocorrelation:
Figure
3: Sample Autocorrelation Graph
I measured the positions and y-values of the middle spike, along with the trough and spike directly to the right of it. With this, you can make certain conclusions. If you take the difference between the positions of the two max values, and multiply by dt, you get the period of rhythmicity. If you divide the second spike by the larger middle one, you get what I will call “rhythmicity,” which I planned to function as a standard for comparing the graphs. Also, dividing the trough value by the second spike is the noise level. I took the autocorrelation of each group of cells separately.
Here is what the graph looks like for cell group A:
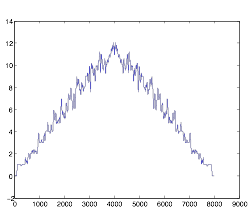
Figure 4:
Autocorrelation of Cell Group A
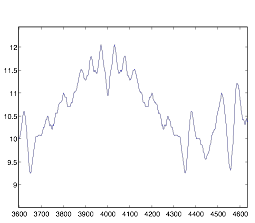
Figure 5:
Autocorrelation of Cell Group A – Zoomed-In
This graph shows that the cells in group A are not very rhythmic. This was the expected result, as I was studying the synchronization in group B, but not in group A. The graph has no middle spike, and it was of no use to me during my study because I was unable to analyze it.
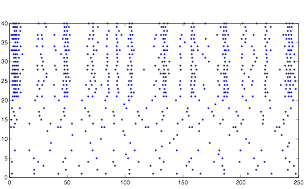
Here is what the graph looks like for cell group B:
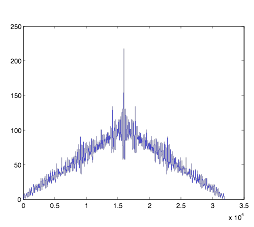
Figure 6:
Autocorrelation of Cell Group B
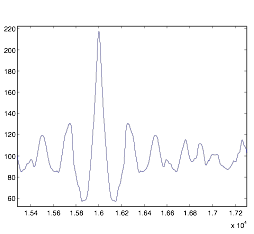
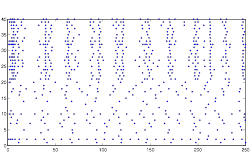
Figure 7:
Autocorrelation of Cell Group B – Zoomed-In
As you can see, the rhythmic quality of this cell group is much greater. Most of the simulations I performed had nice peaks to work with. However, I was a bit uncertain as to how to analyze the data. I devised a simplified way of finding the peaks and trough by going through the points and analyzing the first derivative of the autocorrelation. Shown here:
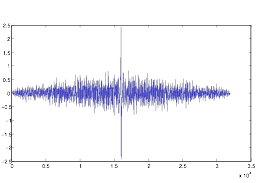
Figure 8: First
Derivative of Autocorrelation of Cell Group B
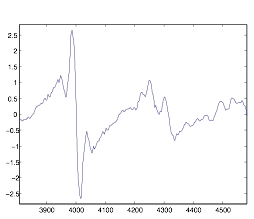
Figure 9: First Derivative
of Autocorrelation of Cell Group B—Zoomed-In
As you can see, while the graph may have distinct points, it is too rough to work very well, so I was eventually unsuccessful at extracting data from it. The autocorrelation in general I found to be much too erroneous for proper quantitative analysis in the way I was using it.
Results
The first investigation I performed was to take a look at the intrinsic properties of the tonically firing cells to see if it was possible to get this type of behavior from a single cell. First, I applied a large amount of steady positive current to the single cell. The results are shown below:
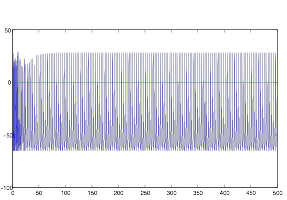
Figure 10: Tonic Cell
with Constant Currnet
It is clear that the cell fires constantly and shows no signs of rhythm or bursting. Therefore, I concluded that it must have been the pattern of synaptic input making the cells of group B fire the way they did.
I then took the current from a single cell from group B and applied it to a single cell, just to visualize it. An example can be found here:
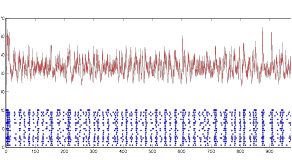
Figure 11: Rhythmic
Behavior of Cell Group B (blue) and Synaptic Current (red)
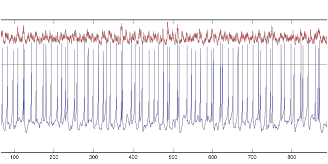
Figure 12:Voltage
(blue) and Current (red) of single tonic cell
As the figures clearly display, the cell does not fire tonically, but instead bursts, based on the specific input it receives. It certainly does not fire tonically. Next I considered altering the resting potential of the cell to see if it would have any effect on the behavior:
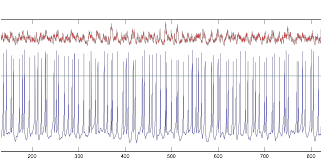
Figure 13: V (blue)
and I (red) of tonic cell, Resting Potential=-85mV
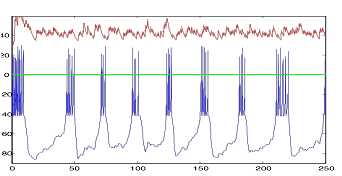
Figure 14: V (blue)
and I (red) of tonic cell, Resting Potential=-65 mV
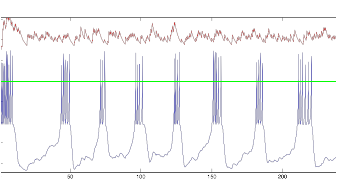
Figure 15: V (blue)
and I (red) of tonic cell, Resting Potential=-45mV
This led me to hypothesize that the randomness in the starting voltage was affecting the behavior of the cells in a particular way.
Next, I varied dt to see if the timestep was having an effect on the rhythmic property. It was possible that it was an artifact. For this experiment, I varied dt between 1/8, 1/16, 1/32 and 1/64. Upon going to a finer time step, I found that the rhythmicity value I got had a lot of error because the graph got very jumpy. However, I found that these four values were enough to prove the point.
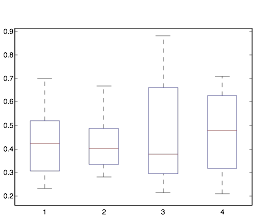
Figure 16: Box Plot of
Varying dt: (1=1/8,2=1/16,3=1/32,4=1/64)
It was also possible that the rhythmic quality was an effect of the random distribution, from the variation in resting potential and current. I changed the random distribution in the cells, using both randn and rand. Here is a simple example of my results, which displays how the rhythmicity is present in both:
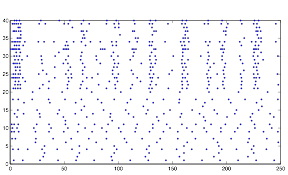
Figure 17: Sample
Behavior using randn
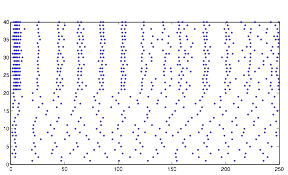
Figure 18: Sample
Behavior using rand
Finally, my intention was to perform a simulation of the system, varying the randomness in current and voltage, as well as the synaptic strength (each with at least 10 variables). I then planned to graph the results, at least for cell group B, in 3D coordinates to see if I could get any conclusions from them.
However, because of all of the trouble I had with autocorrelation, the data I accumulated from these simulations had too much error. I was eventually forced to abandon the use of autocorrelation as a tool for my analysis.
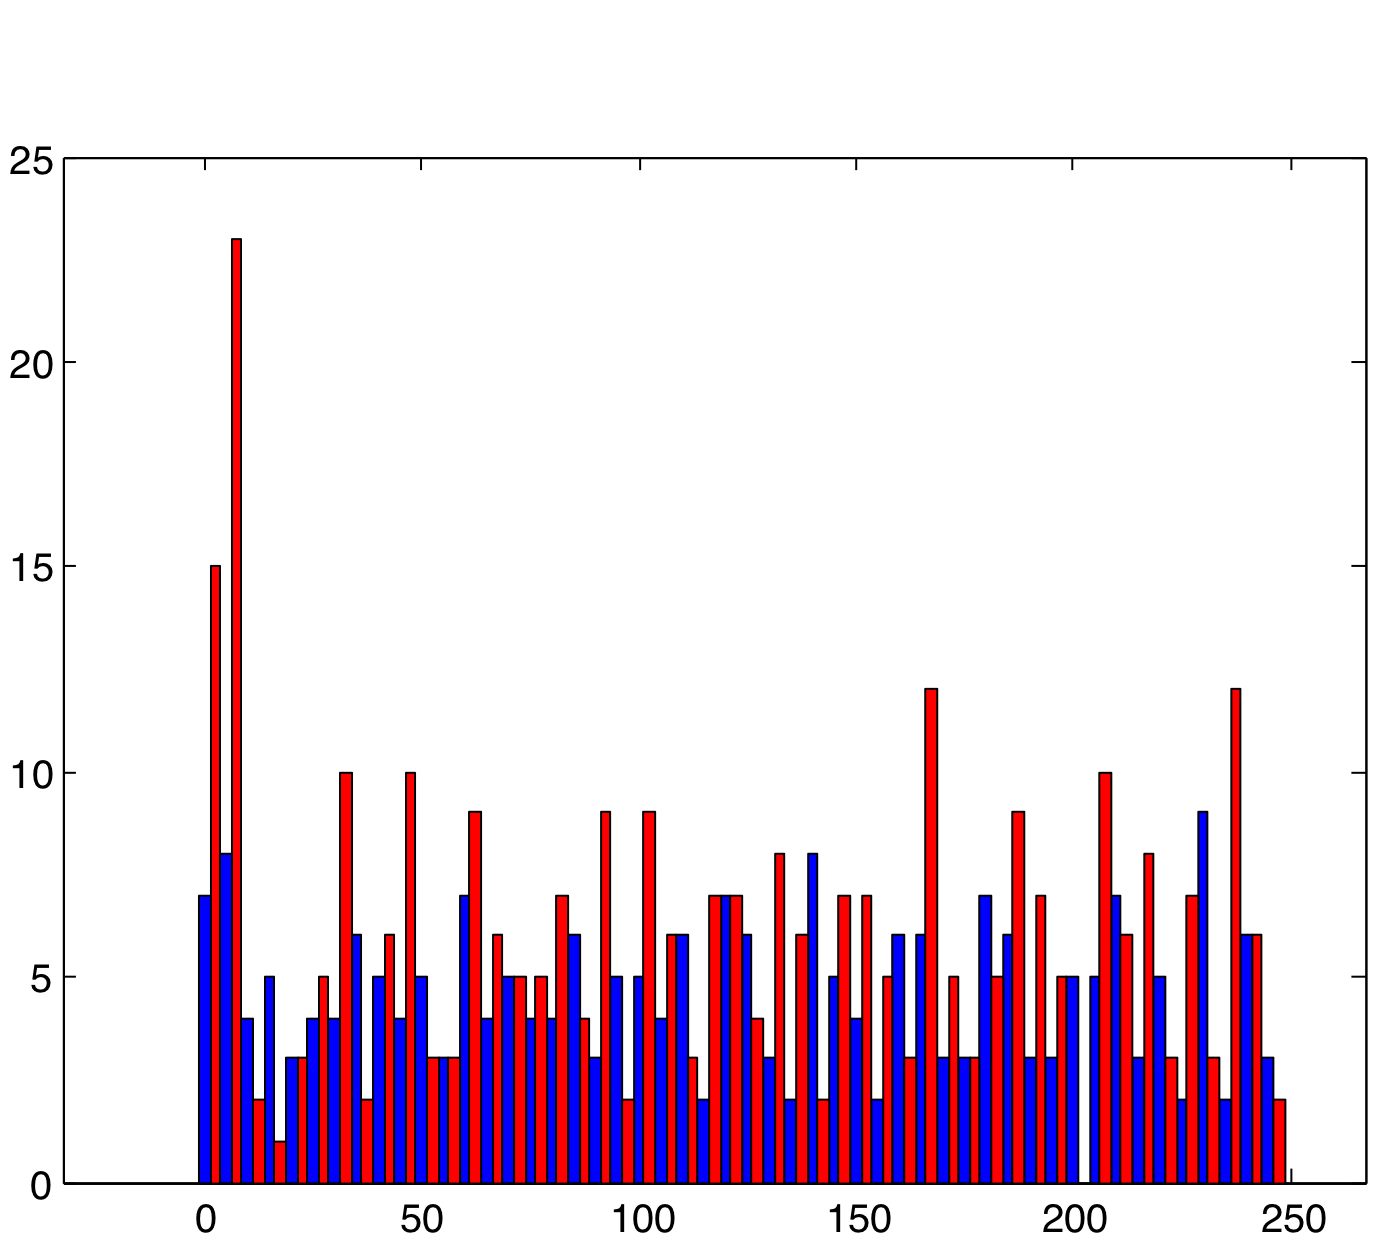
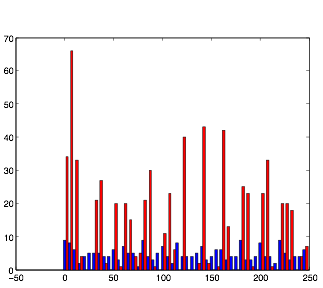
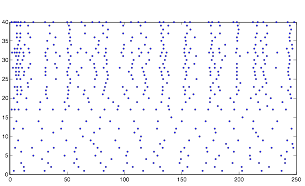
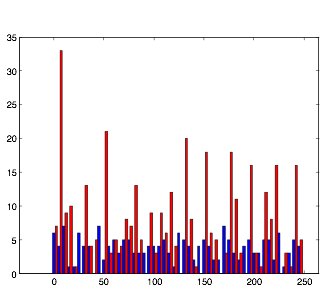
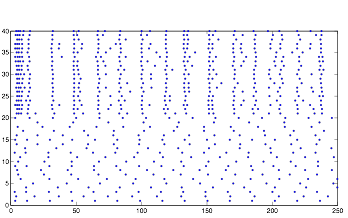
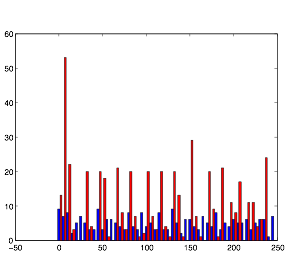
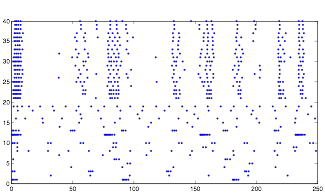
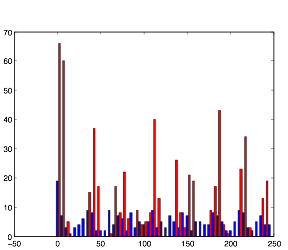
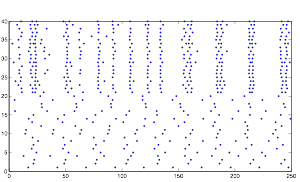
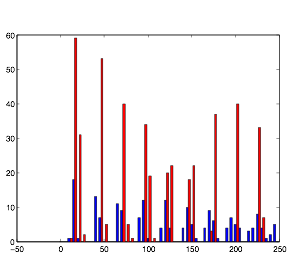
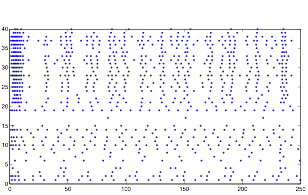
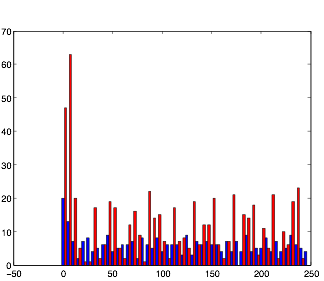
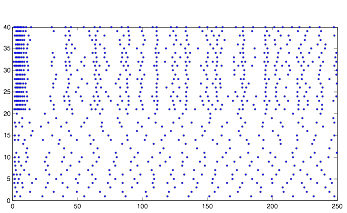
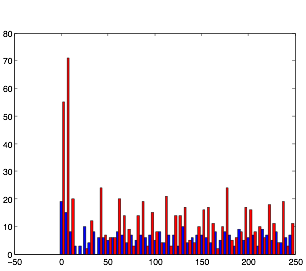
So instead, I collected data for the three variables in a more empirical way. I started with all three variables at an arbitrary level that expressed rhythmic behavior. Then, one at a time, I changed the variables to low and high values to obtain qualitative results. I did this using both randn and rand as my random number generator. The graphs for these results can be found below in the form of raster plots (of both cell groups A and B) and histograms (divided in 5 millisecond time intervals). The bars of the histograms represent the number of action potentials per time interval:
Normal: (using randn)
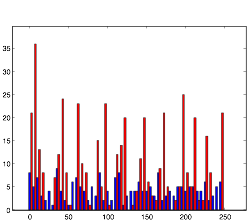
Normal: (using rand)
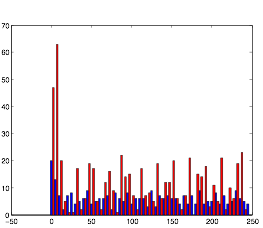
Both of these plots exhibit a somewhat rhythmic behavior, based on arbitrary values I picked that seem to best represent the pattern I was exploring.
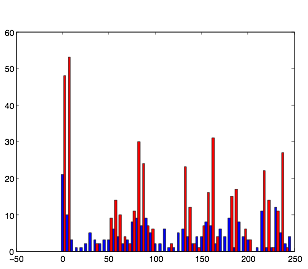
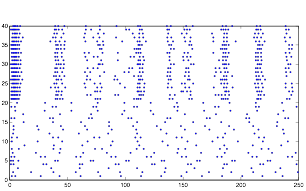
Varying SynStrength: Low (using randn)
Varying SynStrength: Low (using rand)
As would be expected, lowering the synaptic strength decreases the rhythmic behavior of the cells in group B. This is because, once they no longer have the synaptic input, they are virtually the same as cells in group A. The general random behavior they exhibit is due to the randomness in current and voltage.
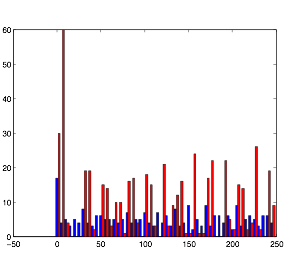
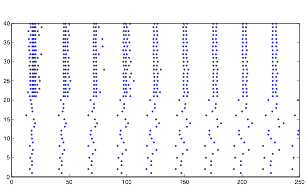
Varying SynStrength: High (using randn)
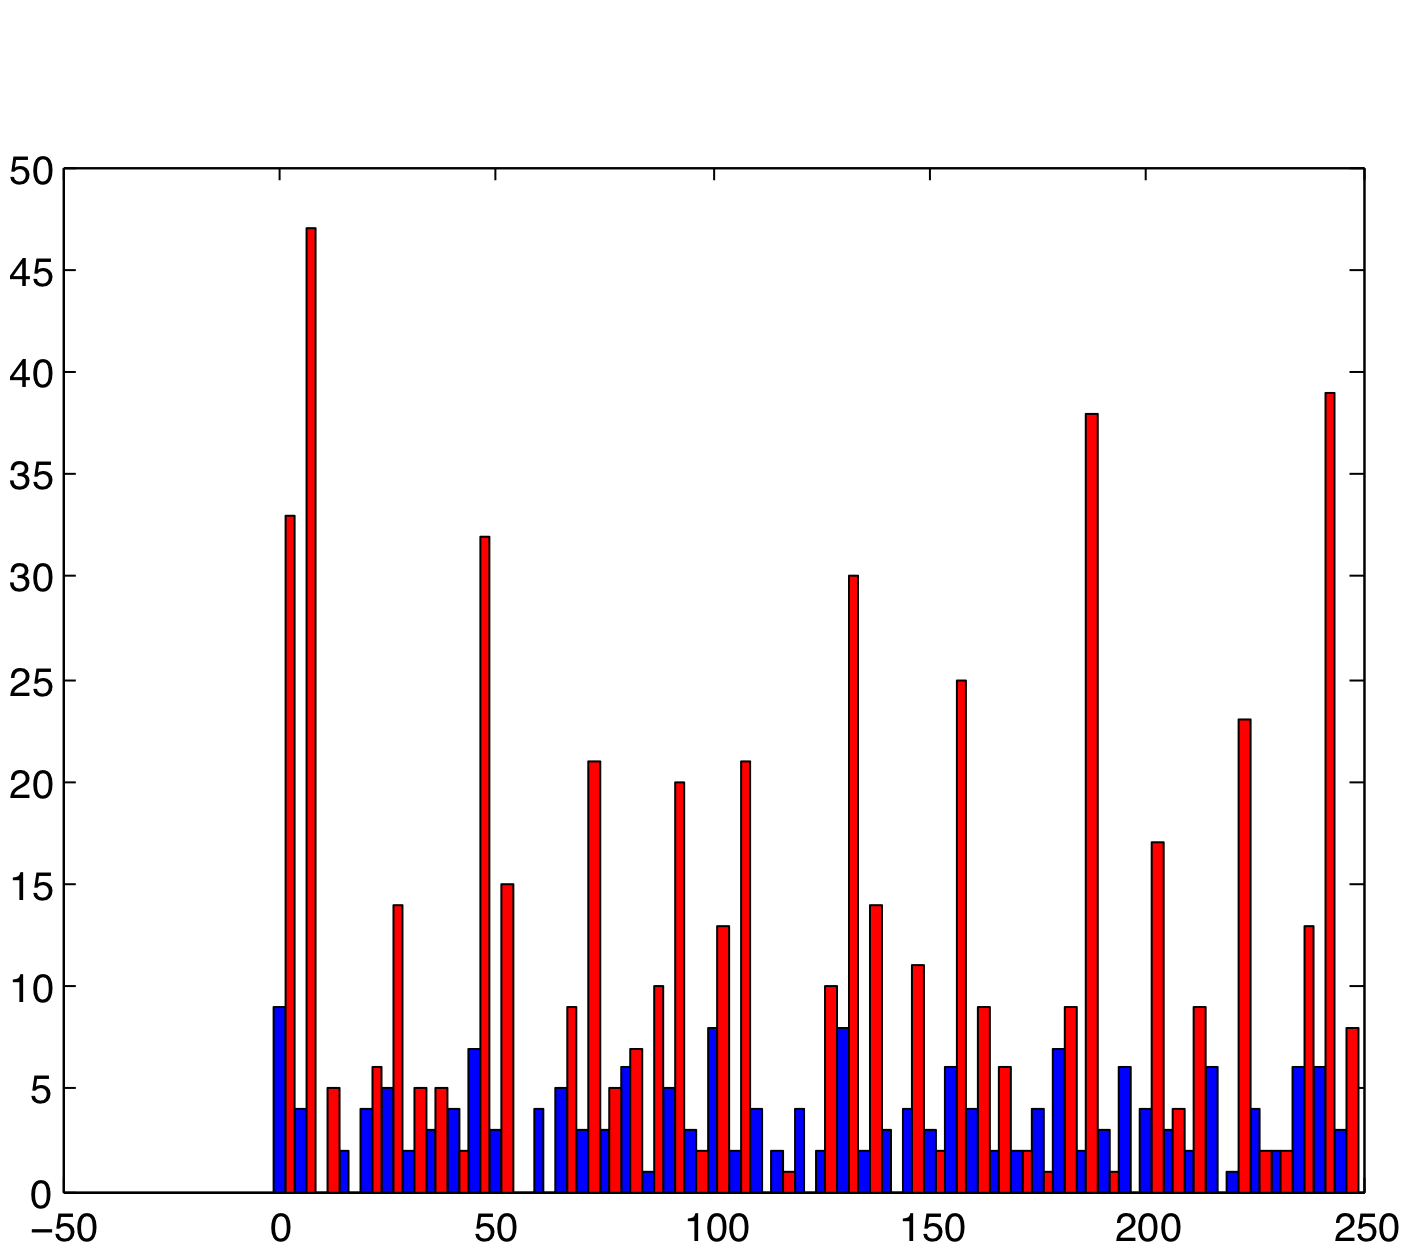
Varying SynStrength: High (using rand)

Directly opposite to the previous one, increasing the synaptic strength also produces the expected result, strengthening whatever the underlying pattern that the cells have is, and causing the cells in group B to exhibit a much more rhythmic pattern.
Varying Randomness in Voltage: Low (using randn)
Varying Randomness in Voltage: Low (using rand)
Lowering the randomness in voltage produces interesting results. The cells in group B still exhibit rhythmic behavior, but they do not appear to burst as much. Relating this back to my investigation with resting potential before, this supports the hypothesis that randomness in voltage causes the cells to display bursting.
Varying Randomness in Voltage: High (using randn)
Varying Randomness in Voltage: High (using rand)
Increasing the randomness in voltage causes an increase in the rhythmic pattern. Furthermore, you will notice that the cells in group A are exhibiting bursting patterns without any synaptic inputs, indicating that this increase in voltage is the cause of the bursting activity. This further supports my hypothesis about the bursting pattern and resting potential.
Varying Randomness in Current: Low (using randn)
Varying randomness in Current: Low (using rand)
Low variation in current produces the greatest rhythmic pattern in the cells. However, it is clear form the graphs that the rhythmic pattern in cell group B is coming from the spiking pattern from cell group A. This is all because of tonic spiking, intrinsic in the neurons.
Varying Randomness in Current: High (using randn)
Varying Randomness in Current: High (using rand)
For this trial, while the rhythmic pattern still remains, increasing randomness in the current appears to add more noise to the pattern.
Conclusion – Future
Study
For any continuation of this project, a likely direction to go in would be to perform a 3D simulation of the system and to graph the results. But first, one would have to devise a more quantitative was of analyzing the results. Something similar to autocorrelation could be applicable. Finally, one last thought would be to compare the firing frequency of each cell in group A to the frequency of the pattern in cell group B to see if there is one cell that is directing the rhythm.