Koé is a high-level, block diagram, data-flow language intended to simulate plug programmable audio gear in a teaching environment. A designer might drag an icon of a sine wave generator into a design area, drag an oscilloscope into the design area, then wire them together by dragging a wire between them. The intention is that real world skills should transfer to/from Koé. A basic set of draggable modules can be combined (with wires) to produce a large range of interesting audio experiments. Basic modules include
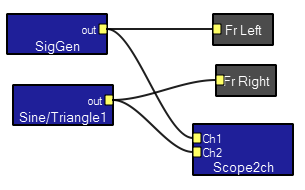
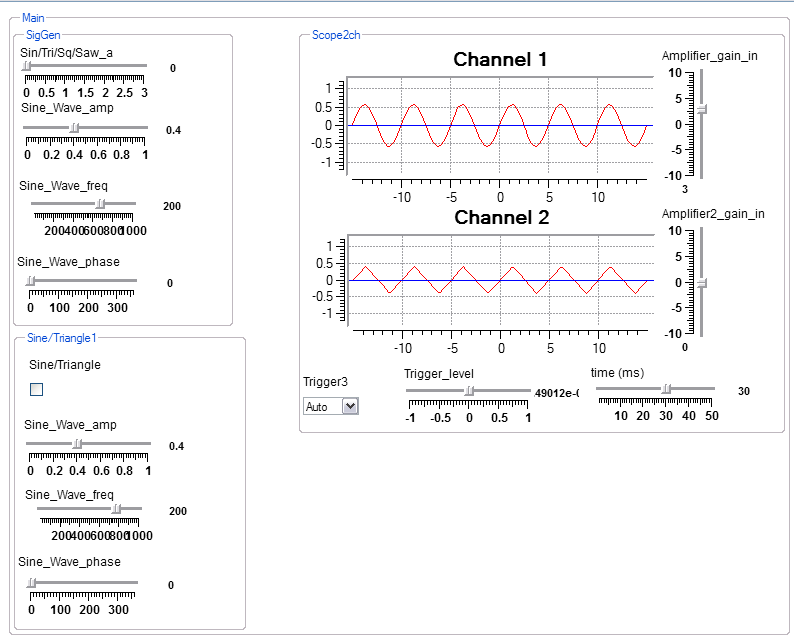
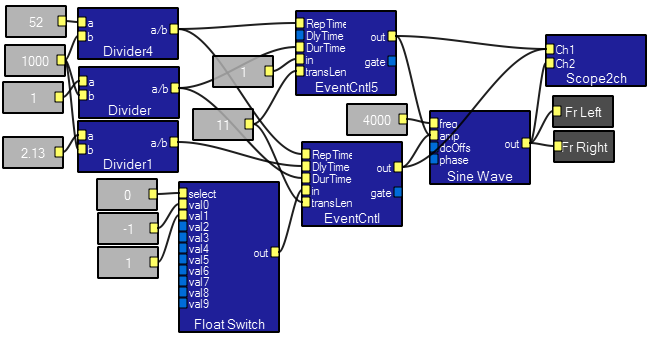
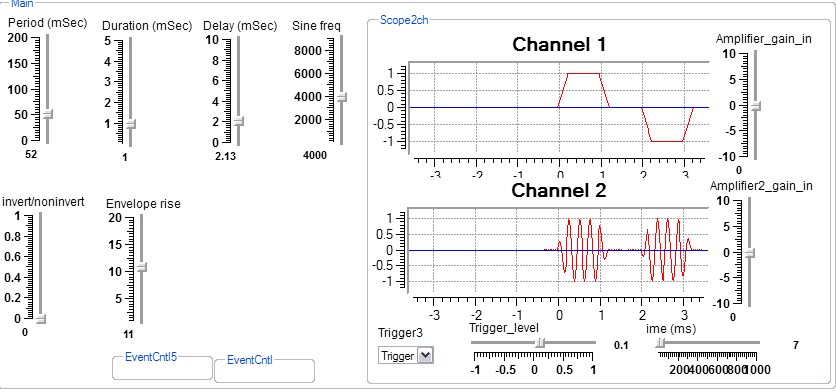
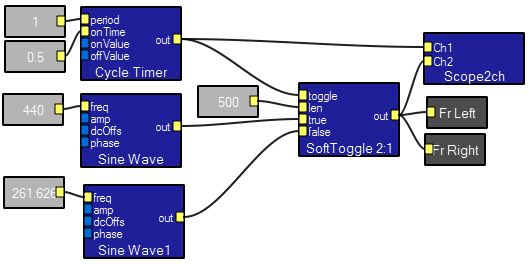
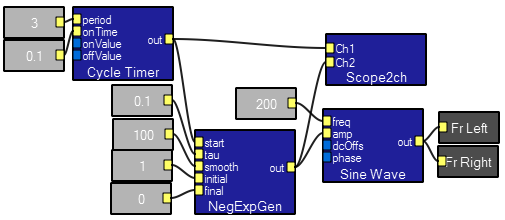
There is an emphasis in Koé on real time audio. The user is able to directly interact with sounds and modify them as they happen. To faciliate real time interaction and to allow non-specialists to use Koé, there are two views of a program. The first is a design view which might be used by an instructor to design an exercise for students. The second is an interactive view which allows a student to manipulate an interface without necessarily knowing how to design. Below is an example of the design view of a simple program followed by the interactive view. The program is based on two modules which encapsulate a signal generator and a sine/triangle generator. The outputs of the two genrerators are feed to the default front-right and front-left computer speakers and to a two-channel oscilloscope. Imbedded in the modules are all the controls seen on the interactive view. The Scope2ch module is a macromodule or macro which contains serveral basic modules, as seen in the third image below. Many users and designers will never need to design a macro, but it can be a powerful feature.
Designer's view
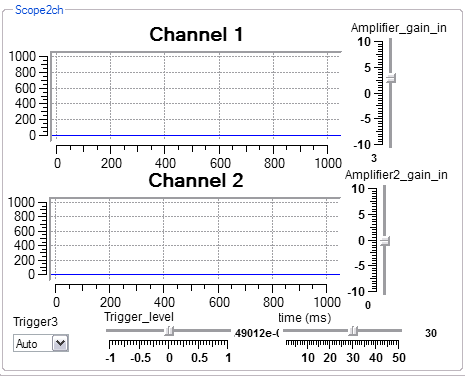
Interactive view.
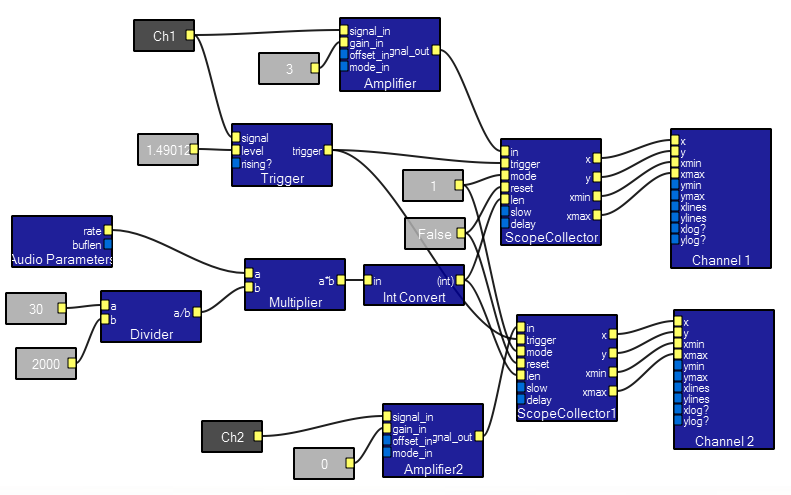
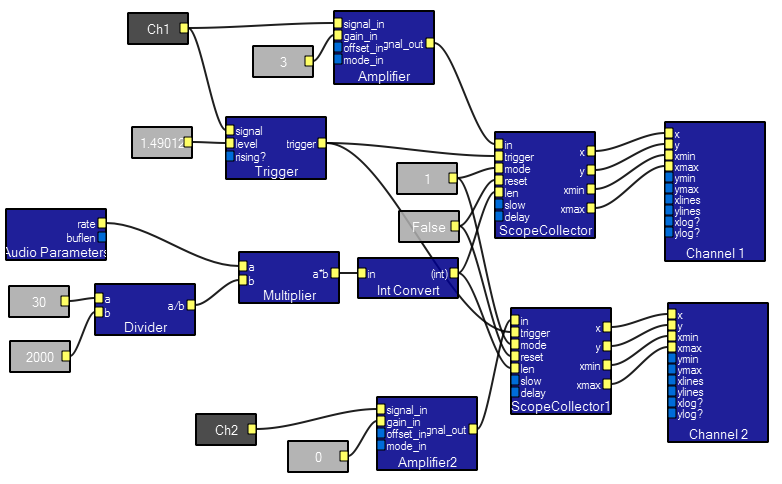
Contents of the Scope2ch macro module. The gray boxes represent interactive contol connections. Some appear in the interactive view above. Others are constants set in the macro itself. This macro manages all of the controls necessary to make a 2 channel oscilloscope.
Koé is designed to aid in teaching sound and signal related concepts. Areas of teaching where we see direct application are:
Koé was originally inspired by the work of Barry Voroba (1978). He used an analog synthesizer to perform a classic set of audio experiments on human psychophysics. References to his book will be made in the examples below.
In each example below, there will be designer's and interactive views, plus a link to download the Koé program. Right click on the link (on a XP machine) or hold down the mouse button (on a Mac) and do a save link as... to save the program to an appropriate folder. Each example is designed to be a simple, but usable, demonstration of the system capibilities and to suggest how Koé can be used in teaching.
The examples in sections to follow:
Converting time delays into preceived position.
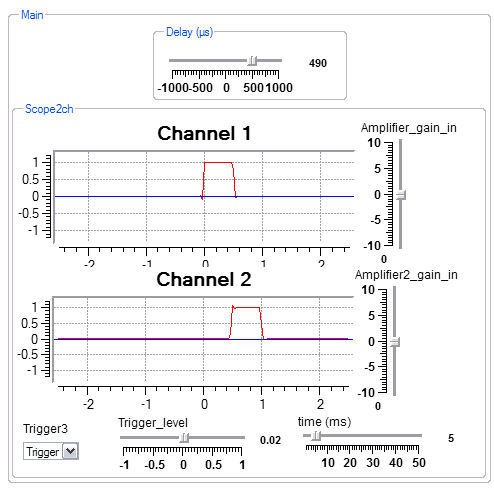
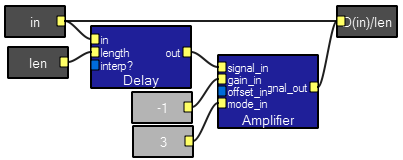
A pair of clicks presented to an person will be perceived as only one click if the pair spacing is less than about the time it takes for sound to travel the width of their head. Further, the relative arrival times at the left and rignt ear will determine the perceived azimuth. This program delays a pulse thorugh two different delays (one fixed), then plays them from the speakers and displays them on a scope. As the delay control is moved, the sound apprears to move from the left to right speaker. Human heads are around 20 cm wide, and the speed of sound is about 300 m/sec. This suggests that a click delay of zero to 600 microseconds should be appropriate to generate perceptions of azmuth direction.
Designer's view.
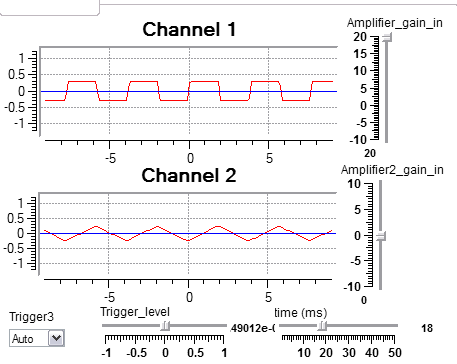
Interactive view. The delay interactor is set to 490 microSec, which can also be seen on the scope.
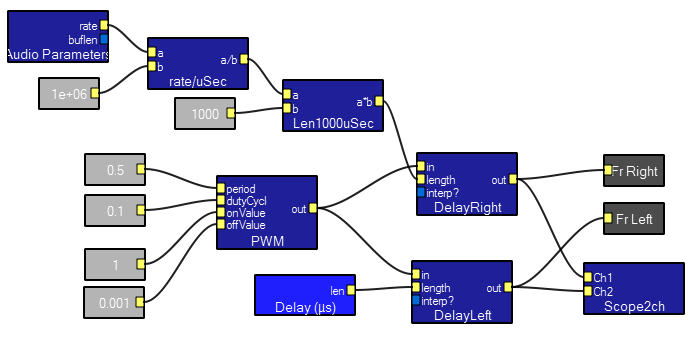
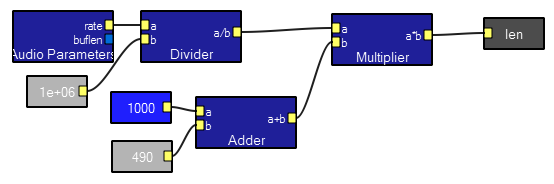
Contents of the Delay(uSec) macro above. The box highlighted in light blue is the delay interactor in the interactive view. This macro uses the system-supplied AudioParameters module to get the sampling rate of the audio signal, converts it to samples/microsecond, then multiplies by the desired delay (set interactively) to output the number of samples to delay.
Beat frequencies and cancellation at 180 degree phase shift.
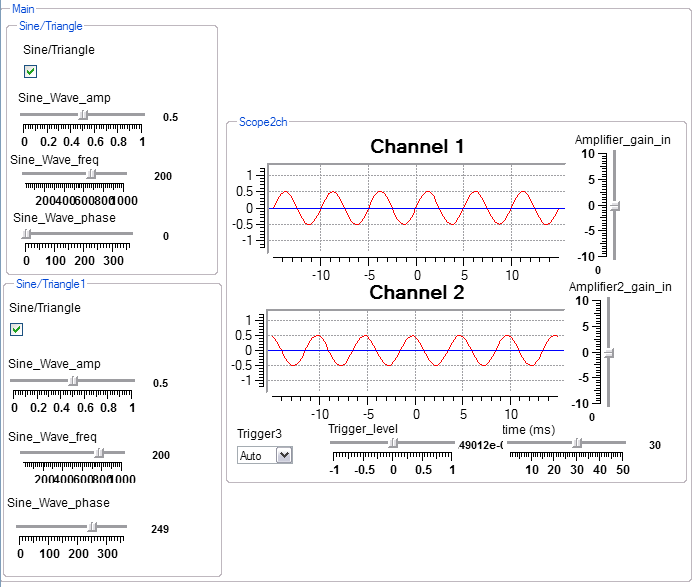
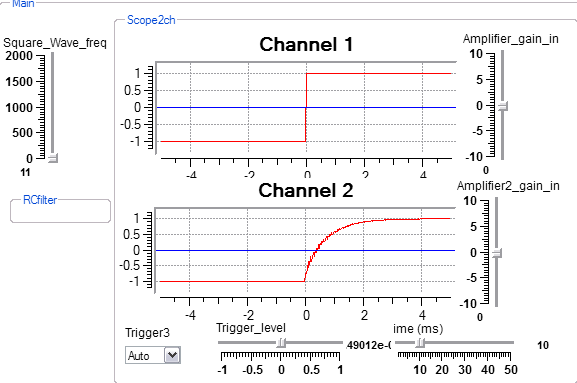
A pair of sine waves of the same frequency and amplitude, played through separate speakers, will appear to cancel if they are 180 degrees out of phase. If the frequencies are slightly different, a person will perceive beat frequencies. The following program allows the user to adjust frequency, amplitude, and phase of two sine waves to investigate cancellation and beats. The program is constructed from two macros; the Scope2ch macro described in the introduction and a sine/triangle generator with built-in interactive controls.
Designer's view

Interactive view. Note that scope amplifier gains are in db.
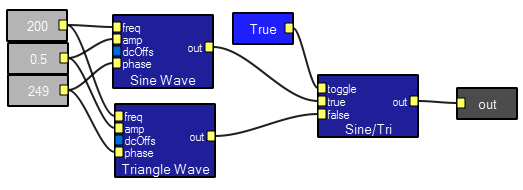
Contents of the Sine/Triangle macro shown above. The gray boxes are the interactive controls for frequency, amplitude and phase. The light blue box is the sine/triangle selector interactor. This macro encapsulates frequency, amplitude, and phase controls for an basic signal generator.
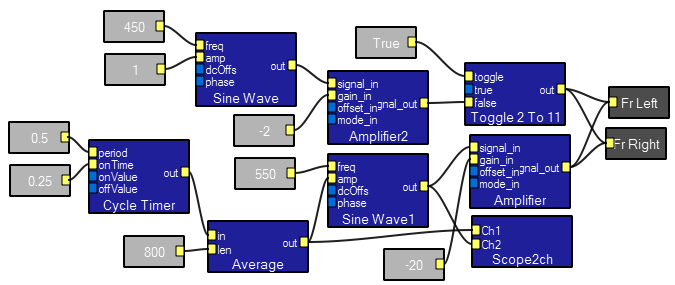
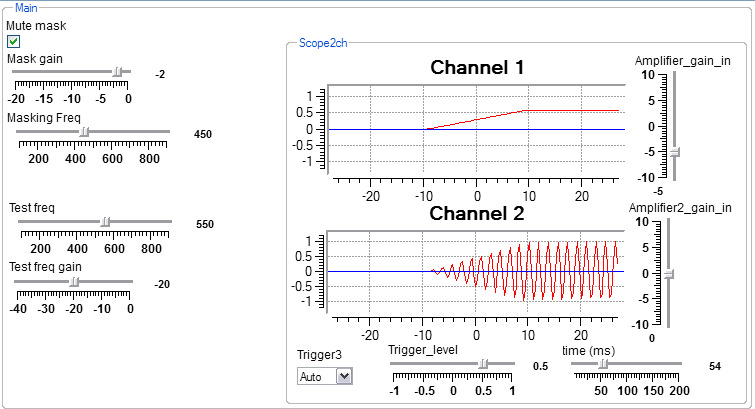
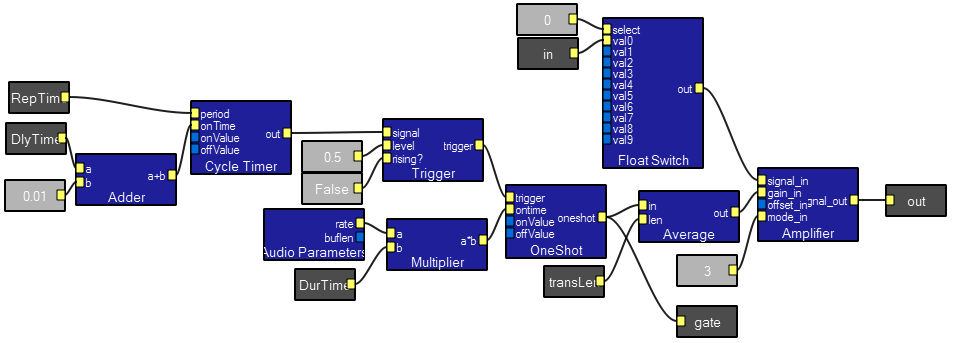
Masking a sine wave with another sine wave .
This program compares the perception of a pulsed sine wave with and without a continuous masking tone. The average module converts the square wave input from the cycle timer into a trapzoid wave. This reduces switching transients when gating the sine wave on/off. The scope in the interactive view shows the turn-on ramp.
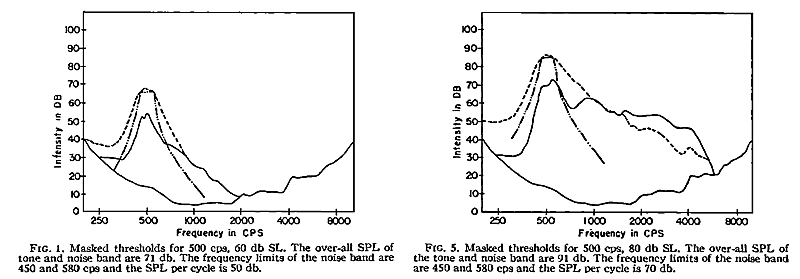
To use the program, set the masking frequency, unmute it and turn up your speakers until the masking tone is fairly loud. Mute the masking tone and set the test frequency to a value just above the masking frequency.Note that the test tone beeps. Unmute the masking tone and adjust the test gain until you can just hear the test tone. Ehmer (1959) suggests that masking is fairly symmetric in frequency if the intensity of the masking tone is low, but assymetric in frequency at high intensities. Two figures from Ehmer's paper are shown below. The left plot is at low intensity masking, the right at high intensity. You can see that at higher intensity the masking region extends farther to higher frequency than to low frequency.
This example is similar to Voroba (1978) Experiment VI-1 Tone-on-Tone masking, page 112.
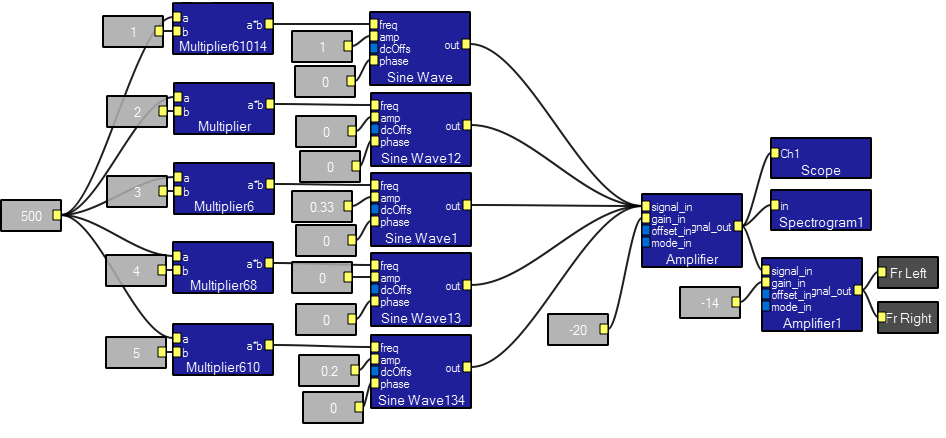
Fourier synthesis of waveforms.
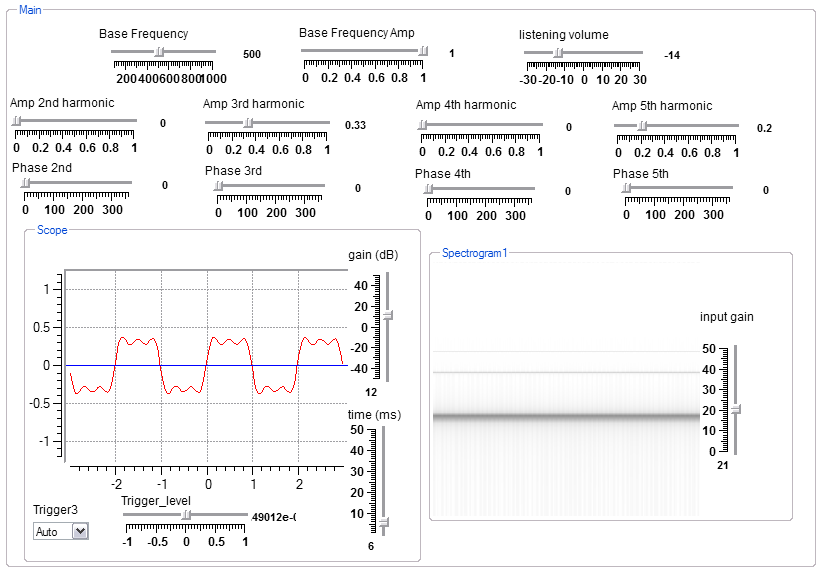
This program uses a series of controls allowing the fundamental through fifth harmonic of a sine wave to be added to synthesize an approximation of an arbitrary waveform. The table below shows the amplitude and phase settings for a few common waveforms.
| harmonics | square amp/phase |
triangle amp/phase |
sawtooth (right)
amp/phase |
sawtooth (left)
|
| 1 | 1.0/0 |
1.0/0 |
1.0/0 |
1.0/0 |
| 2 | 0/0 |
0/0 |
0.5/180 |
0.5/0 |
| 3 | 0.33/0 |
0.11/180 |
0.33/0 |
0.33/0 |
| 4 | 0/0 |
0/0 |
0.25/180 |
0.25/0 |
| 5 | 0.2/0 |
0.04/0 |
0.2/0 |
0.2/0 |
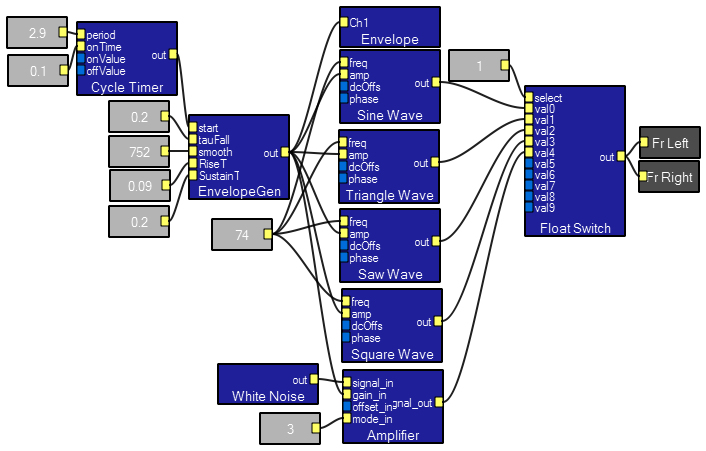
Designer's view. Note that multiple inputs to a single module connector are added. An example of this is seen at the amplifier near the right of the diagram where all five harmonics are added. The multipliers form the harmonic frequencies.
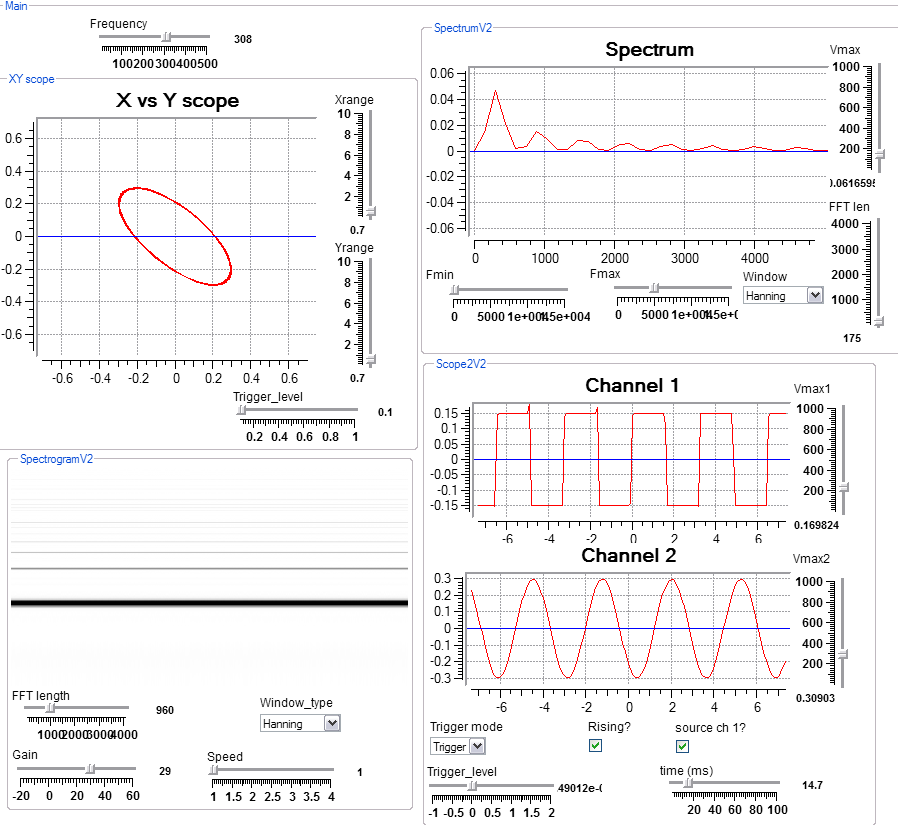
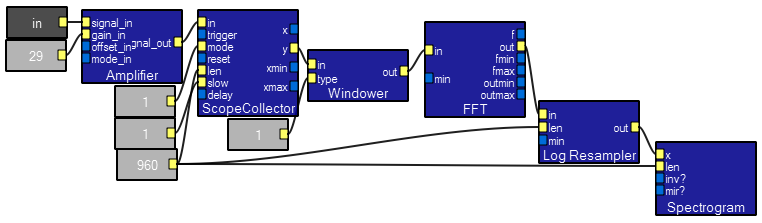
Interactive view. The frequency axis of the sectrogram is logarithmic. The controls are set to approximate a square wave.
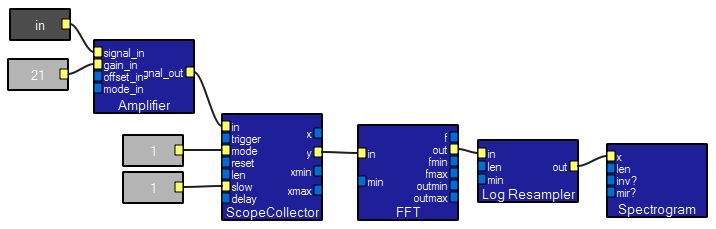
Contents of the Spectrogram macro.
A simple sequencer built from delay modules.
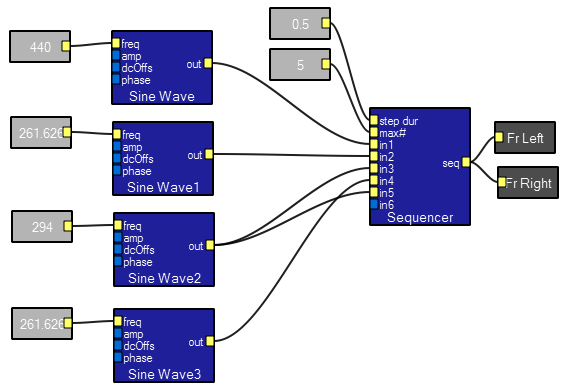
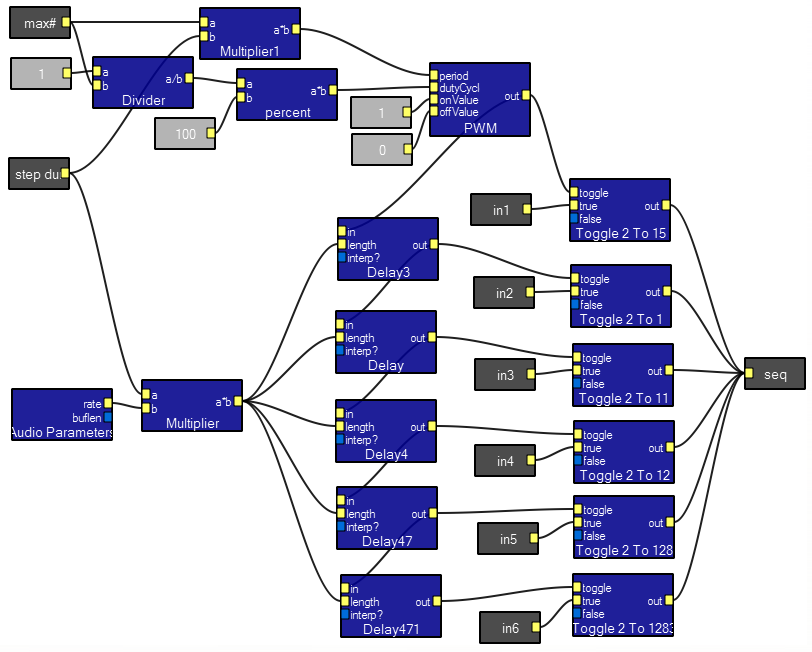
This program builds a sequencer which allows the designer to step through a sequence of different audio sources, each for a fixed time interval. Such a device could be used to play a scale or patch together speech sounds. In this demo, it is used to play four different frequency sine waves. There is no interactive view for this program because it is a demo of the Sequencer macro. The first input of the macro sets the time step duration in seconds. The second input sets the maximum number of steps to play. In this example, input 6 is skipped. A WAV file demonstrates three cycles of the sequencer.
Designer's view
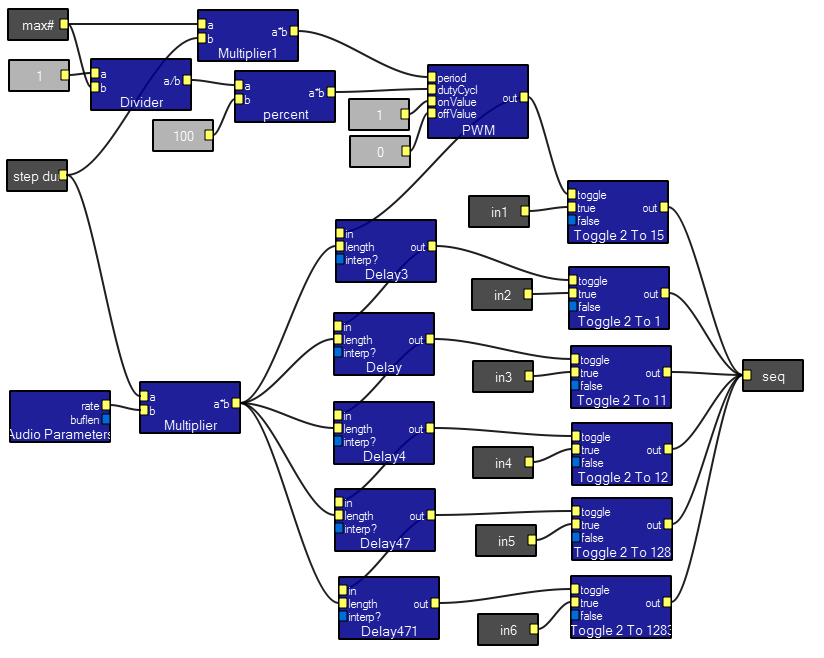
Contents of the Sequencer macro. The sequencer is implemented by a delay line. The PWM module sets the repeat time of the sequence.
Filtering and effects.
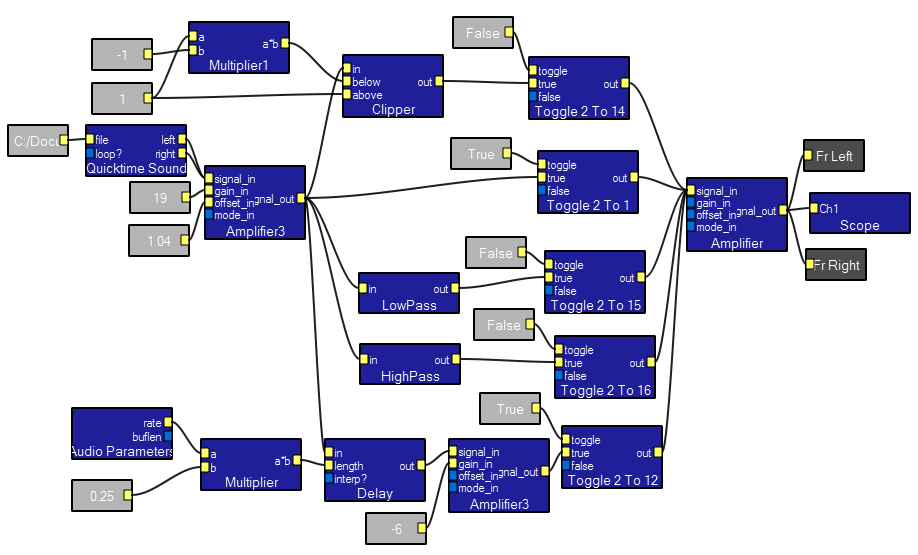
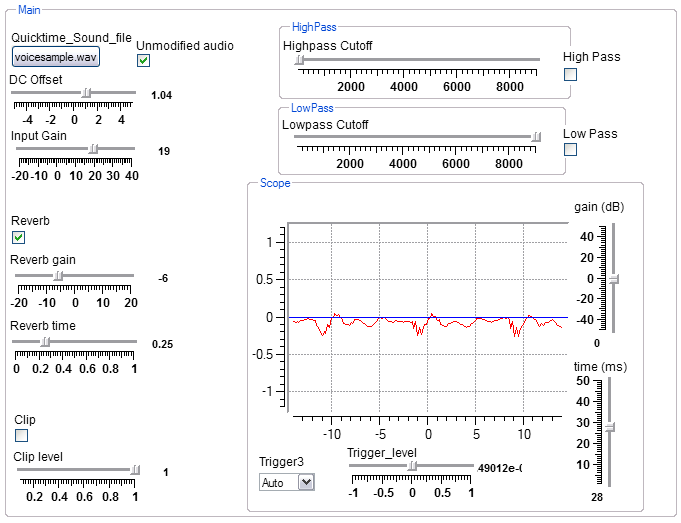
This program demonstrates some of the filtering which is possible in Koé. You can interactively choose an audio file for input (example file), then apply clipping, reverb, high pass and low pass filters. Input comes from the Quicktime sound module. On a Windows XP machine, you may need a free download of Quicktime from Apple before using this module. There are controls for the gain and offset of the input, clipping level, reverb time and amplitude and low and high pass cutoffs. The contents of the low pass macro is shown below.
Data windowing and FFT length .
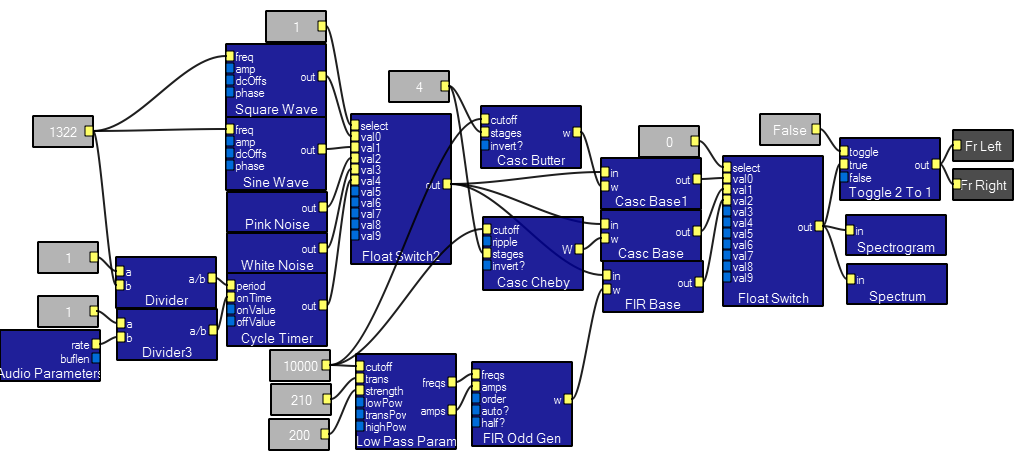
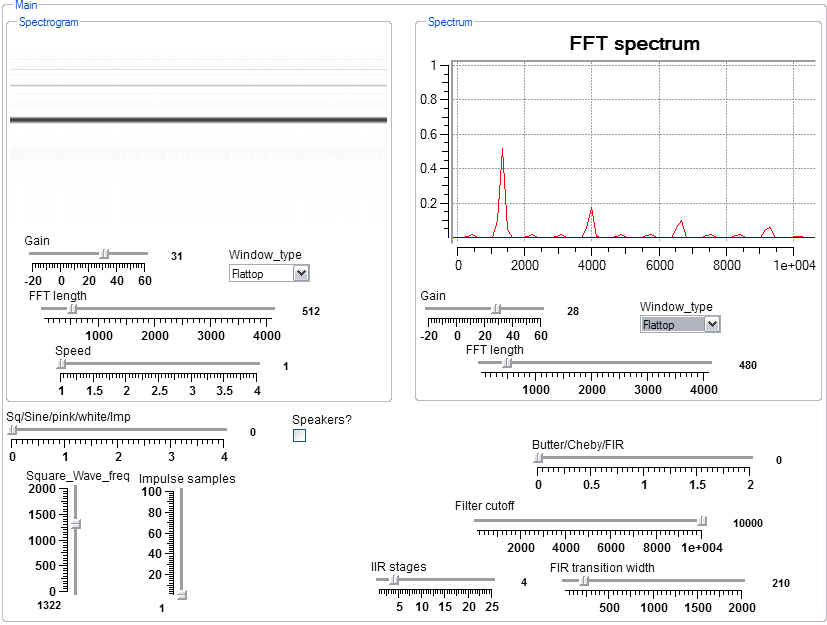
This program demonstrates the effects on the measured spectrum of a singnal, depending on the type of window applied to the data and the number of points used to compute the FFT. There are five signal sources: square wave, sine wave, pin and white noise and a periodic impulse. Some filtering is included to play with, but is not the main thrust of the program. Interactive controls allow the user to choose the length of the FFT used for determining the spectrum or spectrogram, and to set the window type. Fewer points means less frequency resolution, but more time resolution. You can see by watching the spectrogram that the rectangular window is terrible in almost every case. A Hanning window appears to give narrower spectral lines, but the Flattop gives a better spectral power estimate because it smoothes across spectral samples a little. The rectangular window causes lots of artifacts in the spectrum window as you vary the frequency of the source, while the Flattop performs the best.
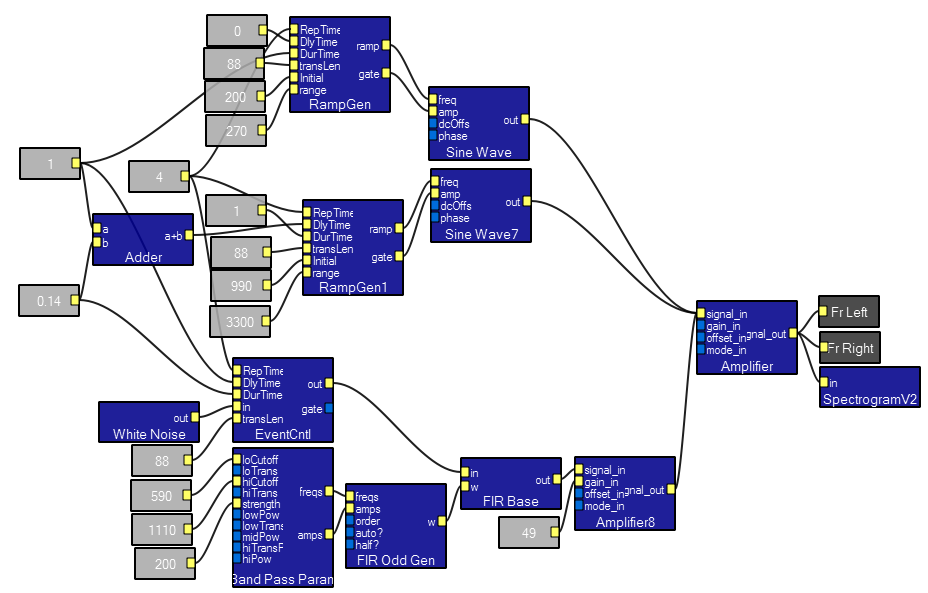
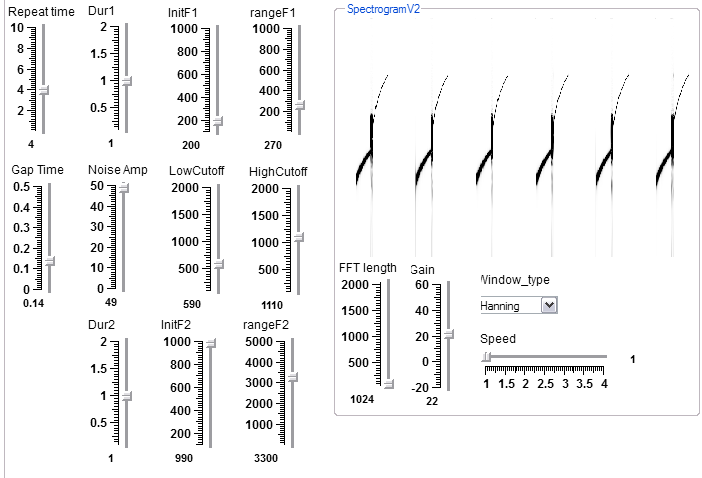
Cricket Call generator.
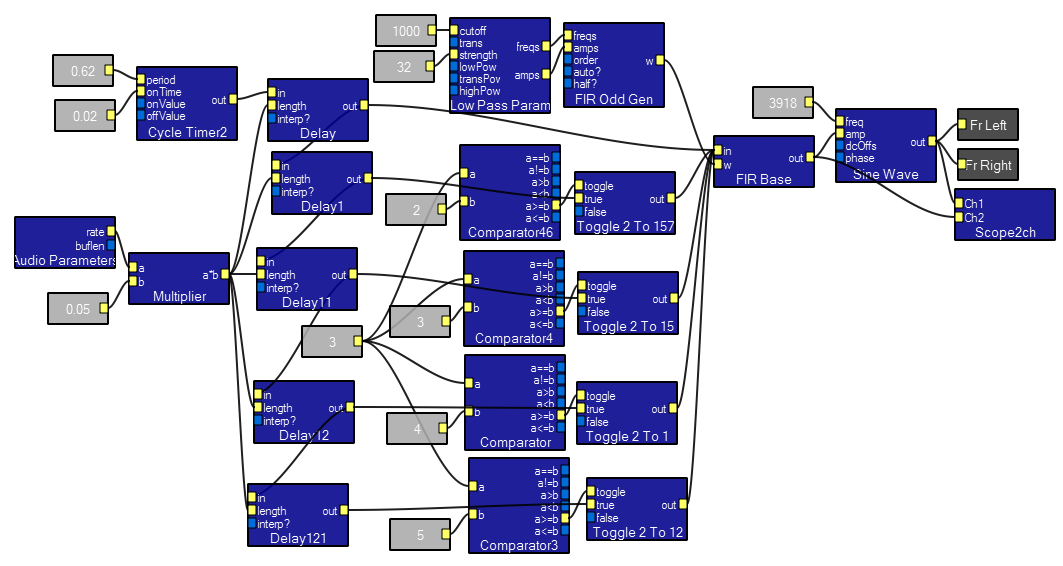
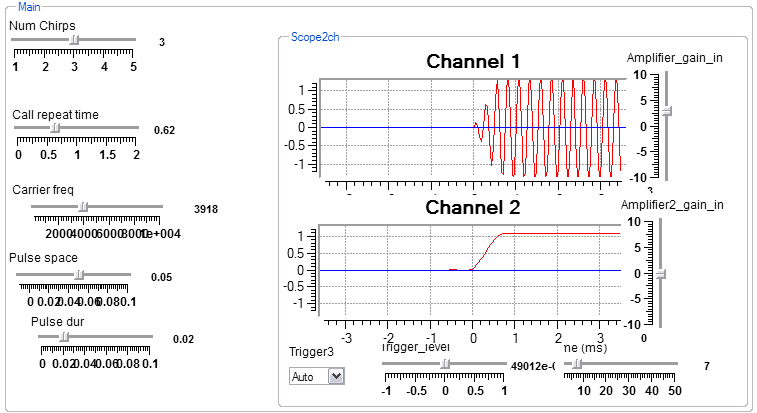
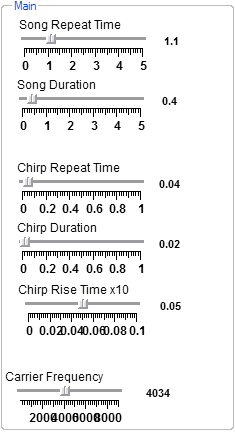
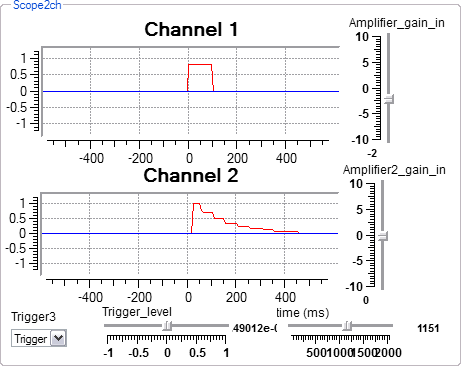
This program is a prototype cricket call generator. In the interactive view, the user can set the number of chirps, call repeat time, carrier frequency, chirp spacing and chirp duration. In the design view, note that the final sine wave module is amplitude modulated by an FIR filter. The FIR filter serves to shape the chirp envelope with a 1 mSec rise time to minimize fast transient artifacts. In the interactive view, you can see a chirp onset on channel 1 and the envelope on channel 2. Changing the FIR cutoff frequency from 1000 to 10,000 causes the chirp to become harsh sounding. An example reduces the number of chirps from 5 to 1 and back to 5.
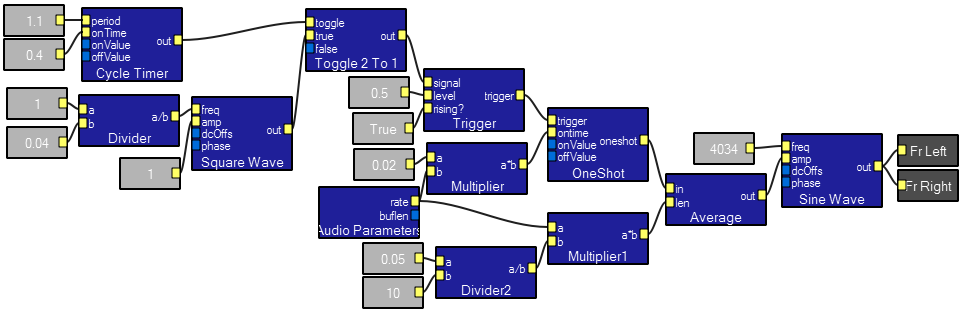
Improved Cricket Call generator.
This program uses a better sequencing system to build a flexible cricket call. The cycletimer is used to generate a burst to square waves. Each rising edge of the square wave triggers a oneshot which sets the chirp duration.
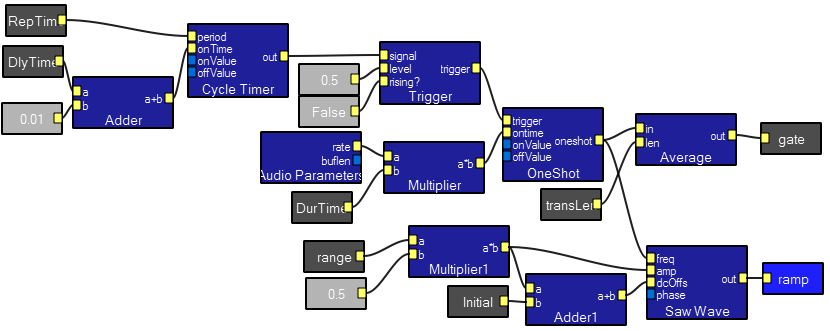
Timer controlled FM.
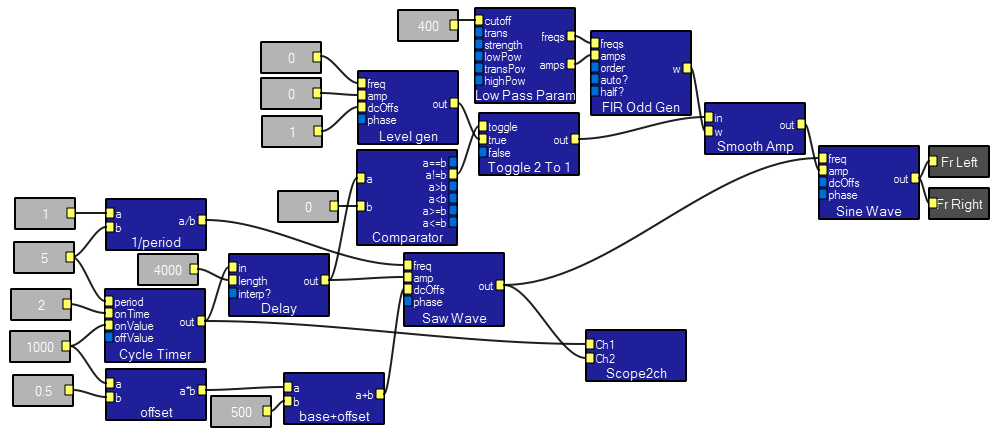
This program shows how to generate a linear FM sweep. The output for the parameters shown is a sweep from 500 to 1500 Hz. There is a small artifact at the end of the sweep which needs to be fixed. The basic idea is that a sawtooth generator is phase-locked (by the 1/period module below) to a cycle timer to produce a ramp. The cycle timer onValue (1000 below) sets the frequency sweep range. This range is used as an offset so that the sweep starts at zero frequency, then added a base frequency value (500 below). The base+offset is applied to the dcOffs input of the sawwave module. The output of the cycle timers is delayed so that serveral of these sweep generators could produce a complex set of sounds. The output of the delay sets the amplitude of the sawwave module which then feeds the freq input fo the sinewave module. The amplitude of the output sine wave is gated by a slightly low-passed pulse generated by the toggle2to1 module. The comparator module allows the sweep range (output of delay) to be either a positive or negative number.
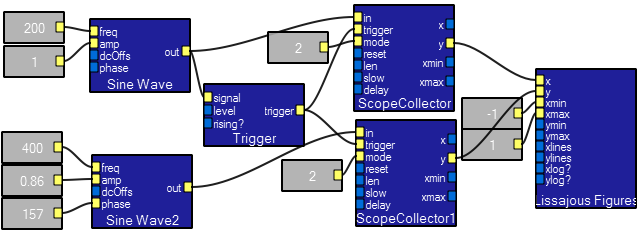
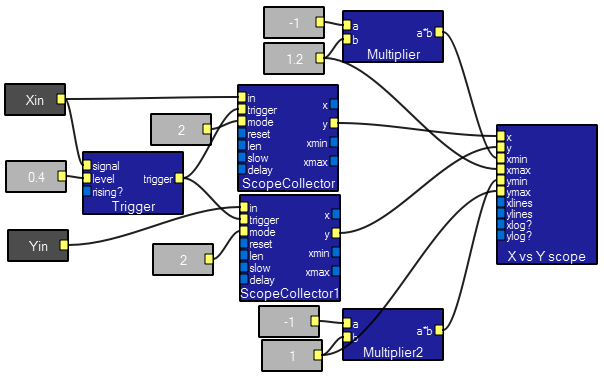
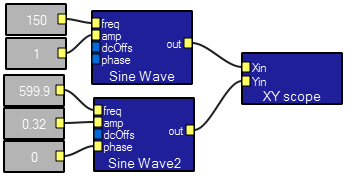
Drawing Lissajous patterns.
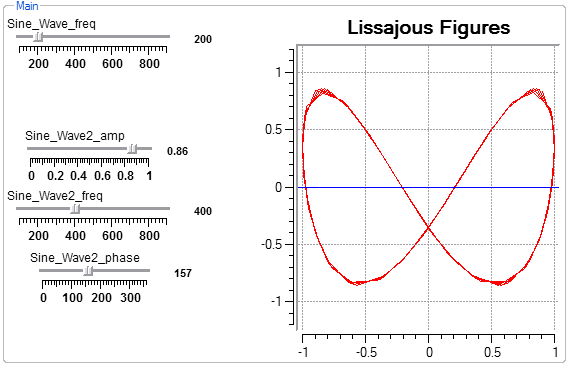
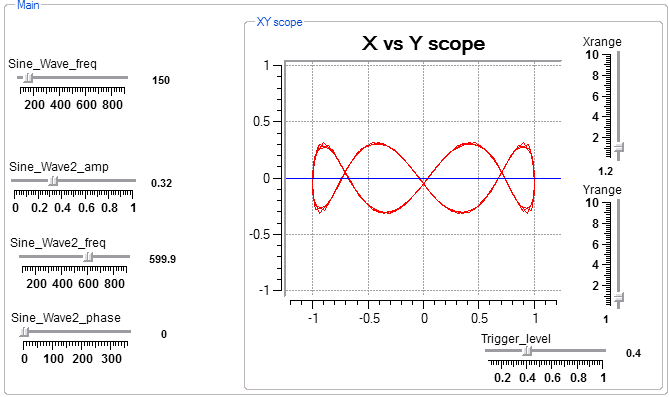
This program shows how to plot one waveform against another by using two scope collectors. The application show generates Lissajous patterns formed by plotting two sine waves of different frequency, amplitude or phase. The interactive view below shows two sine waves with a 2:1 frequency ratio, and 157 degrees out of phase. Try:
| frequency 1 | frequency 2 | phase 2 |
| 150 | 150.1 | 0 |
| 150 | 300 | vary control |
| 150 | 300.1 | 0 |
| 150 | 589.5 | 0 |
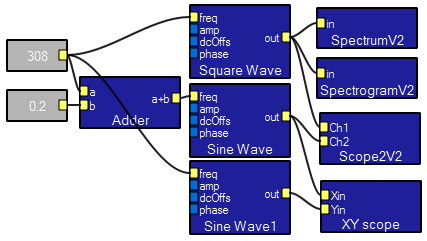
Design view:
Interactive view.
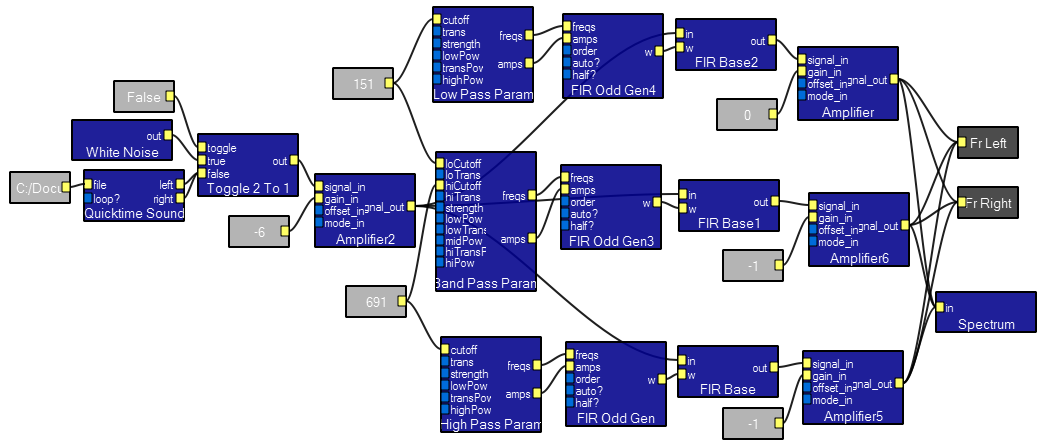
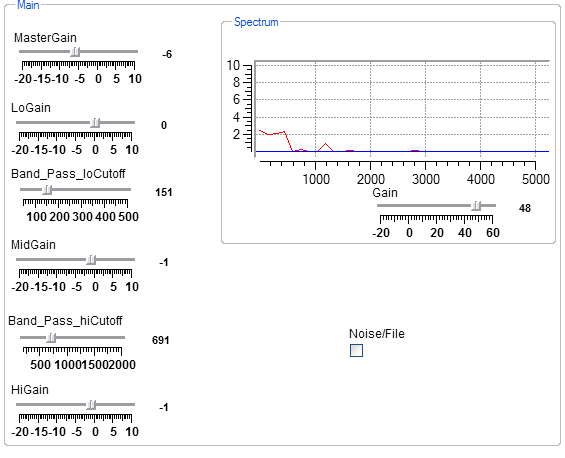
Three Band Equalizer .
This program shows how to make an equalizer with settable bands and gains. An example file (John Hurt from publicdomain4u.com) is an old recording which lacks high frequencies and bass. Adjusting the controls in the interactive view changes the sound of the recording considerably. The File/Noise toggle allows you to visualize the actual frequency response by using broadband noise.
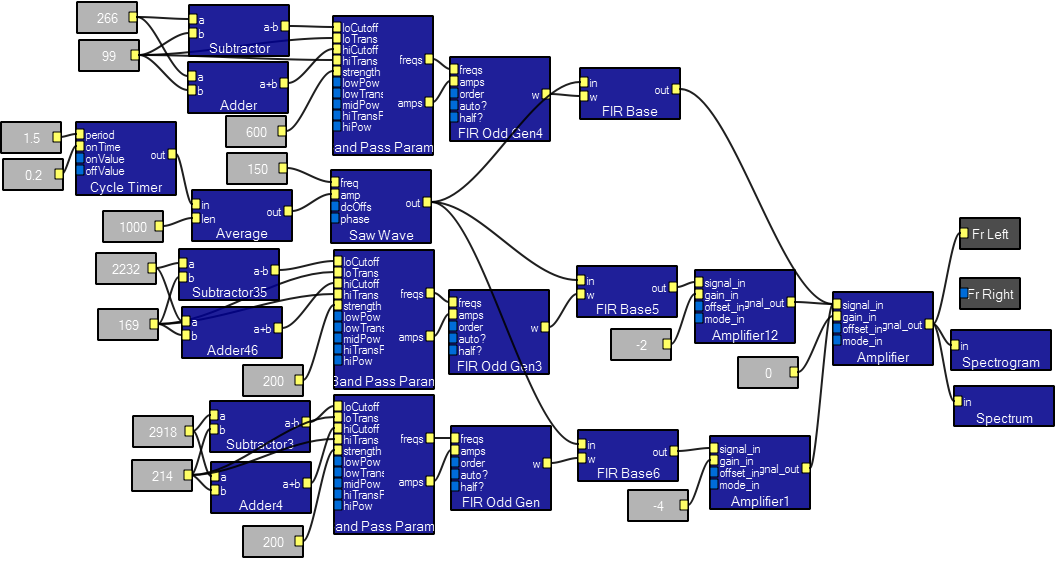
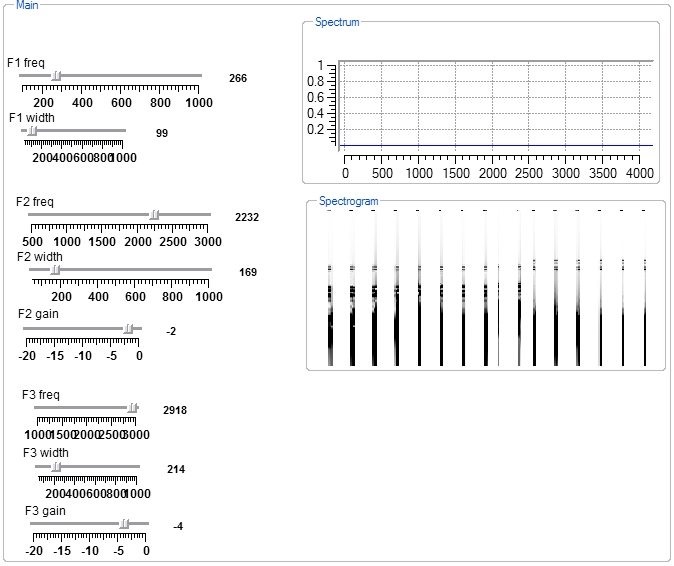
Vowel Formant Generator .
This program generates vowel sounds based on three formants. The center frequencies are given below in a table compiled from the Spectral Cues page. Generally the widths of the formants increase with frequency and the amplitudes decrease. The interactive view shown generates an 'e' as in beet. You can set the fundamental frequency by modifiying the frequency contant attached to the sawwave generator. A sawwave approximates the waveform generated by the vocal cords.
| vowel | F1 freq | F2 freq | F3 freq |
| 'a' as in father | 710 | 1150 | 2500 |
| 'a' as in bat | 690 | 1660 | 2500 |
| 'e' as in beet | 280 | 2250 | 2900 |
| 'e' as in bet | 550 | 1770 | 2490 |
| 'i' as in bit | 400 | 1900 | 2550 |
| 'o' as in book | 450 | 1030 | 2380 |
| 'o' as in boot | 310 | 870 | 2250 |
Design view
Interactive view
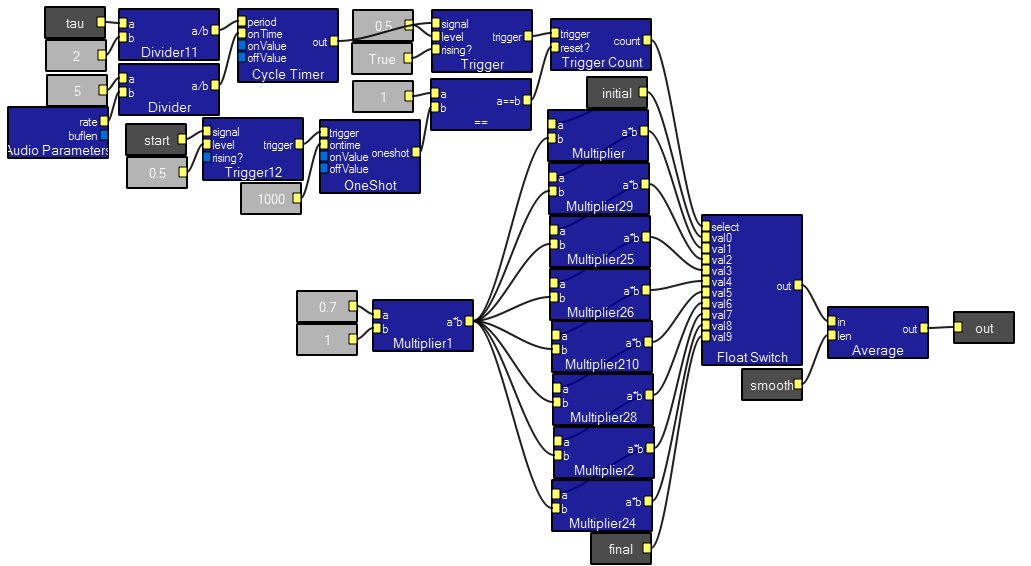
Coqui Frog Call Generator .
This program generates a frog call similar to that described in Narins and Capranica,
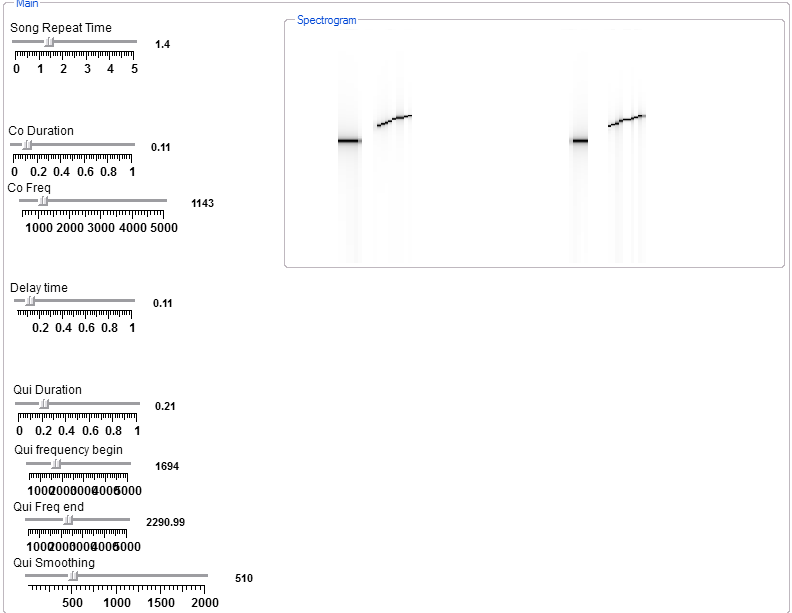
Sexual Differences in the Auditory System of the Tree Frog Eleutherodactylus coqui , Vol. 192, No. 4237 (Apr., 1976), pp. 378-380. There is a constant tone, followed by a short silence, then a linear frequency sweep. You can see the frequency content in the spectrogram below. The linear sweep is generated by adding a frequency increment serveral times, then switching between them . The output of the switch is smoothed using the average module. By modifying the increments added to the base frequency, any function of time can be made.
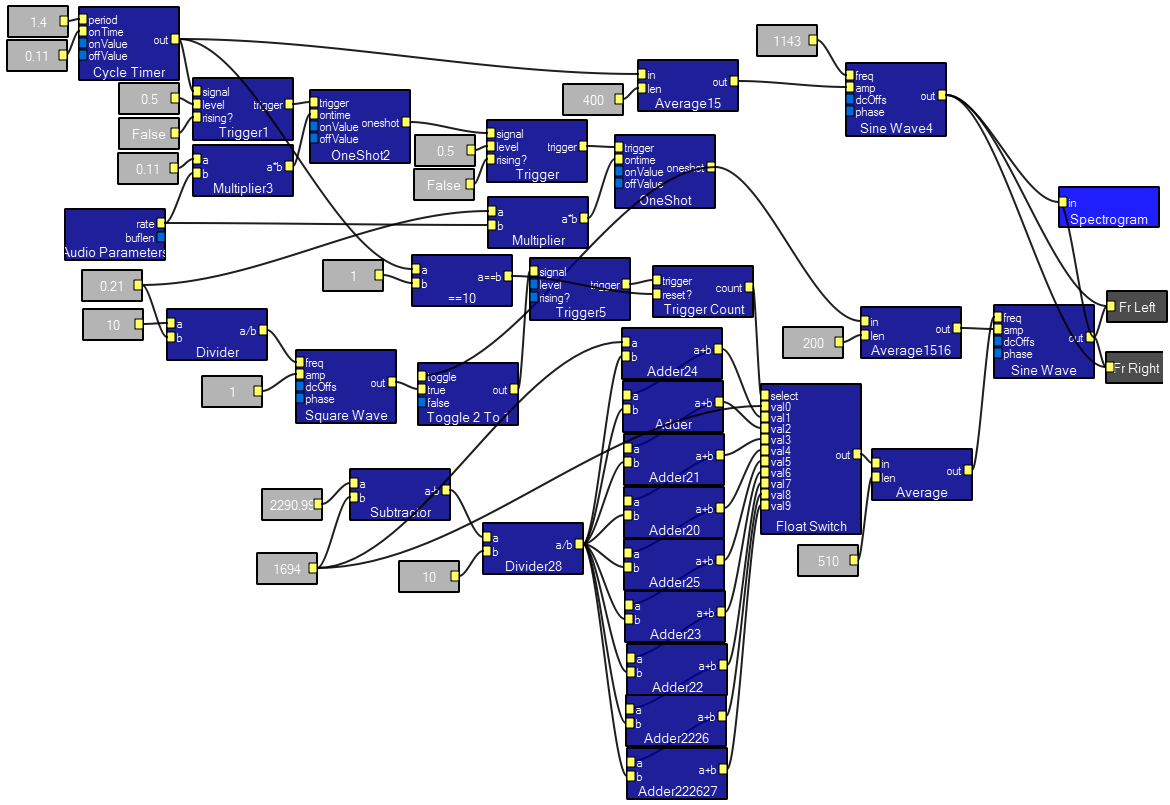
Chickadee Bird song Generator .
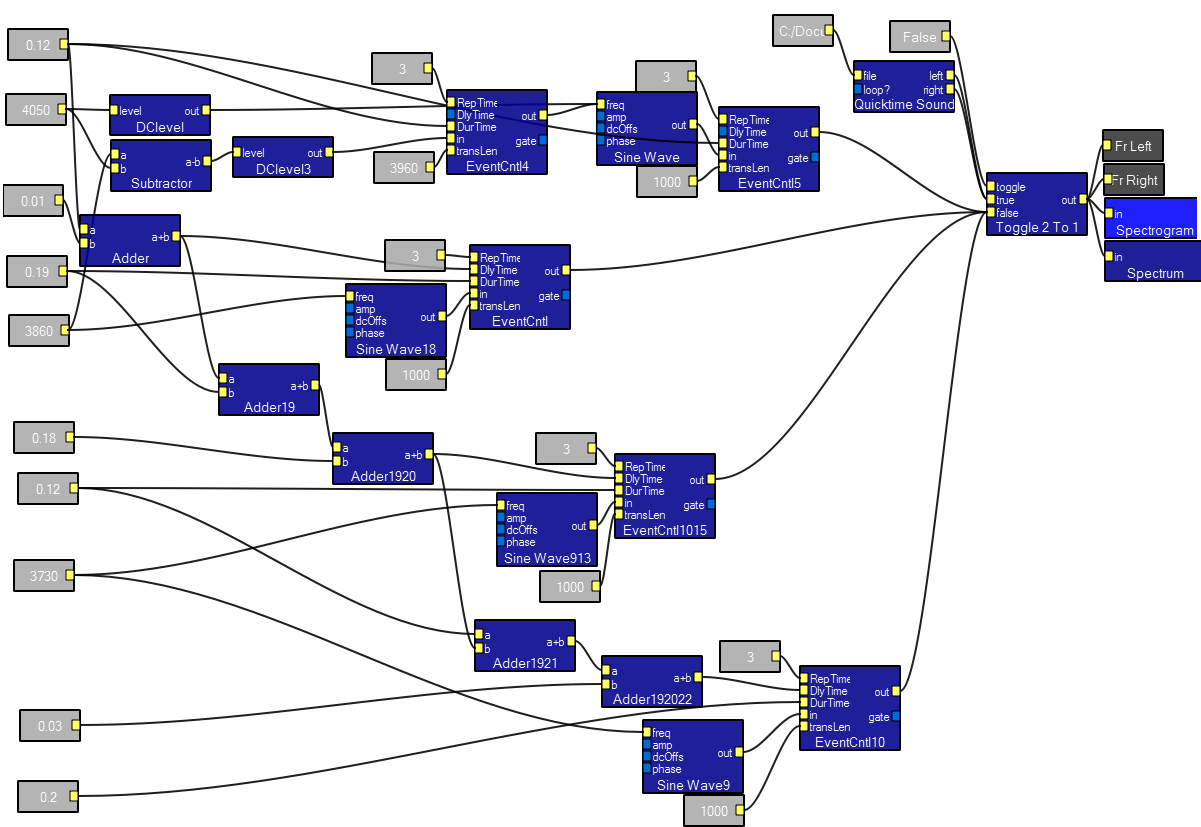
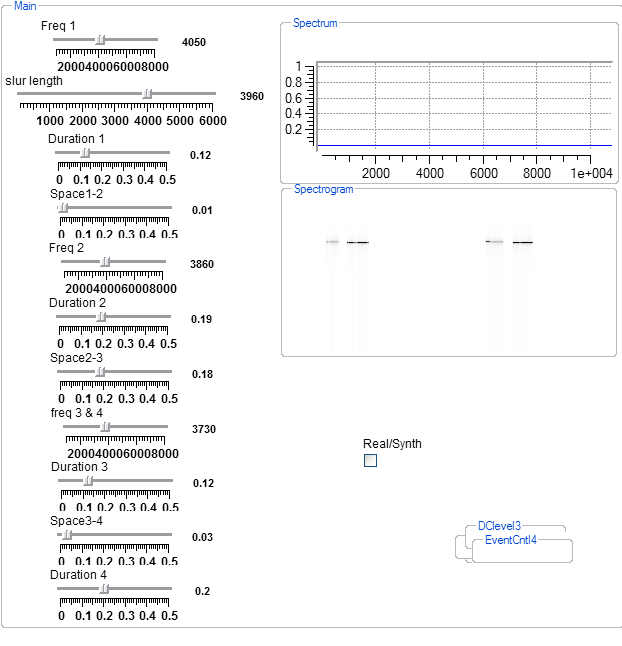
This program generates an approximate chickadee call. The real call can be compared to the synthesized call. There are four short pieces to the call, each controlled by an EventCntl module. The first event sweeps a frequency with an interactive slur rate. The two DClevel modules, subtractor and eventcntl modules generate the variable frequency during the first event. The adder chain down the left part of the program adds up all the times to make it easier to set various delays and durations. The quicktime input module can be set up to play the actual song when the interactive toggle is TRUE.
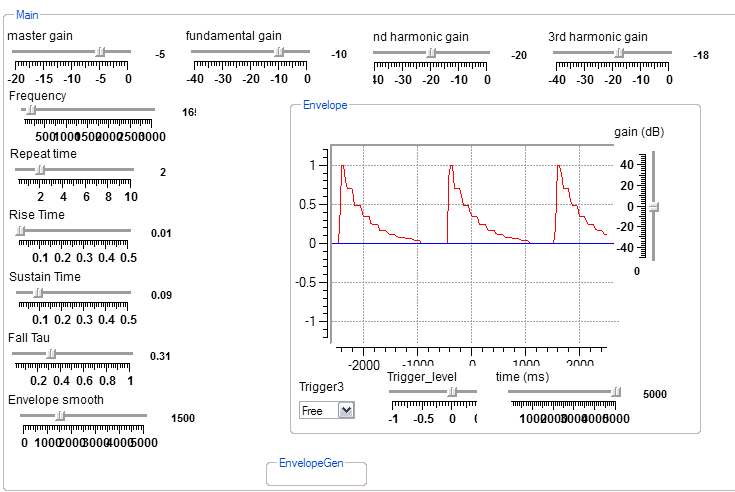
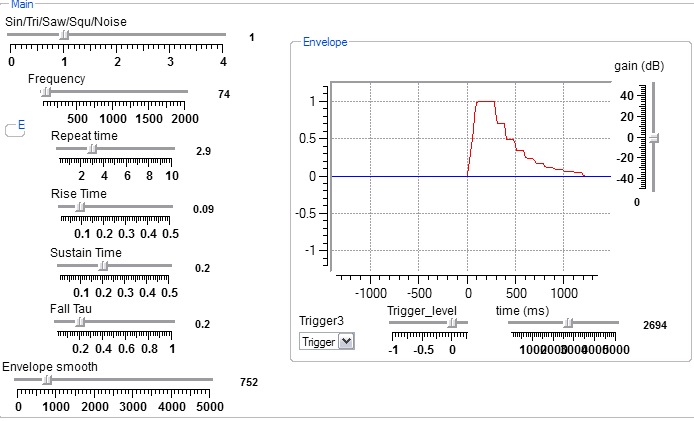
Timber and envelope .
This program generates three harmonics which are fed through an envelope generator to produce a timber like a plucked or bowed string. A plucked string is simulated by a fast rise time, short sustain and long fall time modulating a triangle wave. A bowed string is simulated by a slow rise time, short sustain and long fall time. You can make different sounding instruments by combining rise/fall times with harmonic content.
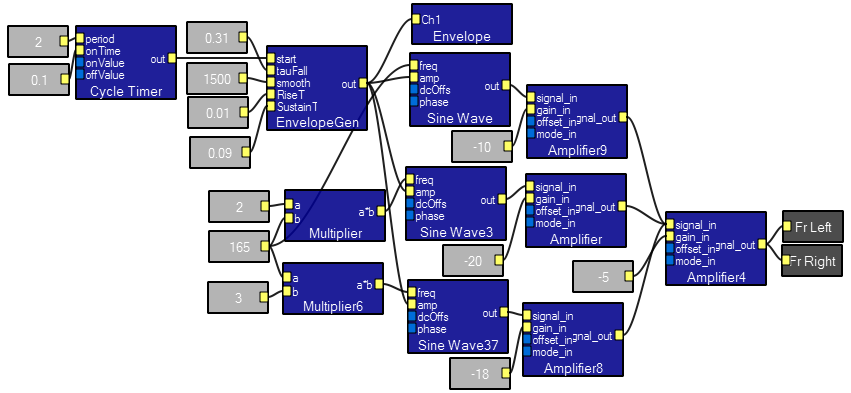 The following shows three envelopes.
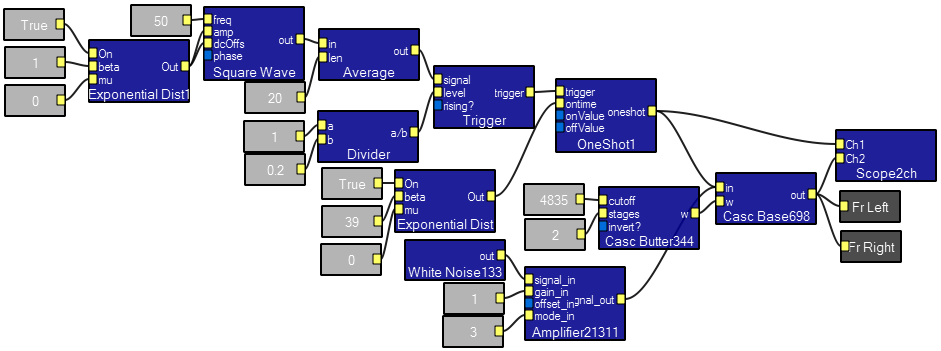
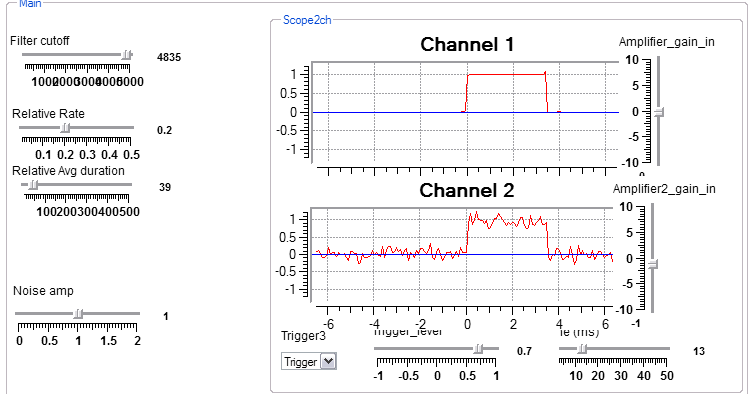
Ion channel simulator .
This program simulates the behavior of a single ionic channel which operates according to a simple isomerization from closed-to-open or open-to-closed. Exponential random number generators are used to obtain the interval until the channel should open/close. The top trace of the scope shows the noise-free, unfiltered channel opening, the bottom trace has noise and filter applied.
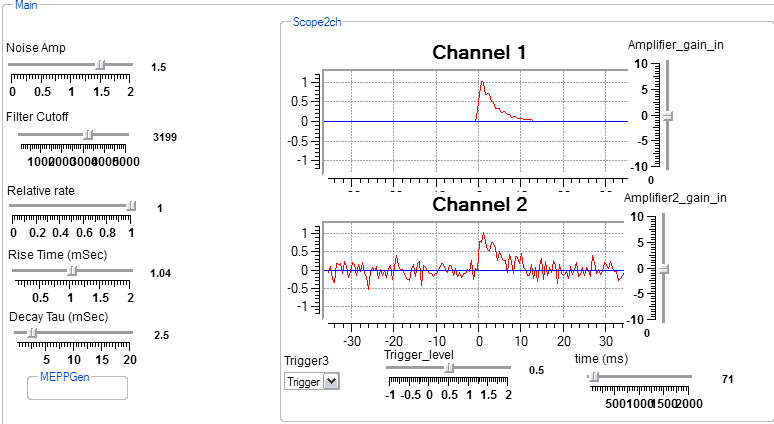
Miniature endplate potential simulator .
This program simulates miniature endplate potentials with Poisson arrival times. The white noise module plus filter is used to set the start point of the MEPP.
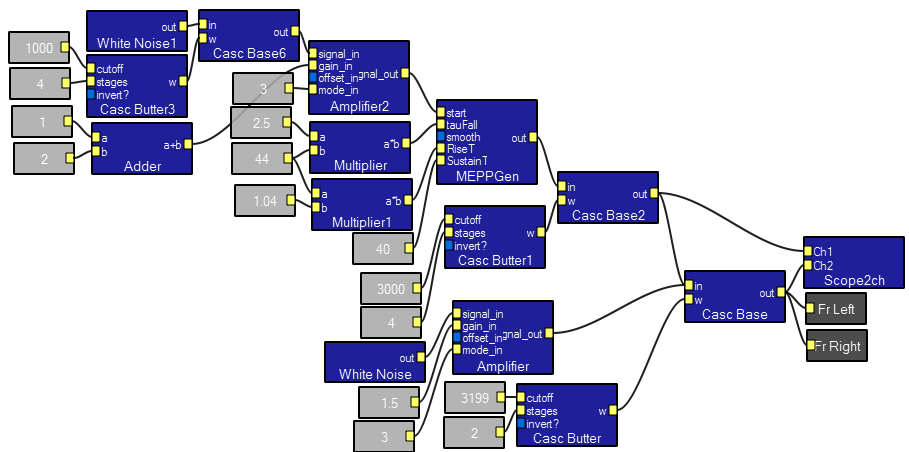
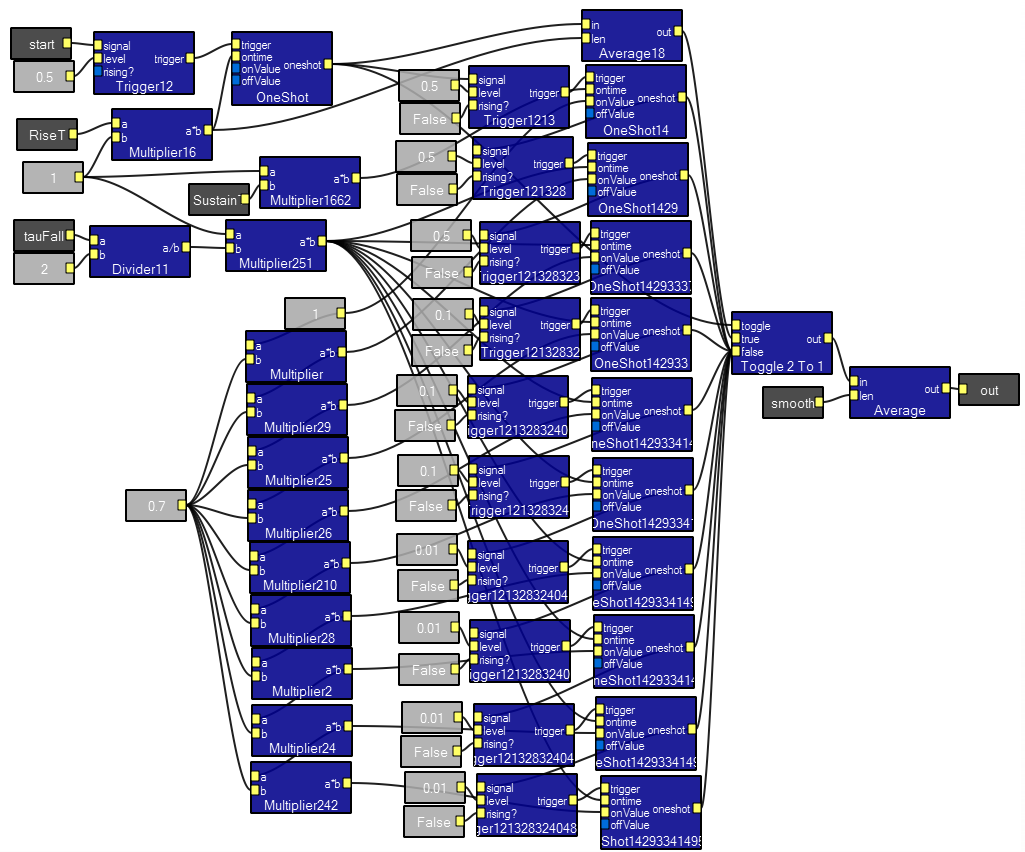
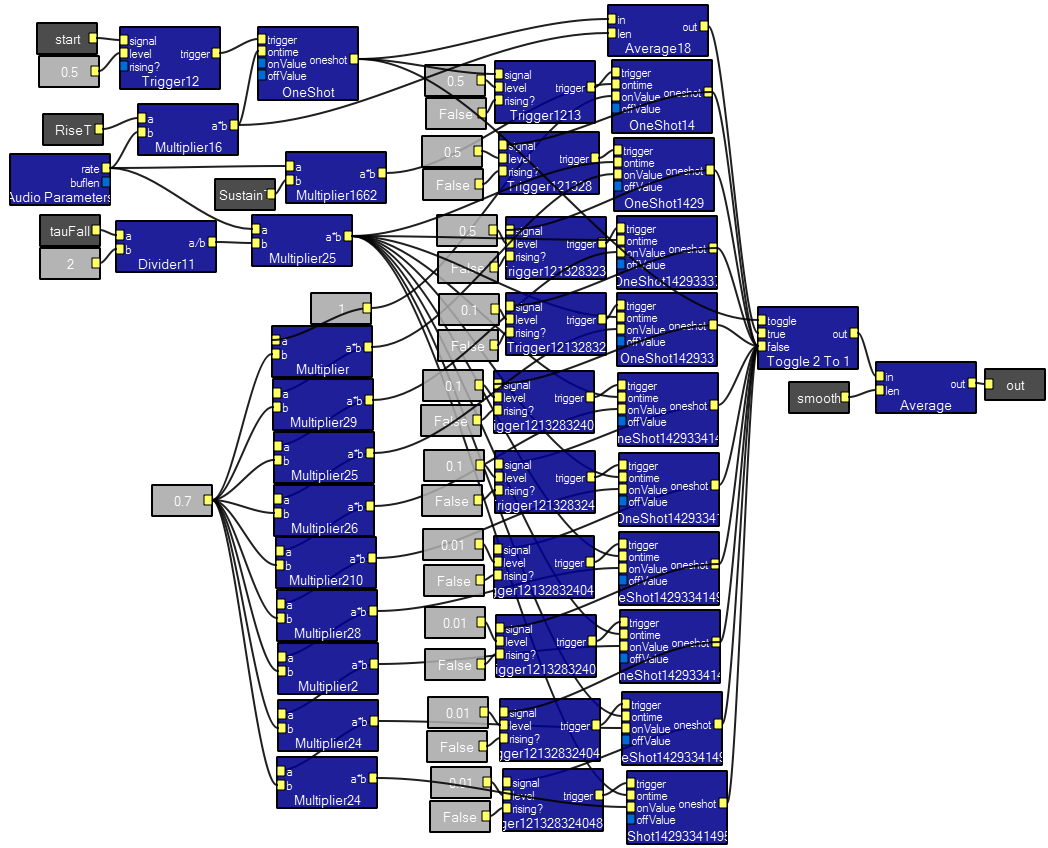
The huge MEPPgen macro. This is a slightly speciallized version of the envelope generator described in the macro section.
Action potential simulator.
These programs simulate extra cellular recording of one action potential to show how the controls work, then two and three APs to simulate multiunit extracellular recording. Only the single AP version will be shown below.
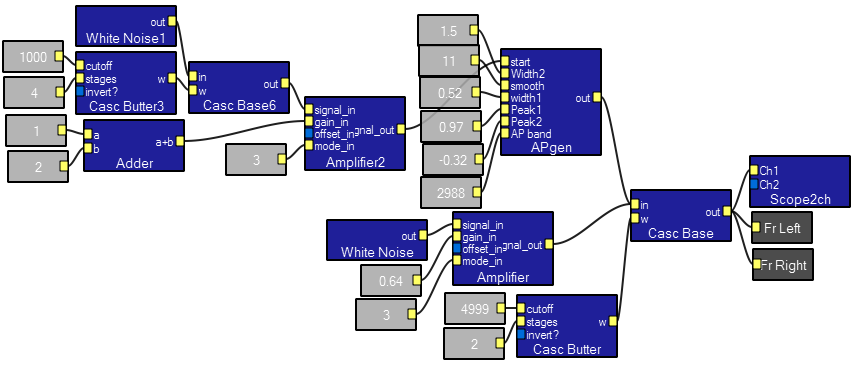
APgen macro contents:
AM modulation/demodulation
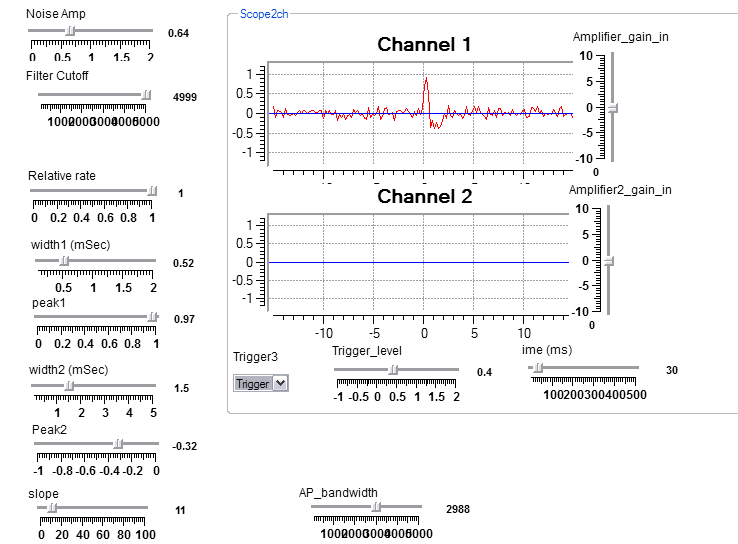
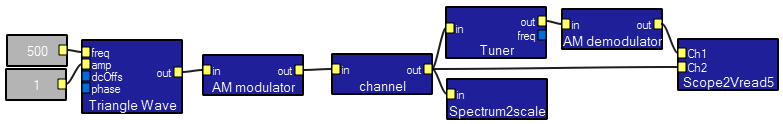
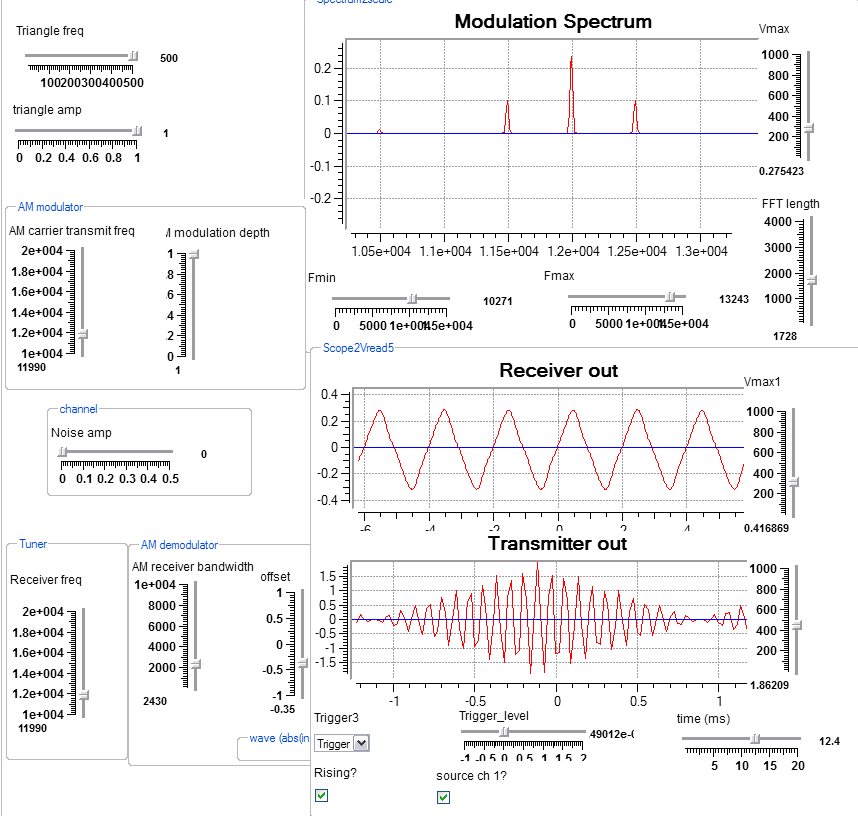
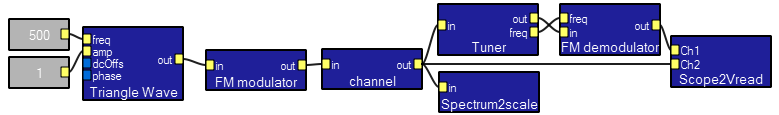
This program takes a low frequency signal, amplitude modulates a high frequency sine wave, send the modulated signal through a noisy channel, then demodulates it back to the input signal. Most of the program is made up of macros which encapsulate the various functions. You can clearly see the 500 Hz sidebands on the 12,000 Hz carrier in the image below. Note that the two scope traces have different time scales.
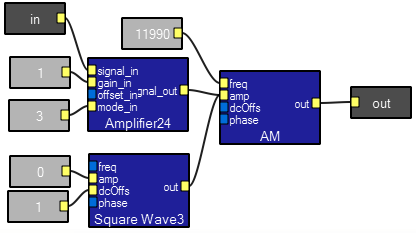
AM modulator
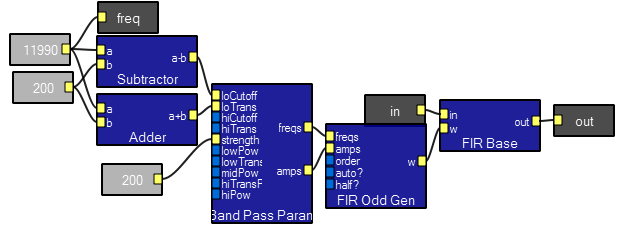
Tuner
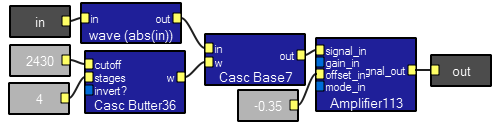
AM demodulator
FM modulation/demodulation
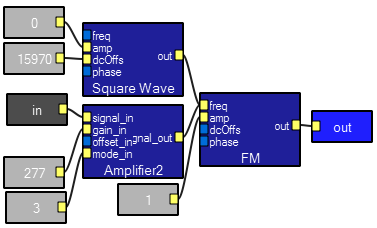
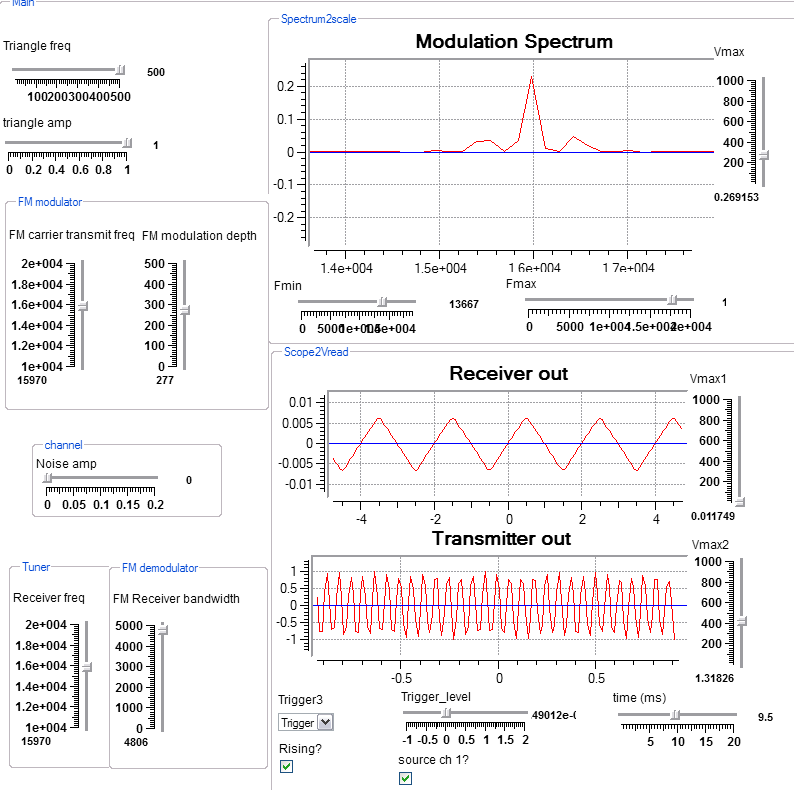
This program takes a low frequency signal, frequency modulates a high frequency sine wave, send the modulated signal through a noisy channel, then demodulates it back to the input signal. Most of the program is made up of macros which encapsulate the various functions. The tuner is the same as in the AM modulation program. Note that the two scope traces have different time scales. You can make the spectral display sharper by double-clicking on the Spectrum2scale macro and changing the FFT length to 1024.
FM modulator
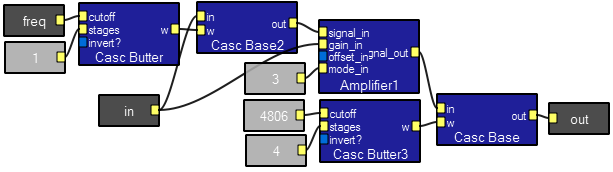
FM demodulator. This uses a filter tuned to the carrier frequency to produce a linear, frequency-dependent phase shift, which when multiplied by the original signal, makes a phase-dependent output.
Pulse-width modulation/demodulation
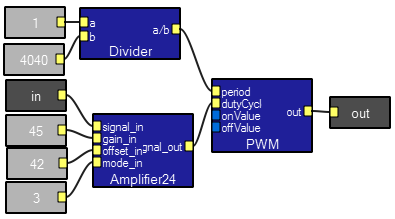
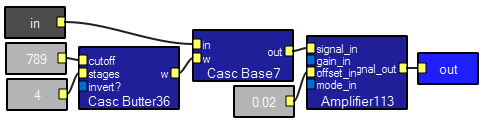
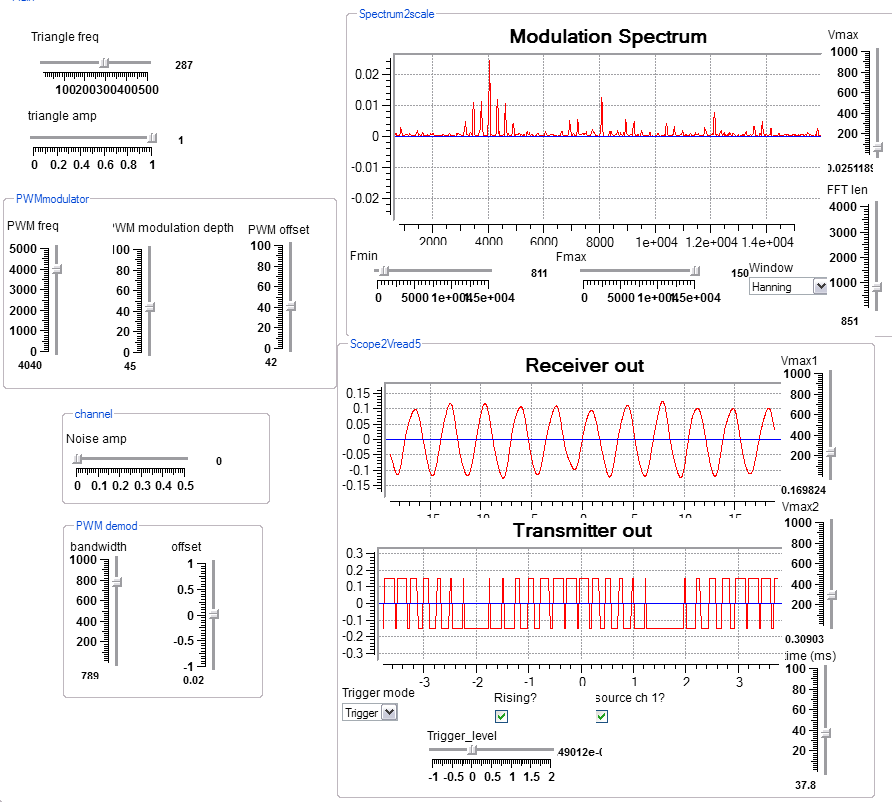
This program takes a low frequency signal, changes the duty cycle of a pulse train, sends the modulated signal through a noisy channel, then demodulates it back to the input signal. Most of the program is made up of macros which encapsulate the various functions. Note that the two scope traces have different time scales. Since this technique is a baseband scheme, the spectrum is spread across the band from DC to high frequency. It is often useful for converting an analog signal to a digital signal for transmission over a noisy or nonlinear channel.
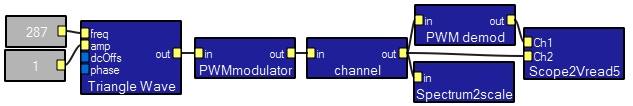
PWM modulator
PWM demodulator
Phase-lock loop (PLL)
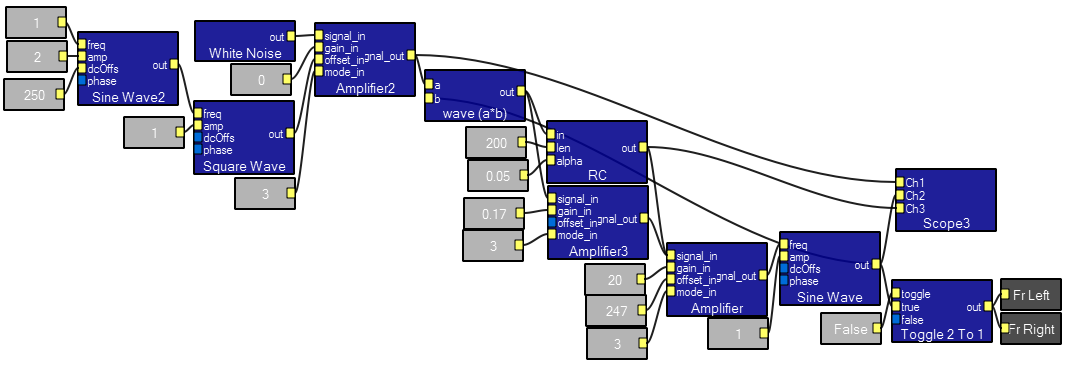
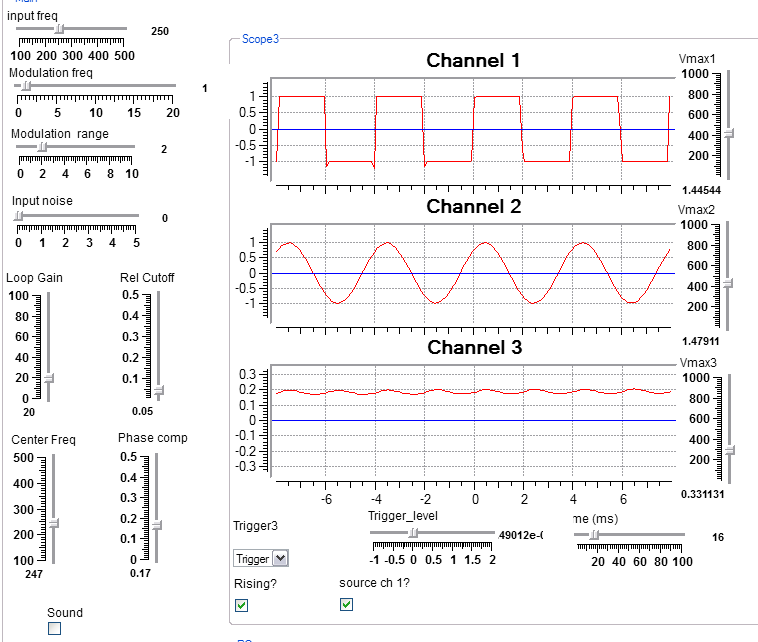
This program implements a feedback control circuit which automatically adjusts the output sine wave to have the same frequency as an input square wave, even in the presence of substantial noise. The dynamics of the PLL are determined by the loop gain (higher gain means higher accuracy, until it oscillates), filter cutoff (higher cutoff means better frequency following, but less stability), and phase compensation (higher comp means better stability, but slower response). Typically, the system will be critically damped if the phase compensation is around 0.15-0.20. A gain of 5 to 50 works best, with a cutoff of less than 0.1. The RC macro implements a simple RC lowpass filter. This simple filter was necessary to shape the phase shift at higher frequency. You may need to adjust the control center frequency to be close to the input frequency until the loop locks onto the input. After lock, you can vary the frequency more widely, depending on the gain. Note in the design view below that there is a connection running from the ouput of the rightmost sine generator back to the multiplier input b. This is the feedback path. The wave(a*b) module is a phase comparator, which is lowpassed by the RC module and feed into the frequency control of a sine wave generator. The amplifier below the RC module scales the phase output to be added back to the lowpassed signal. This improves the stability at high frequency by lowering the phase shift from 180 degrees to 90 degrees. For comparision, I implimented a first-order PLL which, by definition, has no lowpass filter.
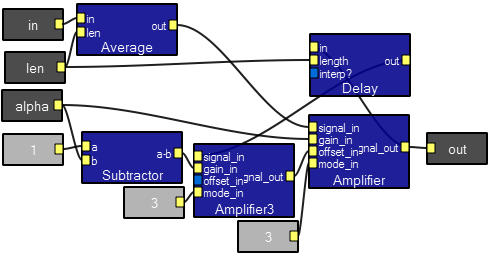
RC filter contents. Note the connectioin from the output to the delay, then back to the signal_in of the leftmost amplifier. The formula implimented is the simple Euler approximation of a 1-pole IIR filter:
outputt = alpha*input + (1-alpha)*(output(t-len))The
average module smooths the input between samples to minimize aliasing. Note that this macro behaves badly for many signals and should not be used for general filtering.
Quantized (2-bits/sample) waveform and first-derivitive (Diffferential Pulse Code Modulation) DPCM
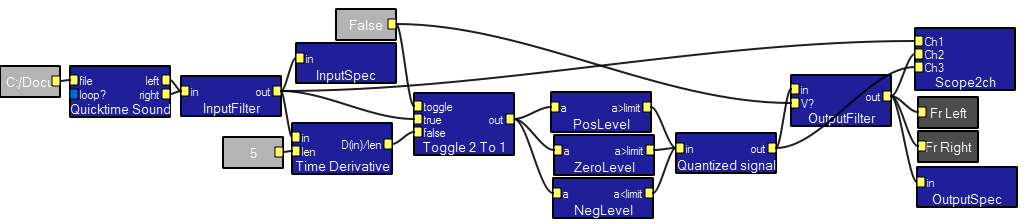
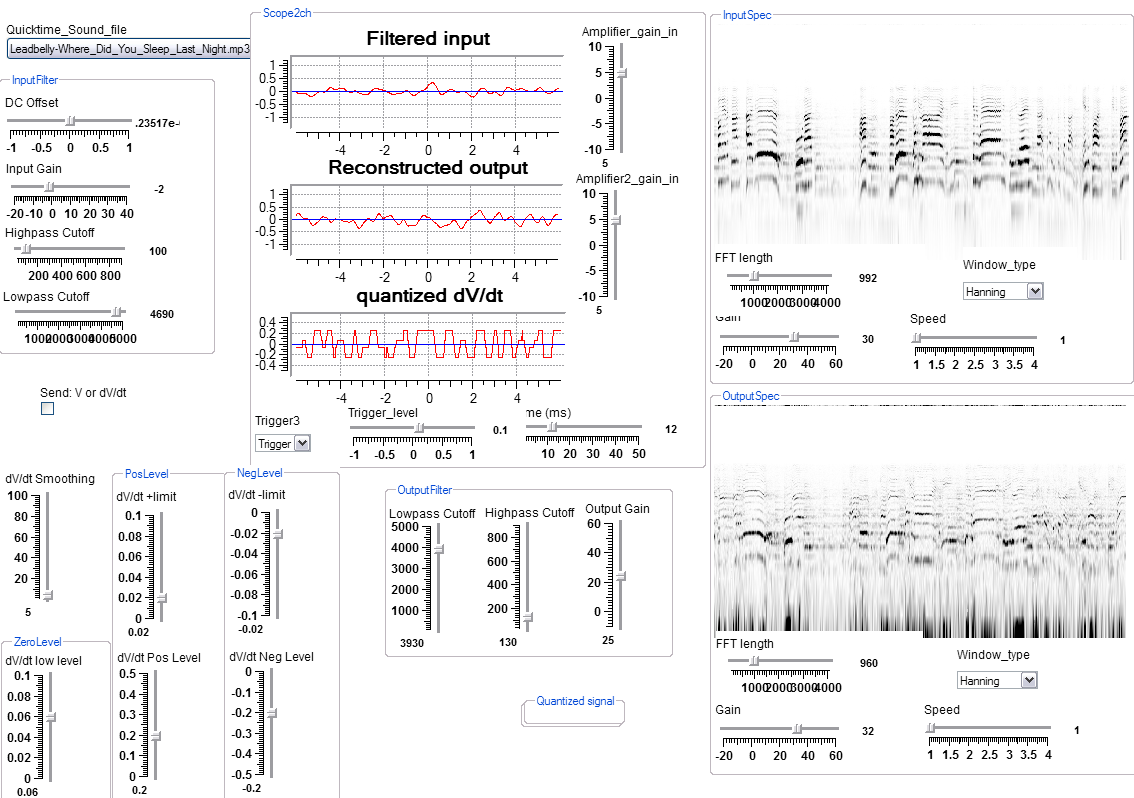
This program implements selectable 2-bit quantization of either a signal or its first derivitive. The input signal must be adjusted so that its average value is zero. Controls are supplied to do this. There are five quantizing/reconstruction parameters to set:
Only 4 voltage levels are sent. The continuous input is compared to zero, a positive level and a negative level to make 4 ouput voltages. If the quantized first derivitive is sent, then it is integrated in the OutputFilter module. The signal-to-noise ratio is considerably better when the quantized derivitive is sent because the dynamic range of the first derivitive is smaller. The integrator is actually a one-pole lowpass filter with a corner frequency below the lowest frequency in the signal (about 100 radians/sec).
Cochlear Resonance: determining the Q of the ear.
This program explores the effect discovered by Gold and
Pumphrey (1948) in which two closely spaced bursts of sinewaves sound different depending on their phase. Gold and
Pumphrey interperted this as evidence for ringing of the hair cell and for active amplification in hair cells decades before most physiologists accepted the result. You would use the program by setting up a frequency, delay, etc, then use a single mouse-click to toggle the invert/noninvert control. Using a 1 mSec burst of 4 kHz sinewaves, I could hear a difference out to about 10 mSec delay between pulses. This corresponds to about 40 cycles of the sinewave, which impiles a Q-factor of around 40, which is in the range measured by Gold and
Pumphrey. It also seemed that the quality of the sound changed for a large fraction of a second after changing phase when the period was set to 50 mSec.
Frequency glide continuity
This program implements demonstrations 14-16 of an auditory illusions page by Yoshitaka Nakajima, Takayuki Sasaki, and Gert ten Hoopen. The idea is that a noise burst will cover a lot of discontinuity in a frequency-ramped sine wave. The interactive controls allow the user to vary the first and second frequency ramps, the duration of the gap between them and the amplitude and bandwidth of the noise which fills the gap. An example wav file has ramps with a 500 Hz discontinuity with two repetitions of no noise and two repetitions with noise.
Ramp generator macro contents:
This section will outline modules which ship with Koé.
Insert menu. Modules can be added to a program by right-clicking the design-view window. A menu of module catagories appears.
The module catagories are listed here, then expanded below.:
File I/O
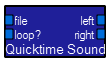 This sound file input module works by default on a Mac, but requires Quicktime to be installed onWindows XP. You can get a free version of Quicktime from Apple. Input
 file, when right-clicked, will produce either a fine name constant or an interactor button in the interactive view. The loop? input allows you to choose one play or looping. The outputs are left and right channel waveforms. The file is opened when you press the Koé play button.
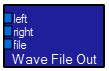 The
The left and right inputs take waveforms corresponding to stereo channels. The file input, when right clicked, allows you to choose a contant file name, or to chose the file name in the interacive view. The interactive file chooser (in the default state) is shown below. When you press the Koé play button, the file is opened. When you press stop, it is closed and can be used by another program. 
The filter modules are designed to be used in combination, generally within a macro. Generally, there are modules for FFT filters, IIR (infinite impulse response) filters and FIR (finite impulse response) filters. FFT filters work by converting the input signal into Fourier domain, multiplying by a desired frequency-amplitude profile, then doing an inverse-FFT. The process seems bulky, but is actually faster to perform for some filters. IIR and FIR filters work in the time domain by shaping an output based on linear combinations of past inputs and past outputs. IIR filters simulate the classical, analog electronic, continuous-time filters. FIR filters are slower to compute than IIR filters, but allow for more accurate shaping of spectral amplitude and phase shift. The filter catagory also includes some special purpose and nonlinear filters including a clipper, a pure delay, a pitch shifter and a frequency inverter.
Many of the filter modules are shown in combination below because the the modules were designed to be flexible when used together.
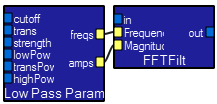 These two modules make a FFT-based lowpass filter.
Bandpass, bandstop, and highpass filters can be constructed using the three modules shown below in place of the
These two modules make a FFT-based lowpass filter.
Bandpass, bandstop, and highpass filters can be constructed using the three modules shown below in place of the lowpass parameter module. The cutoff input determines the maximum frequency of full lowpass filter response. In the other parameter modules, the cutoff inputs set analogous frequency points. The trans inputs set the width (in Hz) of the transition from the passband to the stopband. The strength inputs set the slopes of the transitions. The strength input sets the number of frequency/amplitude pairs set to the filter, and the various pow inputs set the relative density in different frequency ranges. In general, leave the strength and pow inputs at the defaults, except for very low frequency cutoffs, which may require more points. 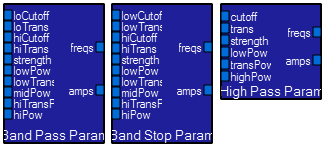
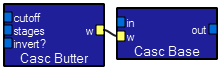 These two modules make a lowpass filter. The
 cutoff input determines the maximum frequency of full filter response. The stages input sets the number of poles, or how fast the signal is attenuated above the cutoff frequency. The invert? boolean input sets the sign of the output. The in input is where the waveform is applied. A butterworth lowpass filter has an optimally flat response in the passband, good transition to the stopband, and some overshoot on a square wave. Overshoot is acceptable as long as the number of stages is less than about 6. You would use this filter where accurate relative amplitudes in the passband are important. 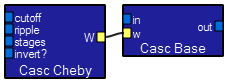 These two modules make a lowpass filter. The
 cutoff input determines the maximum frequency of full filter response. The stages input sets the number of poles, or how fast the signal is attenuated above the cutoff frequency. The ripple input sets the allowable variation of response in the passband. The invert? boolean input sets the sign of the output. The in input is where the waveform is applied. A Chebychev lowpass filter has an optimally steep amplitude cutoff response and a lot of overshoot on a square wave. You would use this filter where sharp discrimination of frequencies is important. Phase changes are large for this type of filter. 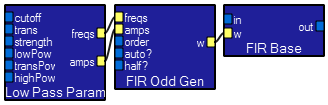 These three modules make a FIR lowpass filter. Any of the three moudles below may be substituted for the first one. The
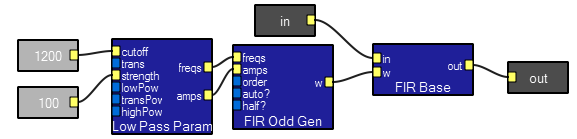
 cutoff input determines the maximum frequency of full lowpass filter response. In the other parameter modules, the cutoff inputs set analogous frequency points. The trans inputs set the width (in Hz) of the transition from the passband to the stopband. The strength inputs set the slopes of the transitions. The strength input sets the number of frequency/amplitude pairs set to the filter, and the various pow inputs set the relative density in different frequency ranges. In general, leave the strength and pow inputs at the defaults, except for very low frequency cutoffs, which may require more points. The FIRoddGen module implements the Parks-McClellan-Remez optimization for a FIR filter to make the best least-squares fit the the parameters, consistent with linear phase response. The order input on the FIROddGen module lets the user specify what
order filter to use. If' auto? is true, then the order is calculated
based on the number of control points such that the filter is the
lowest
order that goes exactly through all the control points. If both half?and auto? are on, then we use half the order for the filter as we
would've used if auto? was on and half? was off. 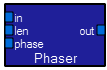 This module implements a frequency-independent phase shift. The waveform at the
 in input is phase shifted by the phase amount given in radians. The len input specifies the size of the FIR used, and thus the accuracy of the shift.  This module implements a running average of the last
 len samples. The waveform at the in input averaged. This module is not optimal for lowpass filtering, but is very useful for converting pulsed shapes to ramps. 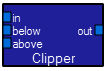 The waveform at the
 in input is clipped at the two values given in the below and above inputs. This is a nonlinear operation. 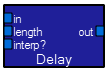 The waveform at the
 in input is delayed by len samples.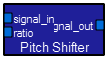 The waveform at the
 in input has its frequencies shifted by a ratio between 0.25 and 4.0. The timing of the input is not affected. High frequencies become low, low become high. The highest possible frequency is about 22,000 Hz, or 1/2 the sample frequency.
 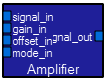 The
The signal_in input is amplified by the gain specified by the gain_in input. The result is added to the offset_in and appears at the signal_out. Any of the inputs can be waveforms or constants. Thus the ampilfier can be a four quadrant multiplier for two waveforms. The mode_in input controls the way the gain input is interpreted. For mode 0, the gain is in power db. Mode 1 implies the gain is given as a power ratio. Mode 2 means that the gain is given in voltage db, and mode 3 means the gain input is a voltage ratio (straight multiplier). Note that the math modules are meant to be used for user interaction and are only updated about every 25 mSec. You cannot use these modules for general waveform processing operations . Instead, refer to the wave macros described in the macro section.
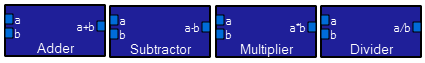 These modules perform an arithemtic operation on the two inputs. The output is not a waveform, but can be converted back to a waveform using the DClevel macro as shown. The output may be used directly as a variable scalar.
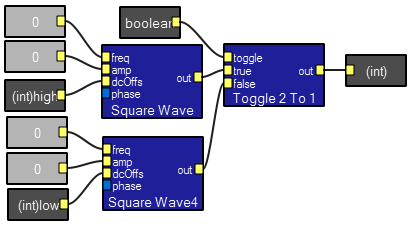
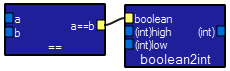 The equality testing module produces a boolean output (equal/not equal) which can be fed to a toggle module directly. The module is shown attached to a boolean2int macro which converts the output back to a waveform. The unattached inputs on the macro,
 (int)high and (int)low, specify the output if the boolean input is true or false respectively.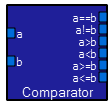 The two inputs are compared. The outputs are boolean values. These outputs may be used to control a toggle module directly. The module can be attached attached to a boolean2int macro which converts the output back to a waveform. The unattached inputs on the macro,
 (int)high and (int)low, (shown in the Equality entry above) 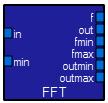 The Fourier spectrum of the
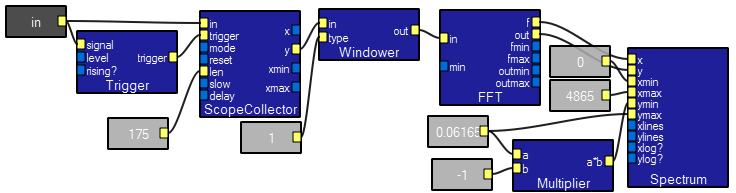
 in input is performed. The input must be from the ScopeCollector module described below in the Visualization Section. A Windower module (below) may be added at the input to reduce FFT artifacts. Examples of spectrum and spectrogram display will be given in the Visualization section. The min input is the guranteed minimum size of the transform. 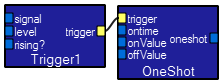 The
The oneshot module (along with the trigger module) converts a postitive/negative edge on the signal input into a specified length pulse. The ontime input must be given in samples. The trigger module level input sets the thresold and the rising? input chooses a postitive/negative edge. The onValue and offValue inputs set the oneshot levels. 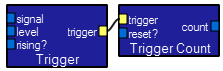 The
The TriggerCount module counts the number of times that a trigger has occured. The reset? input clears it. If the signal input were a fixed frequency square wave, then the count output would be a running measure of the simulation time. 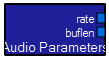 This module allows progarms to find out what the audio environment of the computer is. The most useful is the
 rate output whcih is used extensively to convert a time to a sample length. 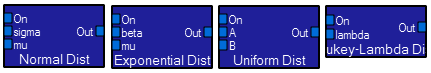 These 4 modules produce a new random number about every 25 millseconds if the
 On input is TRUE. The distribution parameters are set using the other inputs. The
NIST/SEMATECH e-Handbook of Statistical Methods has a description of the Exponential distribution, the Tukey-lambda distribution and other information. The Tukey-lambda parameter effect (from the Handbook) is summaried in the table below.
As with other probability
distributions, the Tukey-Lambda distribution can be transformed with a
location parameter (mean) , and a scale parameter (standard deviation). | Lambda | Effect |
| -1 | approximately Cauchy |
| 0 | exactly logistic |
| 0.14 | approximately normal |
| 0.5 | U-shaped |
| 1 | exactly uniform (from -1 to +1) |
cycletimer module turns on the distrubution module just long enough to get one new random number. 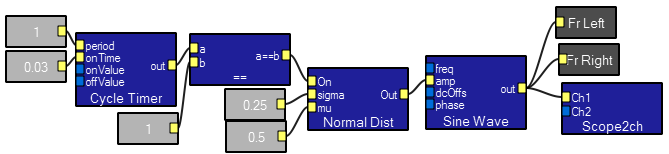
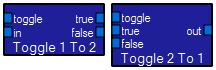 These two modules take a boolean
 toggle input to control an input or output. In the Toggle1to2 module, the in input is routed to one of two outputs, depending on the toggle input. In the Toggle2to1 module one of two inputs is routed to the output, depending on the toggle input. The inputs must be waveforms. 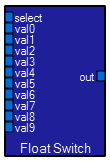 The
The FloatSwitch module selects one of ten inputs to be routed to the output. If the select input is not between 0 and 9, then there is no output. Hooking a triggercount module to the select input is an easy way to make a sequencer. The inputs can be waveforms or constants. 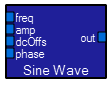 The
The
freq input controls the frequency of the sinewave in Hz. The amp input controls the amplitude in volts. The dcOffs controls the DC level in volts added to the sine wave. The phase input controls the phase in degrees. Any of the inputs can be connected to a waveform, a variable scalar, or a constant scalar.
The output of this module is a sinusoidally varying waveform. Squarewave, Sawwave, and trianglewave modules are connected in the same fashion as the sinewave module. The outputs of each type of module is a waveform of the appropriate shape.
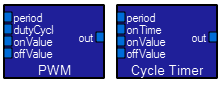 These two modules are very similar. Both produce a pulse train wavefrom at their outputs. The
 period input specifies the repeat time of the output in seconds. On the PWM module, you can specify the duty cycle as a percentage of the period, while on the Cycle Timeryou specify the pulse on time. On both modules you can specify the output levels for the pulse on (onValue) and the pulse off (offValue). All inputs can connect to constants or waveforms.
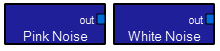 These two modules generate noise waveforms. The PinkNoise generator produces equal energy per octave, while the WhiteNoise generator produces equal energy per cycle of bandwidth.
 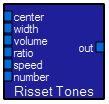 This module produces a specialized tone combination with unusual characteristics. A person listening to the output will hear a continually rising tone sequence which does not actually increase (on average). For more information see http://sigchi.org/chi96/proceedings/shortpap/Beaudoin-Lafon/Mbl_txt.htm. The inputs control the character of the illusion, but I have not systematically explored this module.
 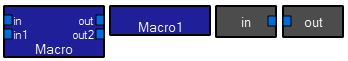 The first two modules allow you to insert a new macro into a program. The
 in and out modules are terminals to be put inside a macro in order to communicate with the outside program. The terminal modules can be renamed by right-clicking on them. These new names appear on the macro when viewed from the outside program.The visualization modules will be shown as useful combinations, rather than as single modules becuase of the interactions between them. The combinations will be
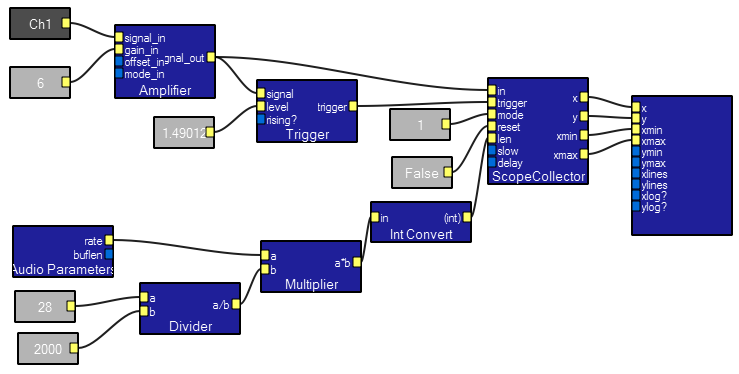
The ScopeCollector module is central to operation in all of these combinations.
Generally, the ScopeCollector module clips out a chunk of the input signal (and time base) to process and display. The chunks may be further processed or displayed directly. The scopeCollector trigger input singnals the module to acquire a chunk. The mode input sets the trigger mode to auto, free, trigger or single. The len input sets the size of the chunk which which is captured by the module. The reset input waits for a true value before allowing another trigger
in the case where the trigger mode is "single". The delay input appears to set
the amount of time (in bufferLength samples) before the collector
will go into autotrigger mode again.
If you are computing an FFT for display, the windower applies a smoothing window to the data, according to the window type given by the type input. In general, the Hamming, Hanning, and Blackman are very similar (and good), while the rectangular window will cause significant frequency artifacts. The default window type is rectangular.
type |
Window |
| 0 | Rectangular |
| 1 | Hanning |
| 2 | Hamming |
| 3 | Flattop |
| 4 | Blackman |
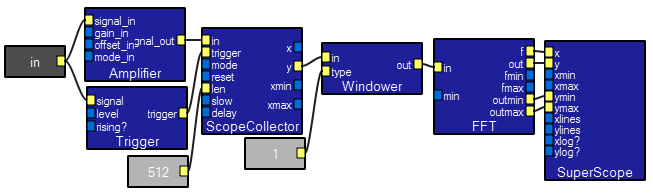
trigger module detects a setable level and the windower minimizes FFT artifacts. The superscope module actually draws the scope in the interactive view.
len input to the scopecollecters sets the time base.
scope collector module slow input controls scrolling speed. The log resampler converts the linear frequency scale to a log scale. wave modules below. Arbitrary combinations of modules may be combined to make a new module. Here is a list of some of the macros we have written, along with descriptions of how to use them. To use any of the macros:
Save Link As... option of your browser. Save the macro in a handy folder. Insert menu and choose Insert macro. In the dialog box, choose the macro you have downloaded. The macros included here are:
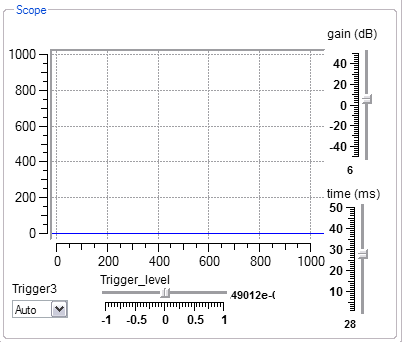
The scope macro simulates a one channel oscilloscope. The design view and interactive view are show below. There is one input which takes a waveform. Interactive controls include scope vertical gain in db, time base, and trigger controls.

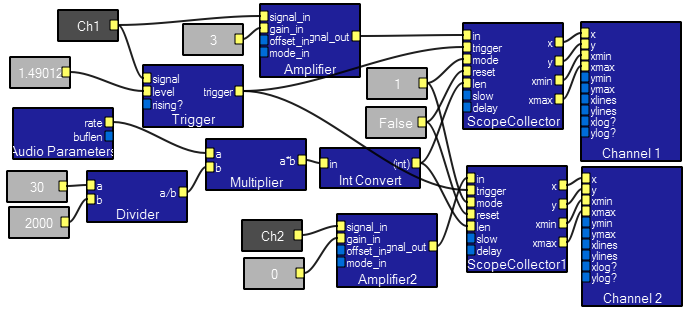
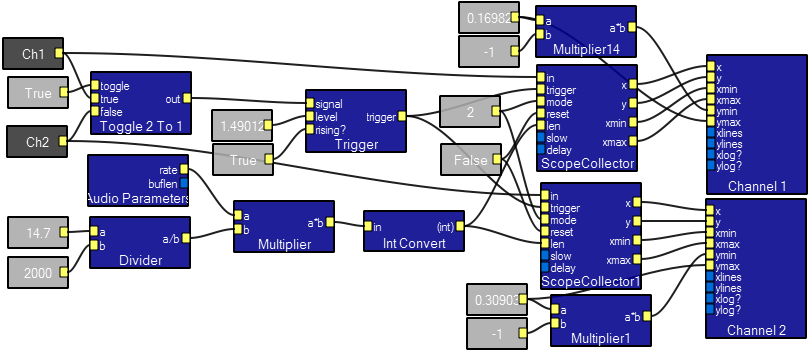
The scope2ch module simulates a two channel oscilloscope. The design view, interactive view, and contents of the macro are show below. There are two inputs which each take a waveform. Interactive controls include scope vertical gain in db for each channel, time base, and trigger controls.
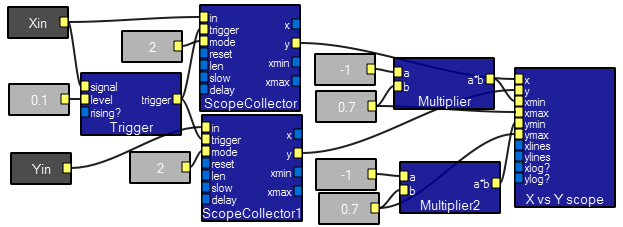
The XYscope macro allows two waveforms to be plotted against one another. A short demo program shows how to plot Lissajous figures. A very nice use of this module is detection and quantification of stereo signals. Mono signals appear as a straight line, while stereo signals form a complicated nest of lines.
Program design view
Interactive view
Macro contents.
This short demo program has 4 improved display macros with better scaling and trigger control. The spectral displays also include window control and FFT length control.
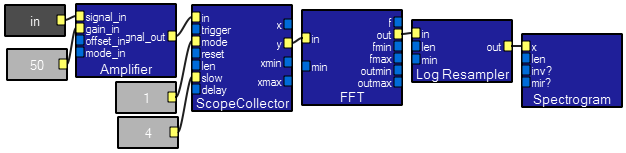
Spectrum macro contents.
Spectrogram macro contents.
Scope2 contents.
XY scope contents.
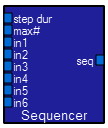
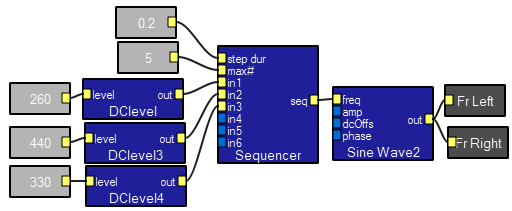
The sequencer macro allows up to six different waveforms to be played in sequence. The design view and contents are shown below. An example of its use is in the examples section above. The step dur input sets the time each of the 6 waveform inputs will be played. The max# input sets how many of the six inputs will actually be in the play cycle. The output is a waveform.
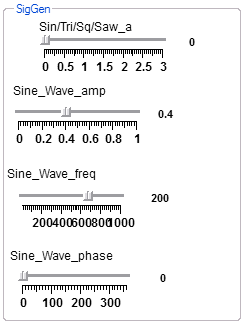
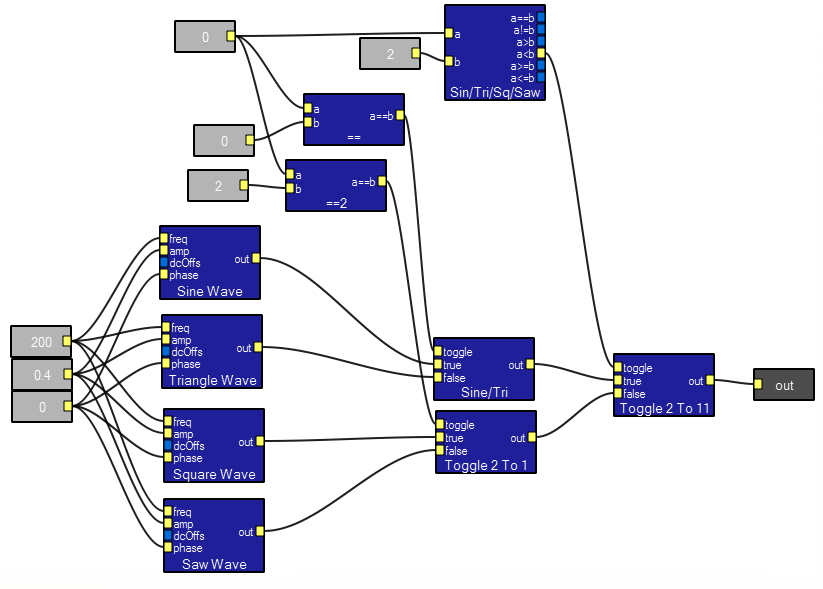
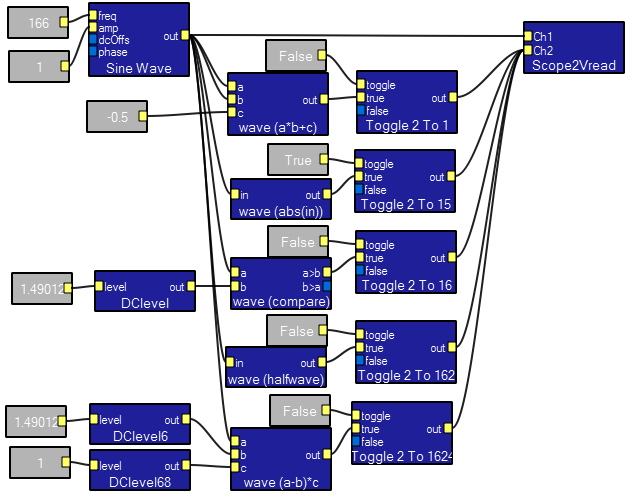
The SigGen macro combines sine/square/triangle/sawtooth into one module. The output is a waveform. The interactive controls include a wave type selector, plus frequency, ampliude and phase. The contents of the module shown below indicates how to make a 4-way selector out of three 2-way selectors.
![]()
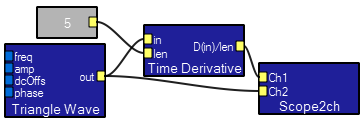
The TimeDerivative macro takes an approximate first time derivative of the input signal. The derivative is formed by subtracting a time delayed, inverted version of the signal from itself. Shorter delays are a better theoretical approximation of the first derivative, but tend to be noiser.
Design view.
Contents:
Interactive view. Top trace is derivative of bottom trace:
The SoftToggle2:1 macro is useful when you don't want a click transient during a transition. The module perfroms a linear interpolation between the on and off states by varying the gain of an amplifier smoothly between zero and one. The len input sets the number of samples over which the transition occurs. In the demo program, shown below, try changing the length parameter to zero and to 10,000. The contents of the macro is shown. The boolean2int macro is explained in the next section.
The contents of the macro:
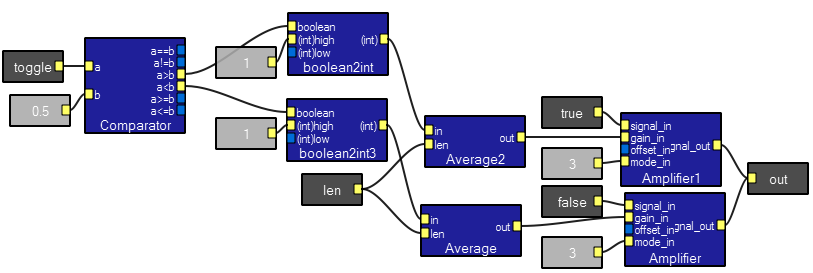
The boolean2int macro is used to convert a boolean type signal (e.g. output of comparator module) to a number. There is a boolean (ture/false) input, the value, (int)high, to be used in the boolean input is true and the value, (int)low, to be used if the boolean input is false. See above for an example.
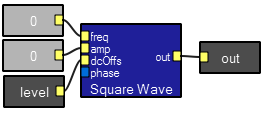
The DClevel macro is used to convert a scalar variable to a waveform. This is particularly useful in converting the output of arithmetic modules back to a waveform. However, the output of arithemtic modules is only updated a few times/second so this module is best used in the role of generating a constant waveform. A demo program uses the DClevel module to switch between frequency parameters applied to a sinewave module.
Macro contents.
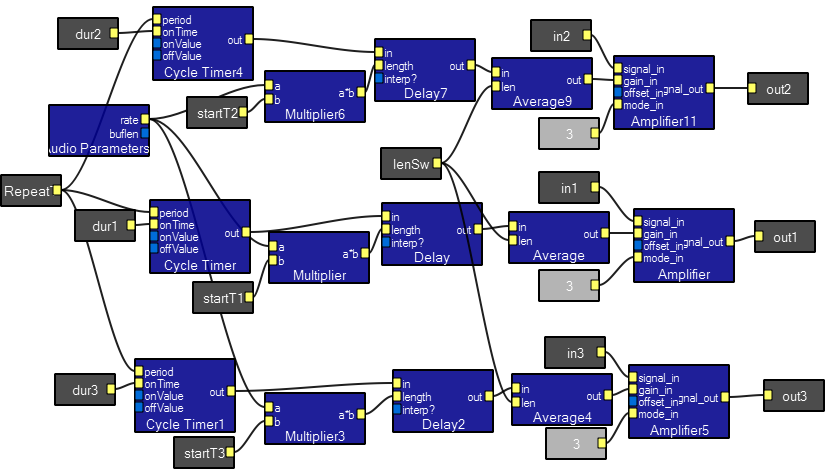
The Sequencer 2 macro takes up to three sources, durations and start times for up to three output events. All times are in seconds. The lenSw input sets the number of samples in the on-off and off-on transitions. This should be set to a few cycles of the highest frequency for a clickless transition. You can get some interesting effects by increasing the length to 10,000 or so. The demo plays three tones.
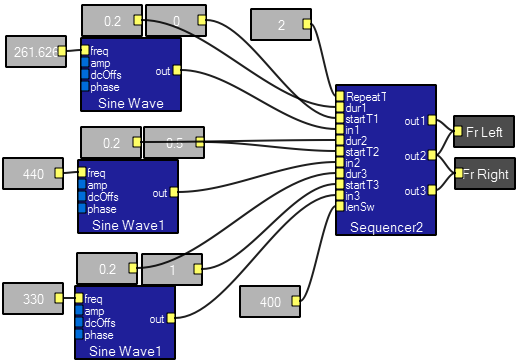
Contents of the macro
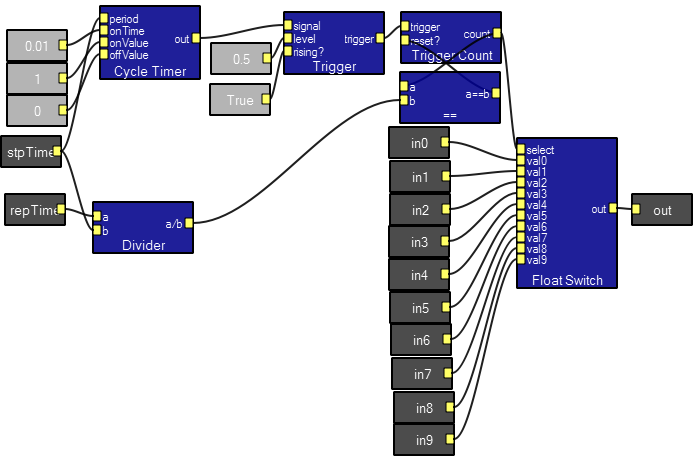
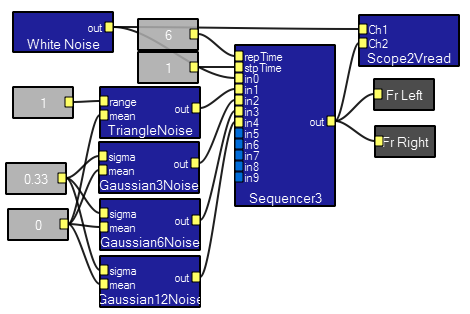
The Sequencer3 macro takes up to ten sources, cycling through them with a fixed step time and repetition time. All times are in seconds. A demo program plays a scale.
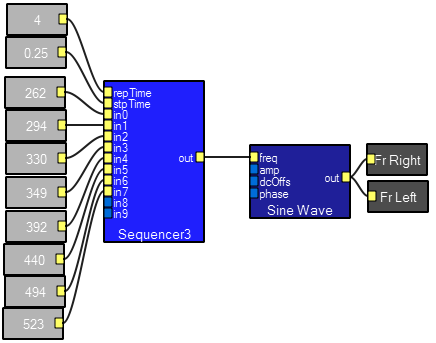
Sequencer3 contents. The triggerCount module output is compared to a total step number and used to reset itself.
The EventControl macro takes as input a repitition time, a delay time, duration time, either a waveform or a scalar and a smoothing constant. The output is either the waveform or the scalar. The gate output is at unity during the time the output is active. A demo program plays some sine waves.
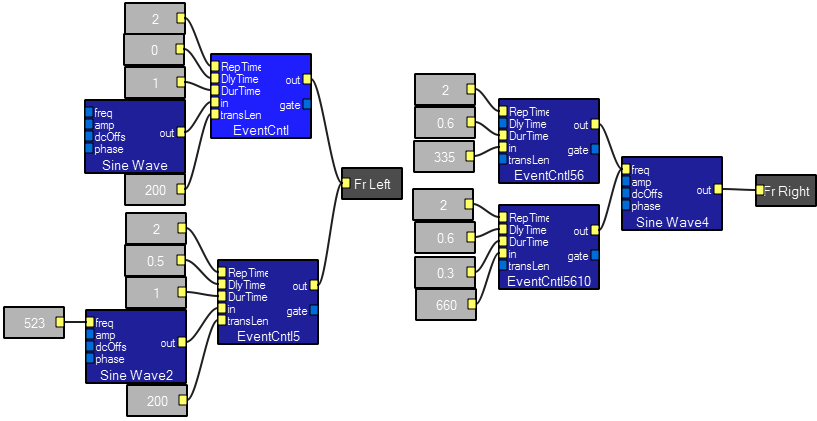
Macro Contents:
The NegExpGen macro takes a starting waveform edge, a time constant (tau), a smoothing length, and an initial and final value and produces an exponential decay envelope. The macro generates 5 time constants, with 2 samples/time-constant. An example program applies it to the amp input of a sine wave generator generates a bell or drum-like timbre. Increasing the smoothing diminishes the step-like appearance.
The EnvelopeGen macro takes a rise time, sustain time, and exponential decay time constant and produces an envelope from it. The demo program runs one of 5 waveforms through the envelope. The macro is written as a series of oneshots so that the relative timing of each waveform could be varied. In fact, the rise time, sustain and decay sections use different times. A plucked string is simulated by a fast rise time, short sustain and long fall time modulating a triangle wave. A bowed string is simulated by a slow rise time, short sustain and long fall time. Adding some second harmonic to a sine wave makes it even more string-like.
A demo program shows how to use 5 macros which allow full bandwidth arithmetic, including comparisons and absolute value, to be done on waveforms. The contents of the modules are all simple amplifiers and toggles. You can copy/paste these macros into other programs, or right-click on a macro and export it. It is easy to make up your own custom functions using these as templates. Note that if you want a constant value input, you must use the DClevel macro.

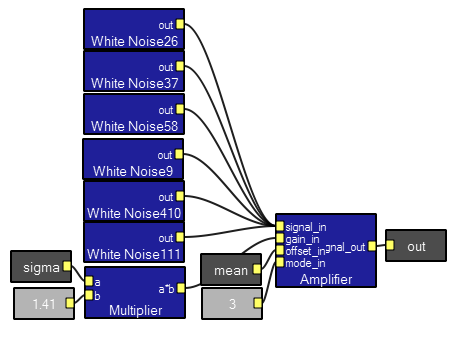
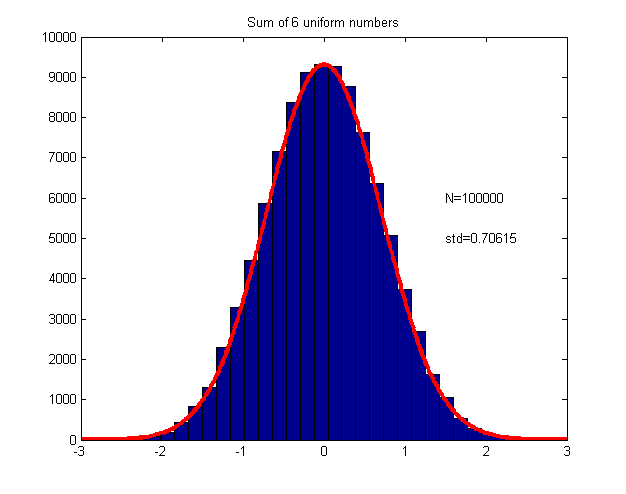
A demo program shows how to generate Gaussian noise. Each of the 4 noise modules is an approximation to Gaussian noise based on the central limit theorem. Gaussian6noise is probably the best tradeoff between quality and efficiency with a good fit out to 2 standard deviations, but Gaussian12noise is good to 3.5 standard deviations. A matlab program generates histograms. See below for n=6.
Contents of Gaussian6Noise. Six white noise sources are scaled and offset.
The following histogram shows a histogram of 100,000 sums of six random numbers overlayed with the expected Gaussian.
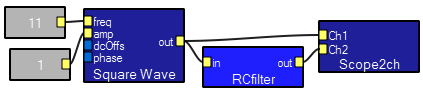
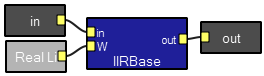
A demo program shows the RC macro in use. There is no input tab for time constant because the list interactor is broken at the moment (Jan 2006). To set the time constant, τ, of the filter, compute α=exp(-.0001/τ). Open the macro and double-click the list interactor. Enter α into the second list entry. Be sure to press enter. Set the first list entry to (1-α). All other entries should be zero or blank. The expression for α comes from a first-order approximation to the differential equation.
Gold T, Pumphrey RJ. Hearing. I. The cochlea as a frequency analyzer. Proc R Soc Lond B Biol Sci. 1948;135:462–491.
Gold T. Hearing. II. The physical basis of the action of the cochlea. Proc R Soc Lond B Biol Sci. 1948;135:492–498.
Voroba, Barry (1978) Experimenting in the Hearing and Speech Sciences, Starkey Labs, ISBN 0-9601970-2-8