Introduction
As part of an effort to make inexpensive and flexible biology lab instrumentation, we have written a Matlab program which:
We used Matlab because it is a flexible programming language which includes the abilities to:
This page is divided into two parts; program use and program internal structure. Obviously, you don't need to understand the program internals to use it, as long as nothing goes wrong.
Using the Program
If you want to use the program you must have a licensed copy of Matlab release
14. Later in the fall we expect to have a version which will run standalone
without Matlab. You then need to download the program we wrote (see links below).
Be sure that your Matlab 'path' includes the folder where you stored the program.
If you are not sure use the SetPath... option in the File
menu to investigate. The NIDAQ version assumes that you have a National Instruments
data aqusition card, and have installed the version 7.30 NIDAQ drivers. This
program is cycle and memory hungry. It may not work well on slow machines. I
have tested on
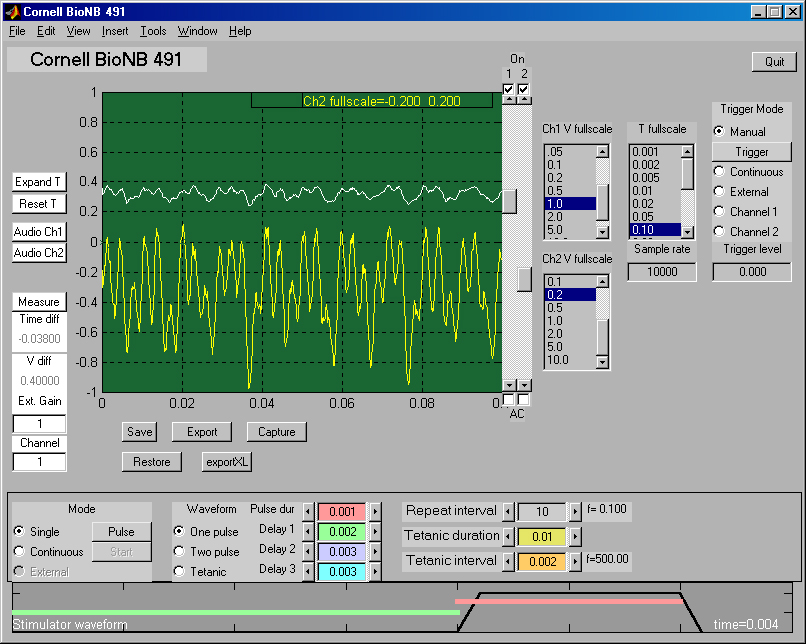
The GUI consists of two parts, a simulated oscilloscope and a simulated stimulator, hereafter refered to as the scope and stimulator.
The scope controls:
V fullscale control, for each channel separately. Channel
1 scale is shown on the y-axis of the plot. Channel 2 scale is shown in yellow
at the top of the plot..T fullscale control.Manual, which activates the scope Trigger
button. Pressing the Trigger button will cause the scope
to acquire one trace. To quit from the program or change the scope time
scale, the trigger mode must be Manual.Continuous to acquire data as fast as possible.Trigger Level control.Channel-1 or Channel-2 which triggers the
scope when the voltage on the respective channel is equal to the value
set in the Trigger Level control.Expand T control activates a cursor-based drag box. Click
on the Expand T control, then click-drag-release in the scope
trace display. The part of the waveform you dragged over will expand to fill
the display in the horizontal direction. Voltage scaling is not affected.
A scrollbar appears so that you can scroll through the entire waveform.Audio Ch1 and Ch2 play the traces through the
sound card.Measure control activates a cursor-based drag box. Click
on the Measure control, then click in the scope trace display.
The click sets a zero value. The difference between the zero value and current
cursor position is placed in the edit fields below the control. Since each
trace can have different gain, you must choose the trace. If you have an external
amplifier between you experiment and the computer input, you can set the gain.Save stores the entire data structure of the scope on the disk
using a standard dialog box.Restore reloads a saved data structure.exportXL saves the two voltage traces as an Excel datasheet,
with time, trace1 and trace2 as columns.Export causes the entire data structure of the scope to appear
in the standard Matlab workspace. You can then access any value from any control:
ScopeData.y(:,1) and ScopeData.y(:,2)
in units of volts.ScopeData.x in units of seconds.ScopeData.triggerlevel.ScopeData.Fsin.ScopeData(1) at
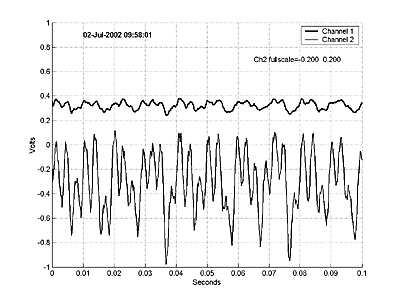
the Matlab command prompt.Capture causes the scope traces to be copied to another window,
time stamped, and formated for printing. Once a display has been captured,
the standard Matlab print, export, save and edit commands may be used. For
instance, you can add a title. Saving the captured image from the file menu
allows you to repoen it at a later time. The image below was captured from
the traces shown near the top of the page.The stimulator controls.
Single, which activates the Trigger buttonContinuous to produce pulses at the rate specified by the
Repeat Interval control when the Start button is pushed.start button is pushed.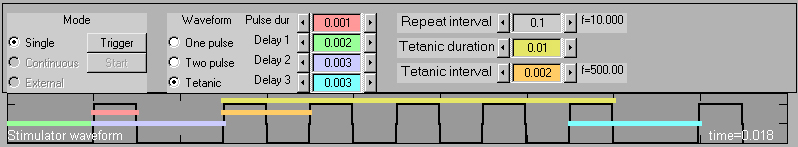
Save stores the entire data structure of the stimulator on
the disk using a standard dialog box.Export causes the entire data structure of the stimulator to
appear in the standard Matlab workspace. You can then access any value from
any control:
ScopeData.waveformScopeData.delay1, ScopeData.delay2, ScopeData.delay3ScopeData.width.ScopeData.Fs.
Program Internal Organization
The program is structured as a Matlab function. Persistant data is stored in
the UserData area of the figure. The initial execution of the function
from the command line initializes a bunch of variables and the GUI, then exits.
At that point, the GUI is drawn in the figure window and all the GUI controls
are waiting patiently for a user action. Control returns to the main function
under three conditions:
 'CallBack',[data.myname,'
    action']
. The structure element data.myname holds a string
which is the name of the file holding the main function. The literal string
which follows defines the actual action within the function.set(data.ai,
'TimerAction', {data.myname,'action'}). Where data.ai
holds a handle to the analog input device, the litereral TimerAction
specifies which action type will be defined and the cell-array {data.myname,'action'}specifies
the function and parameter which will be occur when the DAQ timer times out..Each of the events or callbacks passes a string to the main function which
is dispatched by a gigantic case statement to perform an action,
perhaps modify the persistant data, then exit. Since the main function is not
running most of the time, the Matlab command line stays active.
The DAQ toolbox provides an (almost) hardware-independent, abstract, data acqusition
interface to Matlab. Several devices are supported. Currently separate versions
of this program are written to support the Winsound device and National Instruments
NIDAQ hardware. It turns out that there are some device dependencies. A flag
must be set in the program to select the hardware to be used before you run
it. The DAQ toolbox defines analog input and analog output objects which have
quite complex, and potentially asynchronous, behavior. The usual get/set
commands specify DAQ object parameters and read back their state. Debugging
the porgram consisted mostly of figuring out how to set up DAQ objects and their
parameters.
Note that it is possible to produce weird concurrent errors if the user happens to trigger a GUI element at just the wrong time. I am still working on this. There are a few sub-functions near the end of the program. One constructs the stimulator waveform. Another displays an scope trace.