Spike (action potential) detection and sorting.
Bruce Land and Andrew Spence
Introduction
Neurobiologists often want to detect and characterize action potentials. For
this journal club we decided to talk about techniques for finding spikes in
noise (random and 60 Hz) and techniques for separating the sources of muliple
spikes.
There are two basic questions:
- If you have data with noise, what is a spike and when was it?
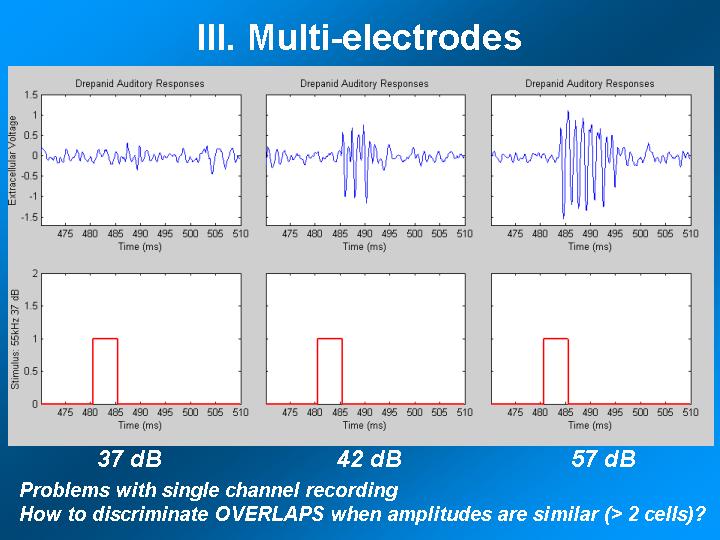
- If you have more than one axon, which spike was it?
The talk broke into two parts. Bruce covered detection and Andrew covers sorting.
Detection
Generally you need to do the following to find spikes:
- Minimize the noise
- Shield: 60 Hz and computer spikes
- Use low R electrodestrodes to minimize thermal and flicker noise
- Use low noise amps.
- Isolate prep from irrelevant action potentials.
- Emphasize spike relative to noise
- Filter in frequency domain: Works because spikes have fairly narrow
bandwidth compared to noise sources. However, note that filtering sometimes
introduces time delays. Traditionally, biologists tend to use continuous-time
filters such as the Butterworth "optimal flat" design. Such
filters get rid of lots of high frequency noise, but ring a bit.
- Select time domain features:
- Rise rate. Computationally this might look like
rate=v(t+1)-v(t-1),
but better first derivitive estimates are available in Matlab using
the filter toolbox.
- Time above threshold
- Template matching. While usually performed in the time domain, this
convolution technique is equivalent to a matched filter in the frequency
domain. An AP template is scanned across the input waveform, similarly
to a cross-correlation calculation.
- Median filtering -- Good at removing impulse noise and 60 Hz. A
straight median filter perfroms as a mediocre lowpass filter. However
you can build a very good highpass median filter by perfroming a straight
median filter, then subtracting the result from the original signal,
thereby emphisizing impulses, such as APs.
- Nonlinear Energy Operator (NEO) see references 1-3. NEO is an instantaneous
value proportional to
(amplitude)2(frequency)2.
The square-dependency on amplitude and frequency tends to emphisize
"spike-like" signals. NEO is defined as (dv/dt)2-v*(d2v/dt2),
but for calculation reduces to
NEO = v(t)2-v(t-1)*v(t+1)
where v(t) refers to a given voltage sample.
- Make a threshold determination based on the output of one or more of the
above filters.
Bruce decided to implement some of these techniques in Matlab to see how they
performed:
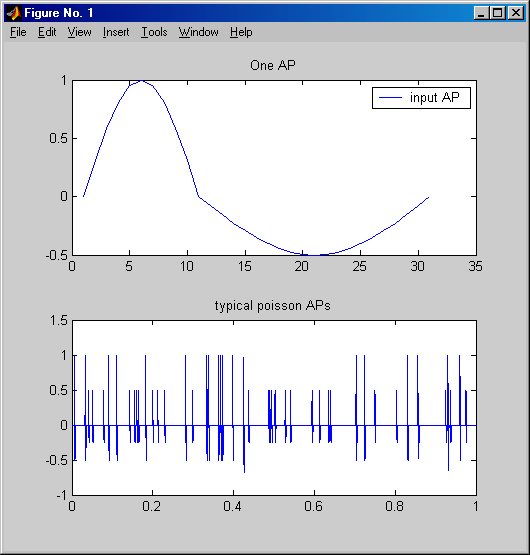
- The program PlotAP.m generates a slightly realistic
AP by concantenating two 1/2 sine waves, then produces a Poisson train of
two different amplitude APs.
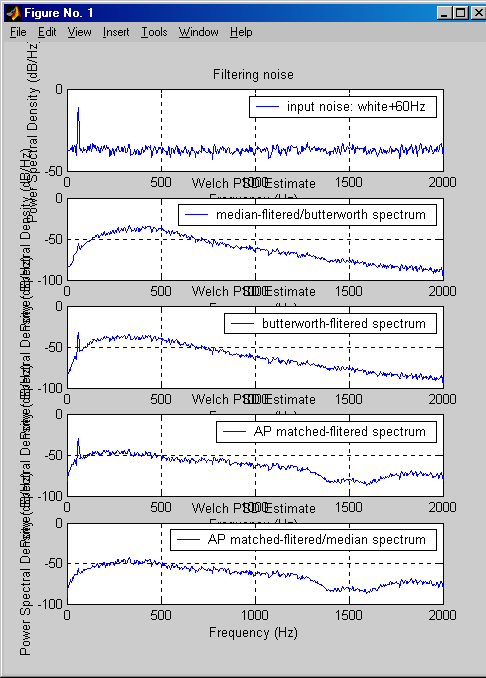
- The program MedianSpectrum.m shows five panels.
The first is the spectrum of white noise plus 60 Hz interference. The RMS
amplitude of the white noise and the peak amplitude of the 60 Hz were adjusted
to the same amplitude as the APs. (Signal-to-noise ratio of 0 db). The next
four panels show different filtering combinations:
- Median highpass+butterworth lowpass.
- Butterworth low and high pass
- AP matched-template filter
- Median highpass+template match.
The main thing to note is that median highpass surpressed a lot of 60 Hz noise.
The median highpass used a median lowpass filter set to a width equal to the
AP width, then subtracted that output from the original signal.
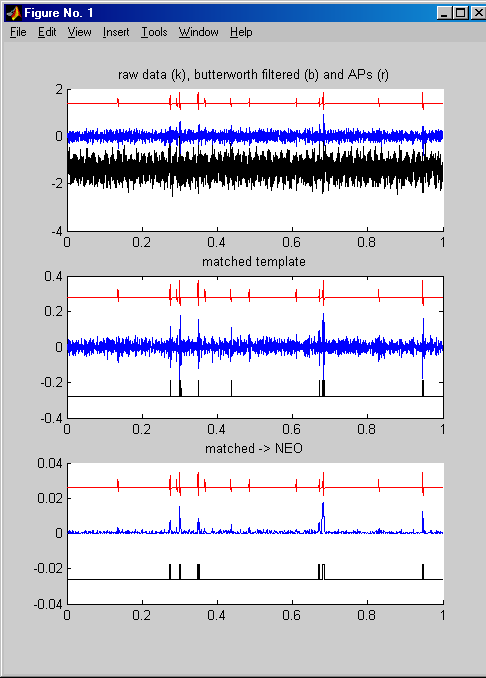
- The program DiscrimAP.m shows how to apply a sequence
of filters to find APs in noise. The panels:
- Panel 1 shows the raw data (black), butterworth filtered data (blue),
and the actual (computed) APs (red).
- Panel 2 shows the output of the matched template filter (blue), and
the loacation of the detected APs (black).
- Panel 3 shows the output of the matched filter passed thru the NEO filter
Both the matched filter and the NEO filter extract virtually all of the high
amplitude spikes from the noise. White noise amplitude was 0.3 of AP amplitude
and 60 Hz noise was 0.2 of AP.
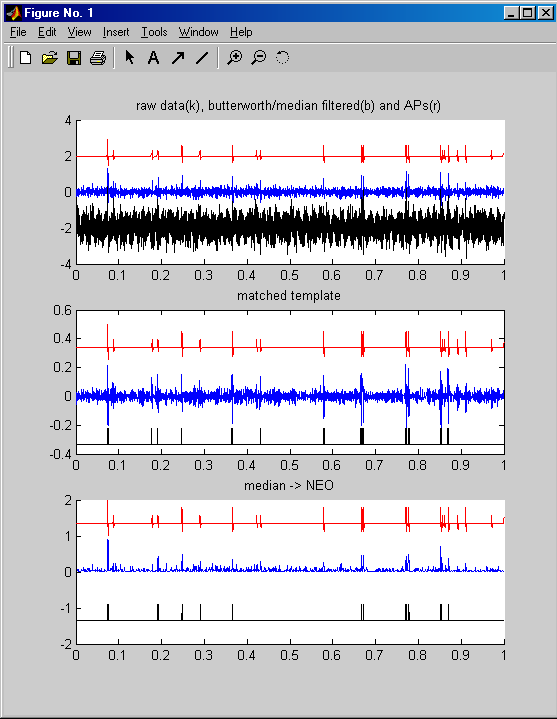
- The program DiscrimAPmedianNOmatched.m
fed a median/butterworth filtered signal into either a matched template OR
NEO filter. Both of them work quite well. On a 900 MHz pentium they perfrom
faster than realtime for 20,000 samples/sec. White noise amplitude was 0.3
of AP amplitude and 60 Hz noise was 0.2 of AP.
Sorting
Spike sorting of a multiaxon system gets hard becuase of overlaps in time between
several APs. The sorting scheme that Andrew talked about attempts to separate
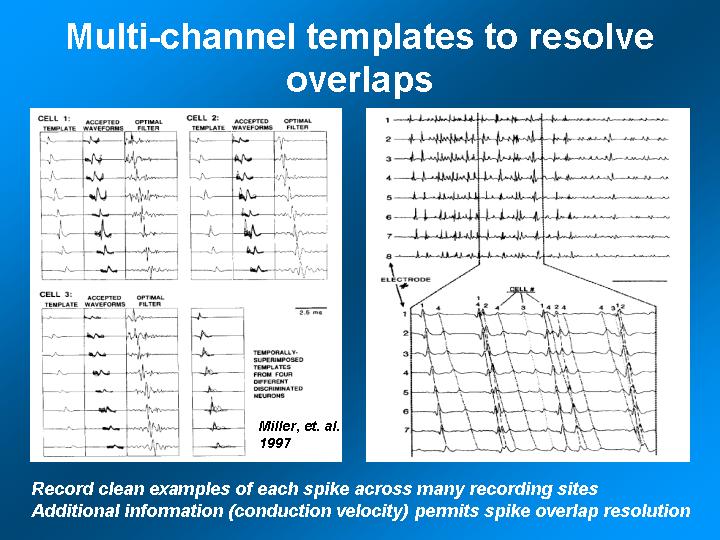
out overlapped APs (reference 4). The scheme has several steps:
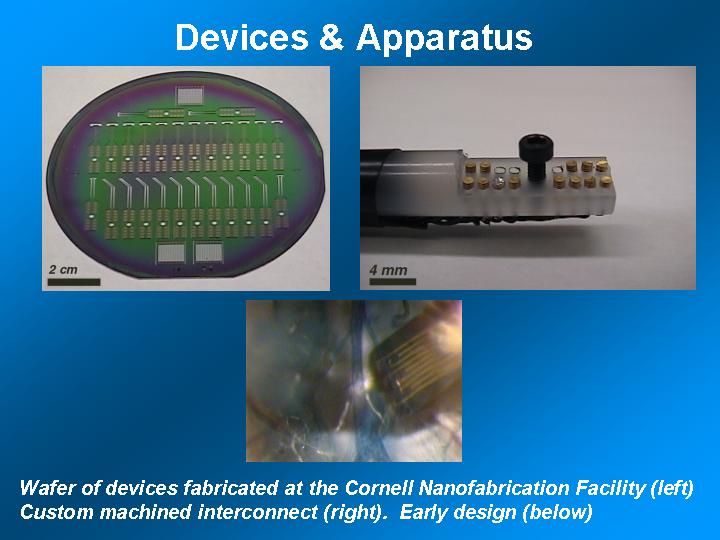
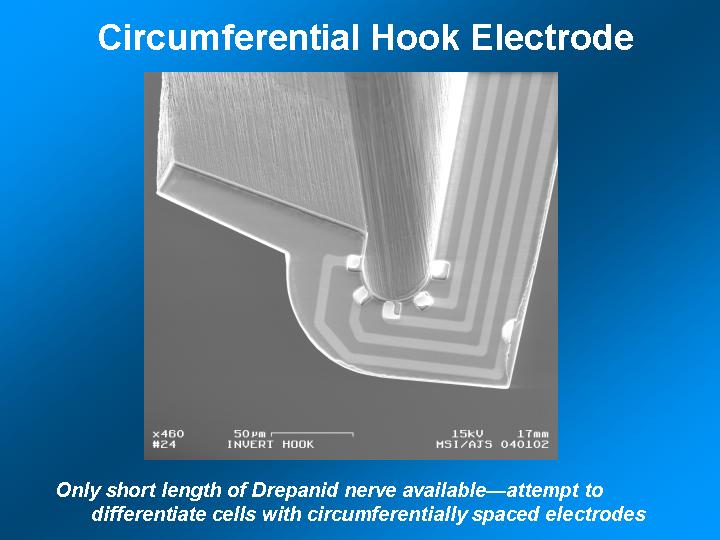
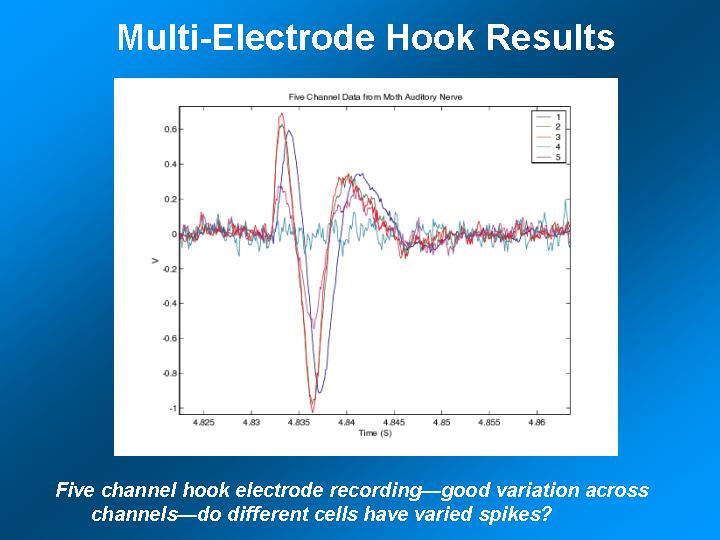
- Record from several electrodes. More electrodes means more total data to
aid in AP separation.
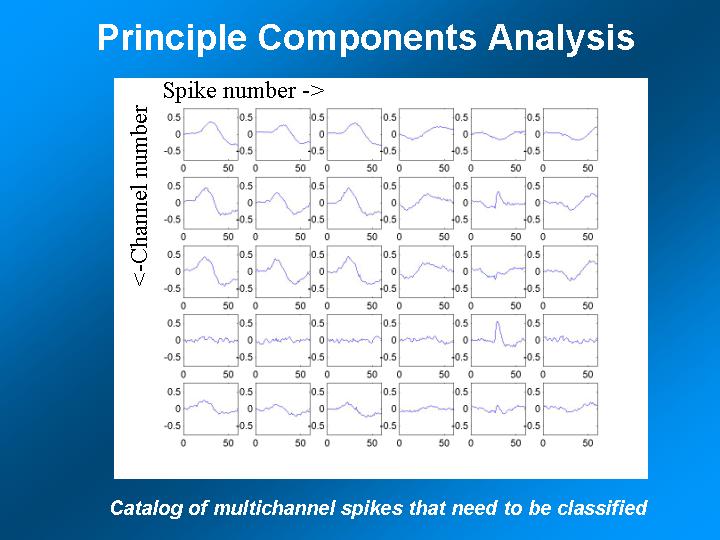
- Construct AP templates (often by hand) from data that appears not to be
overlapped. Andrew did this by isolating "nice" looking APs, then
performing principle-components analysis to look for clusters, then using
cluster members to make the template.
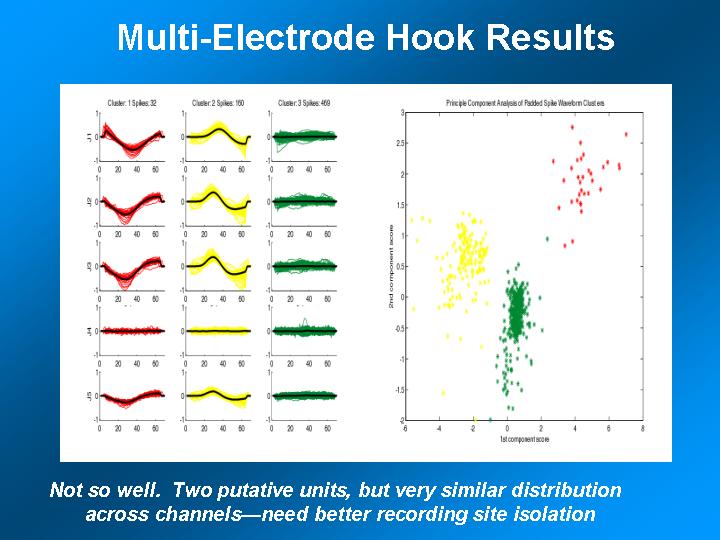
- Using each template, construct optimal filters, which at any frequency have
an amplitude proportional to the energy in the target template, divided by
the sum of the energy in the noise plus all other templates.
- Pass each recorded spike train through the optimal filters to (hopefully)
isolate each axon.
He did his talk as a slide show.
References
- "Neural Spike Sorting Under Nearly 0 dB Signal-to-Noise Ratio Using
Nonlinear Energy Operator and Artificial Neural Network Classifier,"
K.H.Kim and S.J.Kim, Biomedical Engineering, IEEE Transactions on , Volume:
47 Issue: 10 , Oct. 2000 Page(s): 1406 -1411
- “A new interpretation of nonlinear energy operator and its efficacy
in spike detection,” S. Mukhopadhyay and G. C. Ray, IEEE Trans. Biomed.
Eng., vol. 45, pp. 180–187, Feb. 1998.
- Signal Processing
for the Multiunit Extracellular Neural Signal Recording with Low Signal-to-Noise
Ratio
- Gozani, S. N. and J. P. Miller (1994). Optimal discrimination and classification
of neuronal action potential waveforms from multiunit, multichannel recordings
using software-based linear filters. IEEE Trans. Biomed. Eng. 41, 358--372.
- Spike
sorting FAQ