Introduction.
You will build a basic infrared pulse meter and measure pulse rate and blood pressure waveform.
Note: you do not have to record your blood pressure waveform if you feel at all uncomfortable sharing physiological data.
You can record data from the instructor.
Procedure:
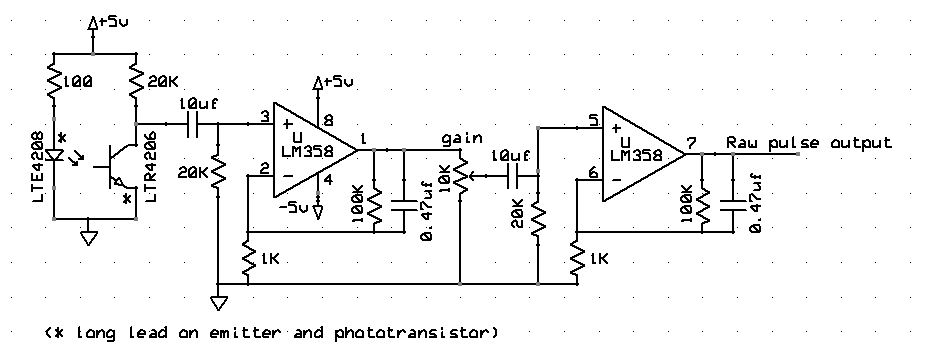
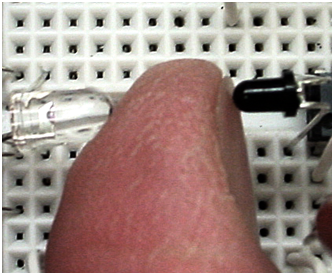
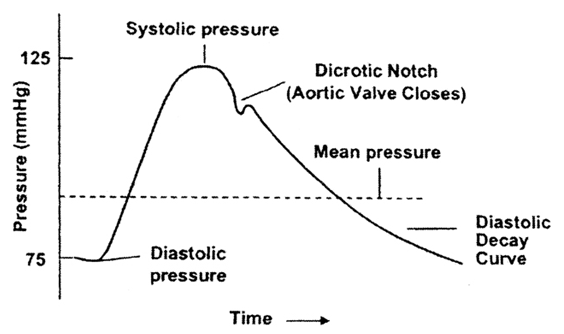
The LED infrared emitter should be placed to shine light into your finger tip. The amount of light scattered out is related to the amount of blood flow and hence phase of the heart beat. The light scattered is measured by a phototransistor, amplified and filtered by the two opamps. You can try reflection or transillumination. I found transillumination of my thumb to give the best signal. It is important that your finger does not move relative to the phototransistor or emitter. For testing, you can use a camera to see a slight glow in the IR emitter (on the left) because the camera is slightly sensitive to infrared light. Light is emitted directly out of the hemisphere curved front of the IR LED. The Phototransistor is the black device just to the right of the thumb in the image. It is sensitive only directly in front of the hemisphere curved surface. The black color is caused by a filter in the plastic body of the phototransistor which blocks visible light. Also shown is a typical pressure waveform.
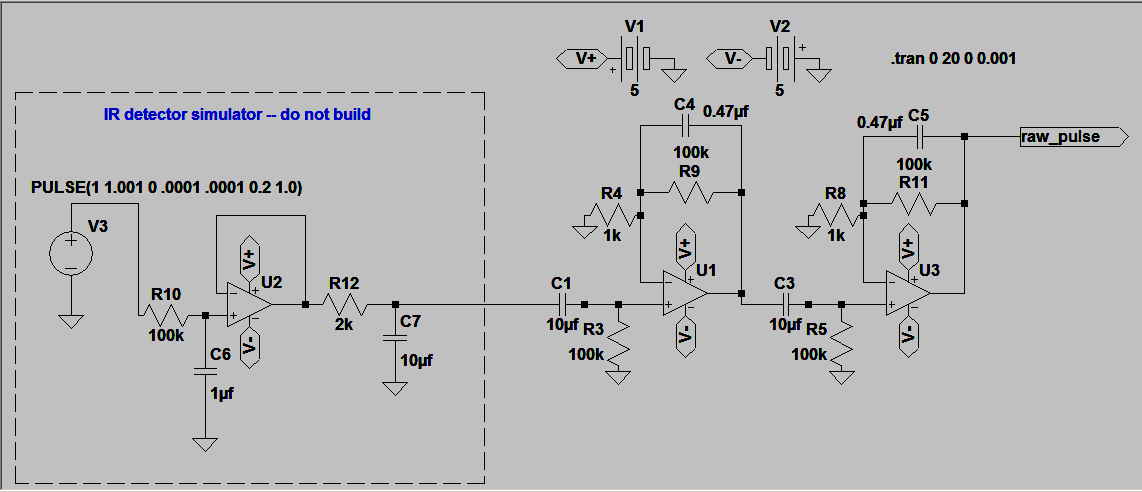
Simulate the following circuit, but note that it is different than the one you will build (see below) because the sensor has to be faked in. Vary R3 and R5. If the resistors are too small the waveform may be distorted. Vary C4 and C5. If they are too big, the waveform will be attenuated and distorted.
Assignment: