Introduction
"Sweep your hand and watch things bend!"
project soundbyte
In this project, ultrasound around 24kHz was used to detect movement near an object. Waving a hand or other solid object near the source of the ultrasound (speaker) causes a shift in the frequency of the sound, which is then detected by a microphone. We detected characteristic shifts in frequency to determine whether motion was towards (push) or away from (pull) the microphone. Two modes of visual indication were used to display the results of the motion detection: blinking LEDs and a computer display. With the blinking LEDs, a different color LED would light up according to the direction of motion detected. In the computer animation, the waveform would be displayed on screen along with markings of which parts are pulls and pushes. Sections of the waveform that represent different motions would be marked as push or pull.
We chose this project because we were inspired by Microsoft's Sound Wave, which detected shifts in frequency using the Fast Fourier Transform, and used it to perform actions such as scrolling on a computer screen. We were interested in the effects of motion on the frequency produced by a speaker and detected by a microphone. We thought the project could be useful in situations where visible light-based detection fails. For example, in a completely dark room, changes in ambient light cannot be used to detect changes in motion. This detection system is also useful in that it allows detection of motion without having the system get used a certain ambient level. For example, in infrared-based detection, the system has to first get used to certain ambient level of infrared radiation. Any change from that level will then trigger the detection. In ultrasound, we make detections purely on motion and so no ambient level is necessary.
We were able to successfully complete two different detection algorithms and are pleased with our achievements.
High Level Design
Logical Structure
Like the system designed by Gupta, Morris, Patel and Tan at Microsoft Research, our system also relies on the doppler frequency shift in a reflected sound wave for gesture recognition. This design works as follows. Firstly, sound is produced by feeding a periodic square wave through a piezoelectric transducer at a frequency that is above the audible range of humans. When the user moves, these sound waves are frequency-shifted because of the doppler effect. These sound waves are then picked up by the microphone in our hardware set-up. The hardware compares the incoming signal from the microphone with the one issued through the piezoelectric transducer; frequency changes are calculated in the analog domain in the hardware. The calculated frequency changes are then sampled by the Analog-to-Digital-Converter (ADC) of the microcontroller. Based on sampled data, the microcontroller interprets the voltage level changes to determine what action the user had performed, and reports these actions as either a push or a pull. Two settings are provided:
- A real-time action recognition mode where the microcontroller attempts to determine and report user actions
- A delayed action recognition mode where the user is given a period of approximately 5 s to perform actions; the microcontroller records all data and then proceeds to identify actions based on the data and reports back to the user
Rationale
Why did we choose to compare incoming and outgoing (from the point of view of the microcontroller) signals in hardware rather than calculating the Fast Fourier Transform (FFT) and finding amplitudes as carried out by the researchers that inspired this project? FFT is a computationally-intensive process that the microcontroller is unlikely to be able to process while sampling the the incoming signal at a constant high frequency. Since we wanted to generate a sound that is inaudible to humans, it has to be high-pitched, at least above 20 kHz. To sample this high frequency, the Nyquist sampling theorem suggests that we would have to sample at at least 40 kHz in order for the original signal to be reconstructable. The microcontroller's processor clock runs at 16 MHz and 40 kHz would be possible to sample; the 16 MHz processor could probably perform the FFT on samples. However, the microprocessor would not be able to both sample and compute the FFT efficiently. We therefore had to do manipulate some part of the signal in hardware so that both sampling and computation could be done effectively on the microcontroller.
The research that inspired this project worked on the computer, which has a much higher processing power than the microcontroller, and hence they were able to perform a lot of the calculations on software instead of hardware. Using hardware to manipulate data makes this system much more difficult to tune. However, manipulation in the analog domain, as we learnt in this project, is both fast and powerful, and presents an interesting alternative for future development.
Background Math
The crux of the hardware manipulation is in the multiplier unit. We really appreciate this suggestion from Professor Land! The usage of the multiplier is based on the following equation, which indicates that the product of two sine waves produces two phase-shifted sine waves, one with a frequency that is the difference in frequencies between that of the two input waves, and the other with a frequency that is the sum of the two input waves:

We exploit this magical yet fundamental property of sine waves to find the difference in frequency between incoming and outgoing signals in hardware. Initially, we predicted that the frequency shift in the incoming sound wave from that of the outgoing sound wave is going to be on the order of 500 Hz, assuming that the user's hand can move at a speed of 10 m/s. (This was later found to be an unreasonably high frequency shift to expect.) When we did out preliminary calculations, we set the outgoing signal to be at a frequency of 24 kHz. This meant that the incoming frequency, if the user were moving away, would be about 23500 Hz. If the incoming and outgoing signals were multiplied, the frequency difference (fa-fb) would be 500 Hz, which we want to sample, and the sum (fa+fb) would be 47500 Hz, and is easily filtered away using a low-pass filter. Since the frequencies are so different, the low-pass filter would not be too difficult to tune.
In addition, the low frequency signal of about 500 Hz (at most) would be easy to sample, because it would only have to be sampled at a low frequency of 1 kHz to be reconstructable.
Hardware/Software Tradeoffs
In this project, at many points we had to make the decision of whether to process data in hardware, or in software. Some decisions were clear, such as whether to use FFT in software, or the multiplier in hardware - the microcontroller would not have been fast enough. Other decisions were not so clear.
For example, the input signal was often noisy. We could have used a low-pass filter in hardware, or used a running-average filter in software to remove the noise. In another situation, the output signal had a DC offset that changed according to the environment. If the hardware was placed in an open area, the DC offset would be lower, and if the hardware was placed under something that reflected most of the sound back to the microphone, the DC offset would be higher. We could use a blocking capacitor in hardware and then add another section in the circuit to pin the middle voltage of the input signal to 2.5 V before it is sampled by the ADC, or used a long-term averager in software to determine the average level.
In the first case, we chose to implement the low-pass filter in hardware because the noise would have obscured most of the signal that we wanted to capture. The running-average filter in software is inferior in this case mainly because without using floating-point arithmetic, the filter would be rather inaccurate, and if we had used floating-point arithmetic on that many samples, the microcontroller may not sample quickly enough. In hardware, the low-pass filter quickly and accurately removes high frequency signals, and presents the ADC with a cleaner signal that is more easily interpreted in software.
In the second case, we also used hardware to shift the middle of the signal. An average in software, if taken over a short period of time, would be affected drastically by the signals that we wanted to capture. If we wanted to take an accurate long-term average, it would not only require a lot of memory, but will also take a long time to react if the system was suddenly shifted and had to adapt to new conditions. By using hardware to shift the DC level of the middle of the signal, we could get fast shifting under changing conditions, without paying in memory.
Standards
We used the UART standard in communications between the microcontroller and the computer, for display purposes.
Patents, Copyrights, Trademarks
We acknowledge the inspiration from the Microsoft SoundWave project for their idea in using the Doppler Effect to sense motion. The core of their gesture-detection system lay in the FFT, which allowed them to compare frequency shifts. We compared frequency shifts using a multiplier unit instead of using FFTs. No infringement of their copyright is intended.
Numerous patents exist for the use of light for motion sensing but these are not that closely related, since our project relies on sound rather than light for motion detection. Patents exits for ultrasound motion detection system, such as patent number 4604735 granted to Natan E. Parsons for a ultrasonic motion detection system that is applied on faucets. Ultrasonic Doppler-based sensing has also been done before on blood-flow, by Donald Baker. This was presented in a paper in IEEE Transactions on Sonics and Ultrasonics in July 1970.
A Google scholar search on the terms "ultrasonic gesture doppler" returns several previous works on the use of ultrasound and the doppler effect for gesture sensing. However, none of these works were referenced in the course of the project. The use of the multiplier to discriminate frequencies and detect motion, as well as the use of the saturating counter and a simple majority in the decision making process for detecting pushes and pulls based on amplitudes detected, is novel to be best of our knowledge at the point of writing.
No copyright infringement is intended in the execution of this project
Hardware
The block diagram of our implementation is shown in the following image:
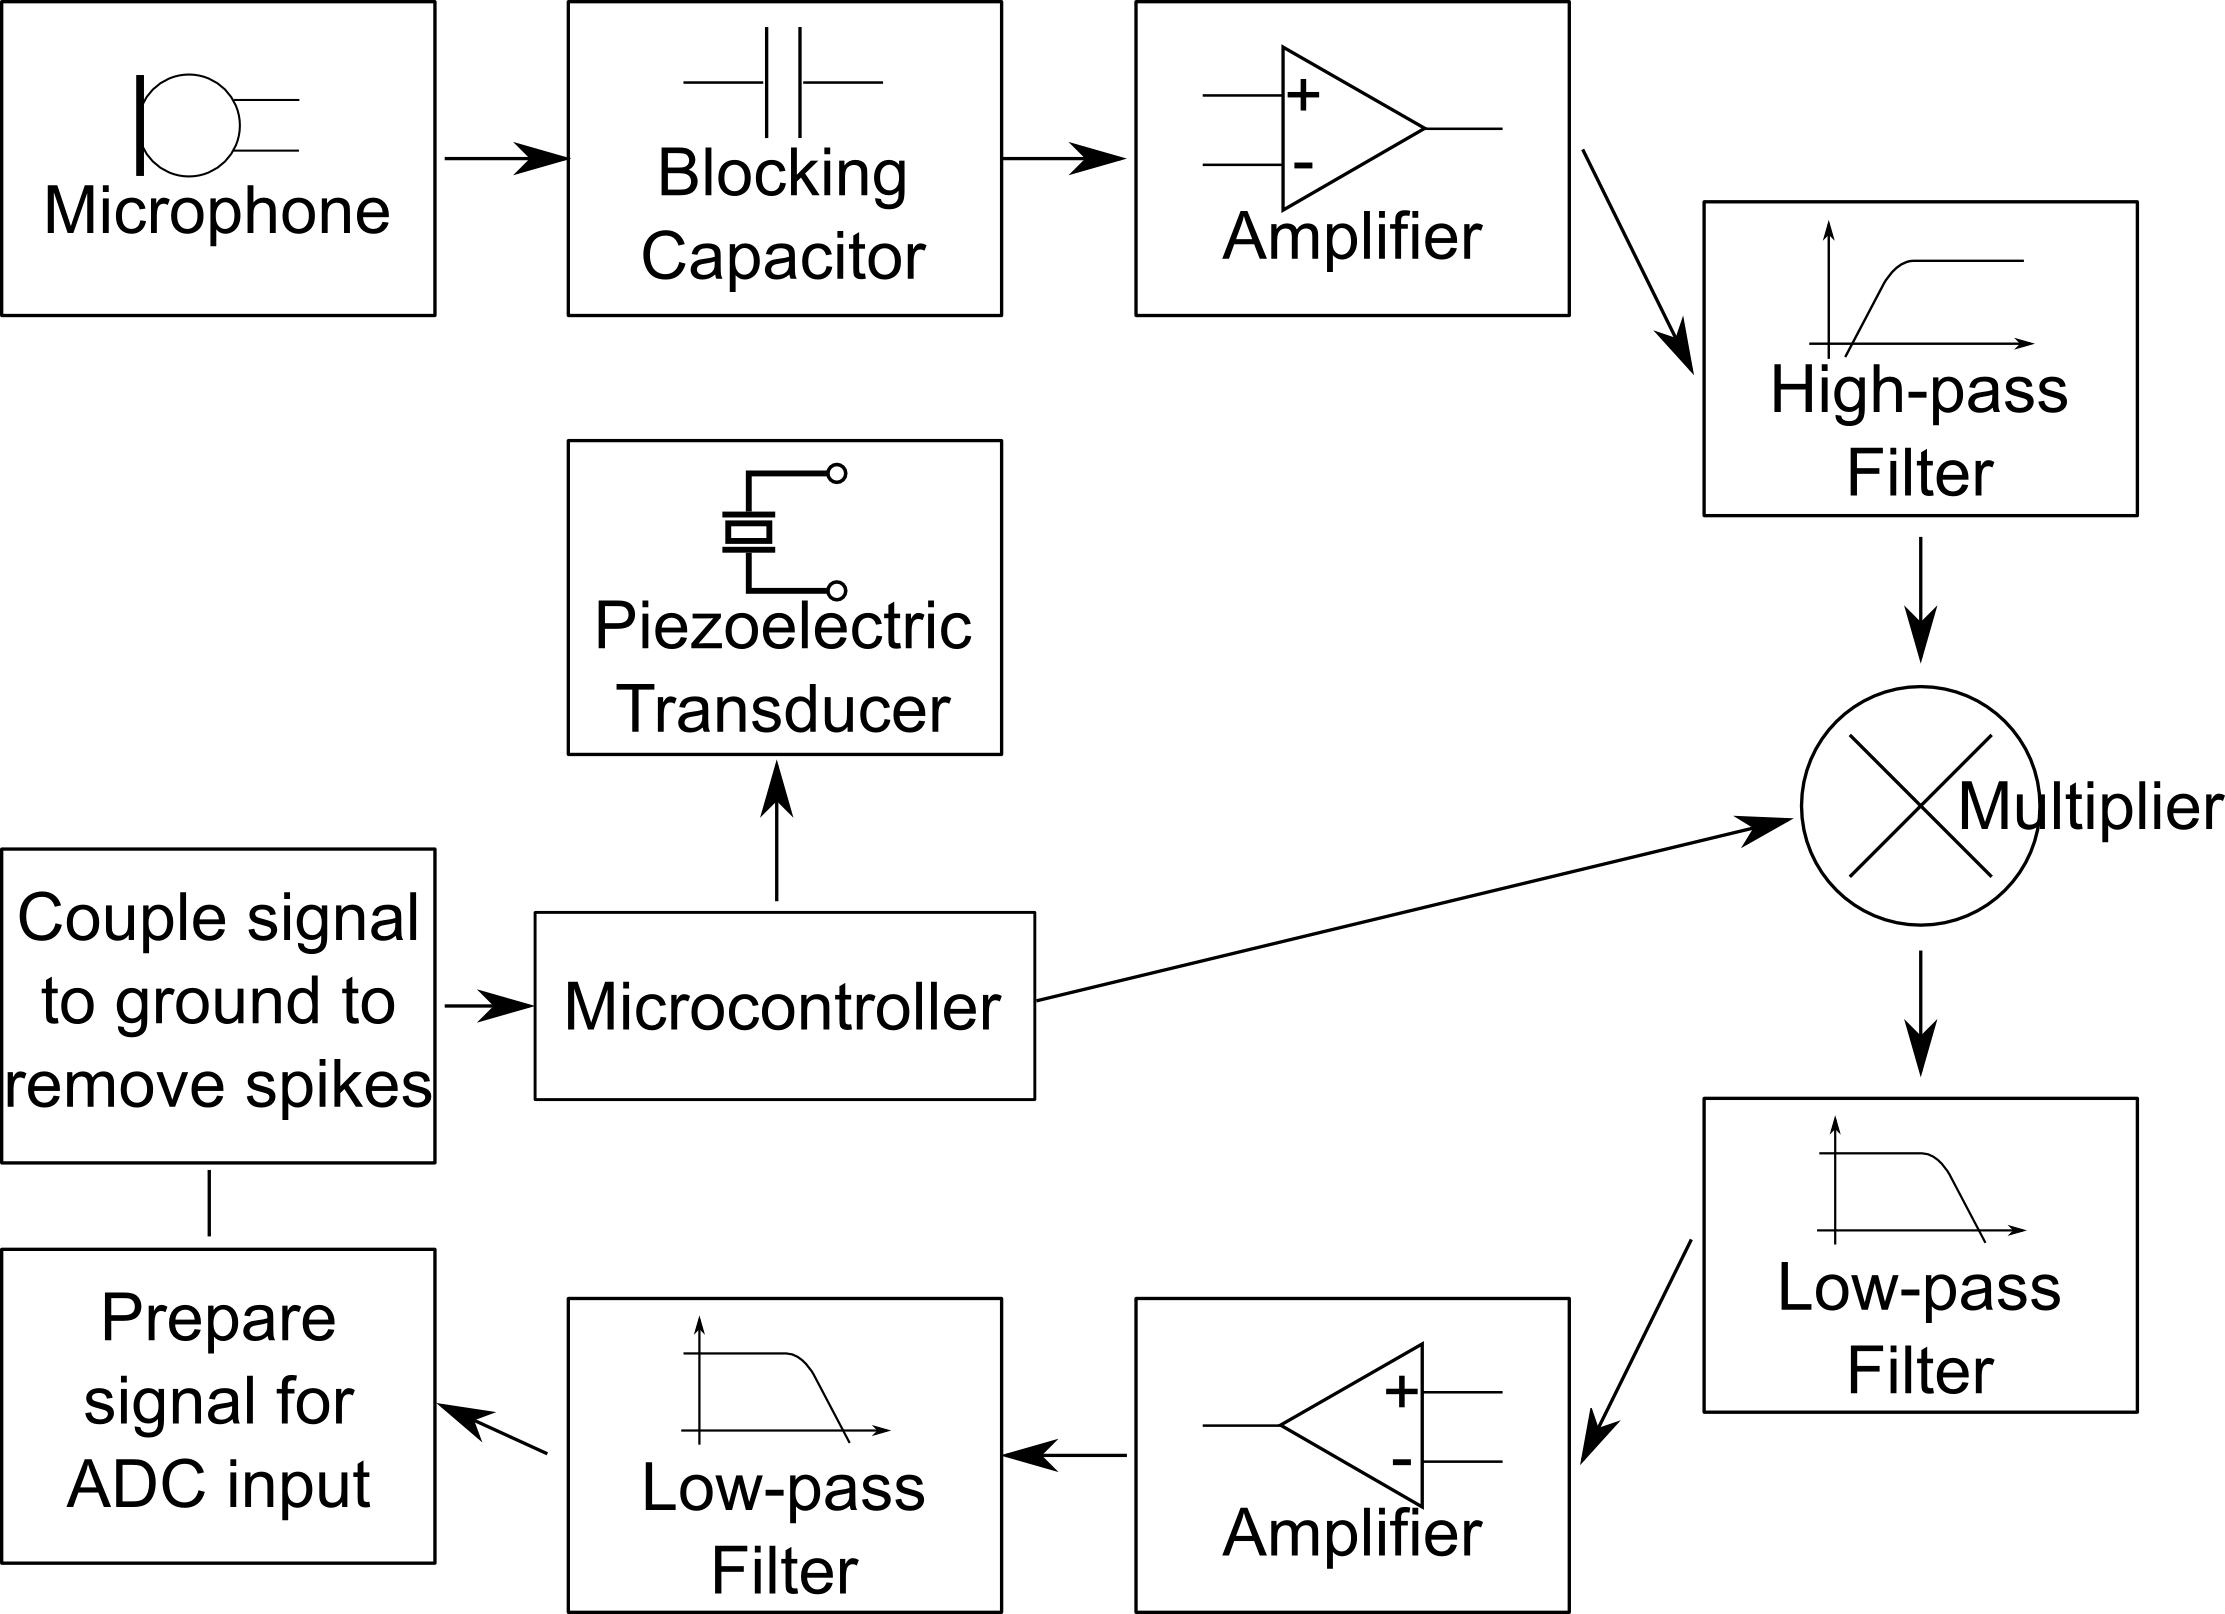
Block diagram for hardware implementation
Microcontroller
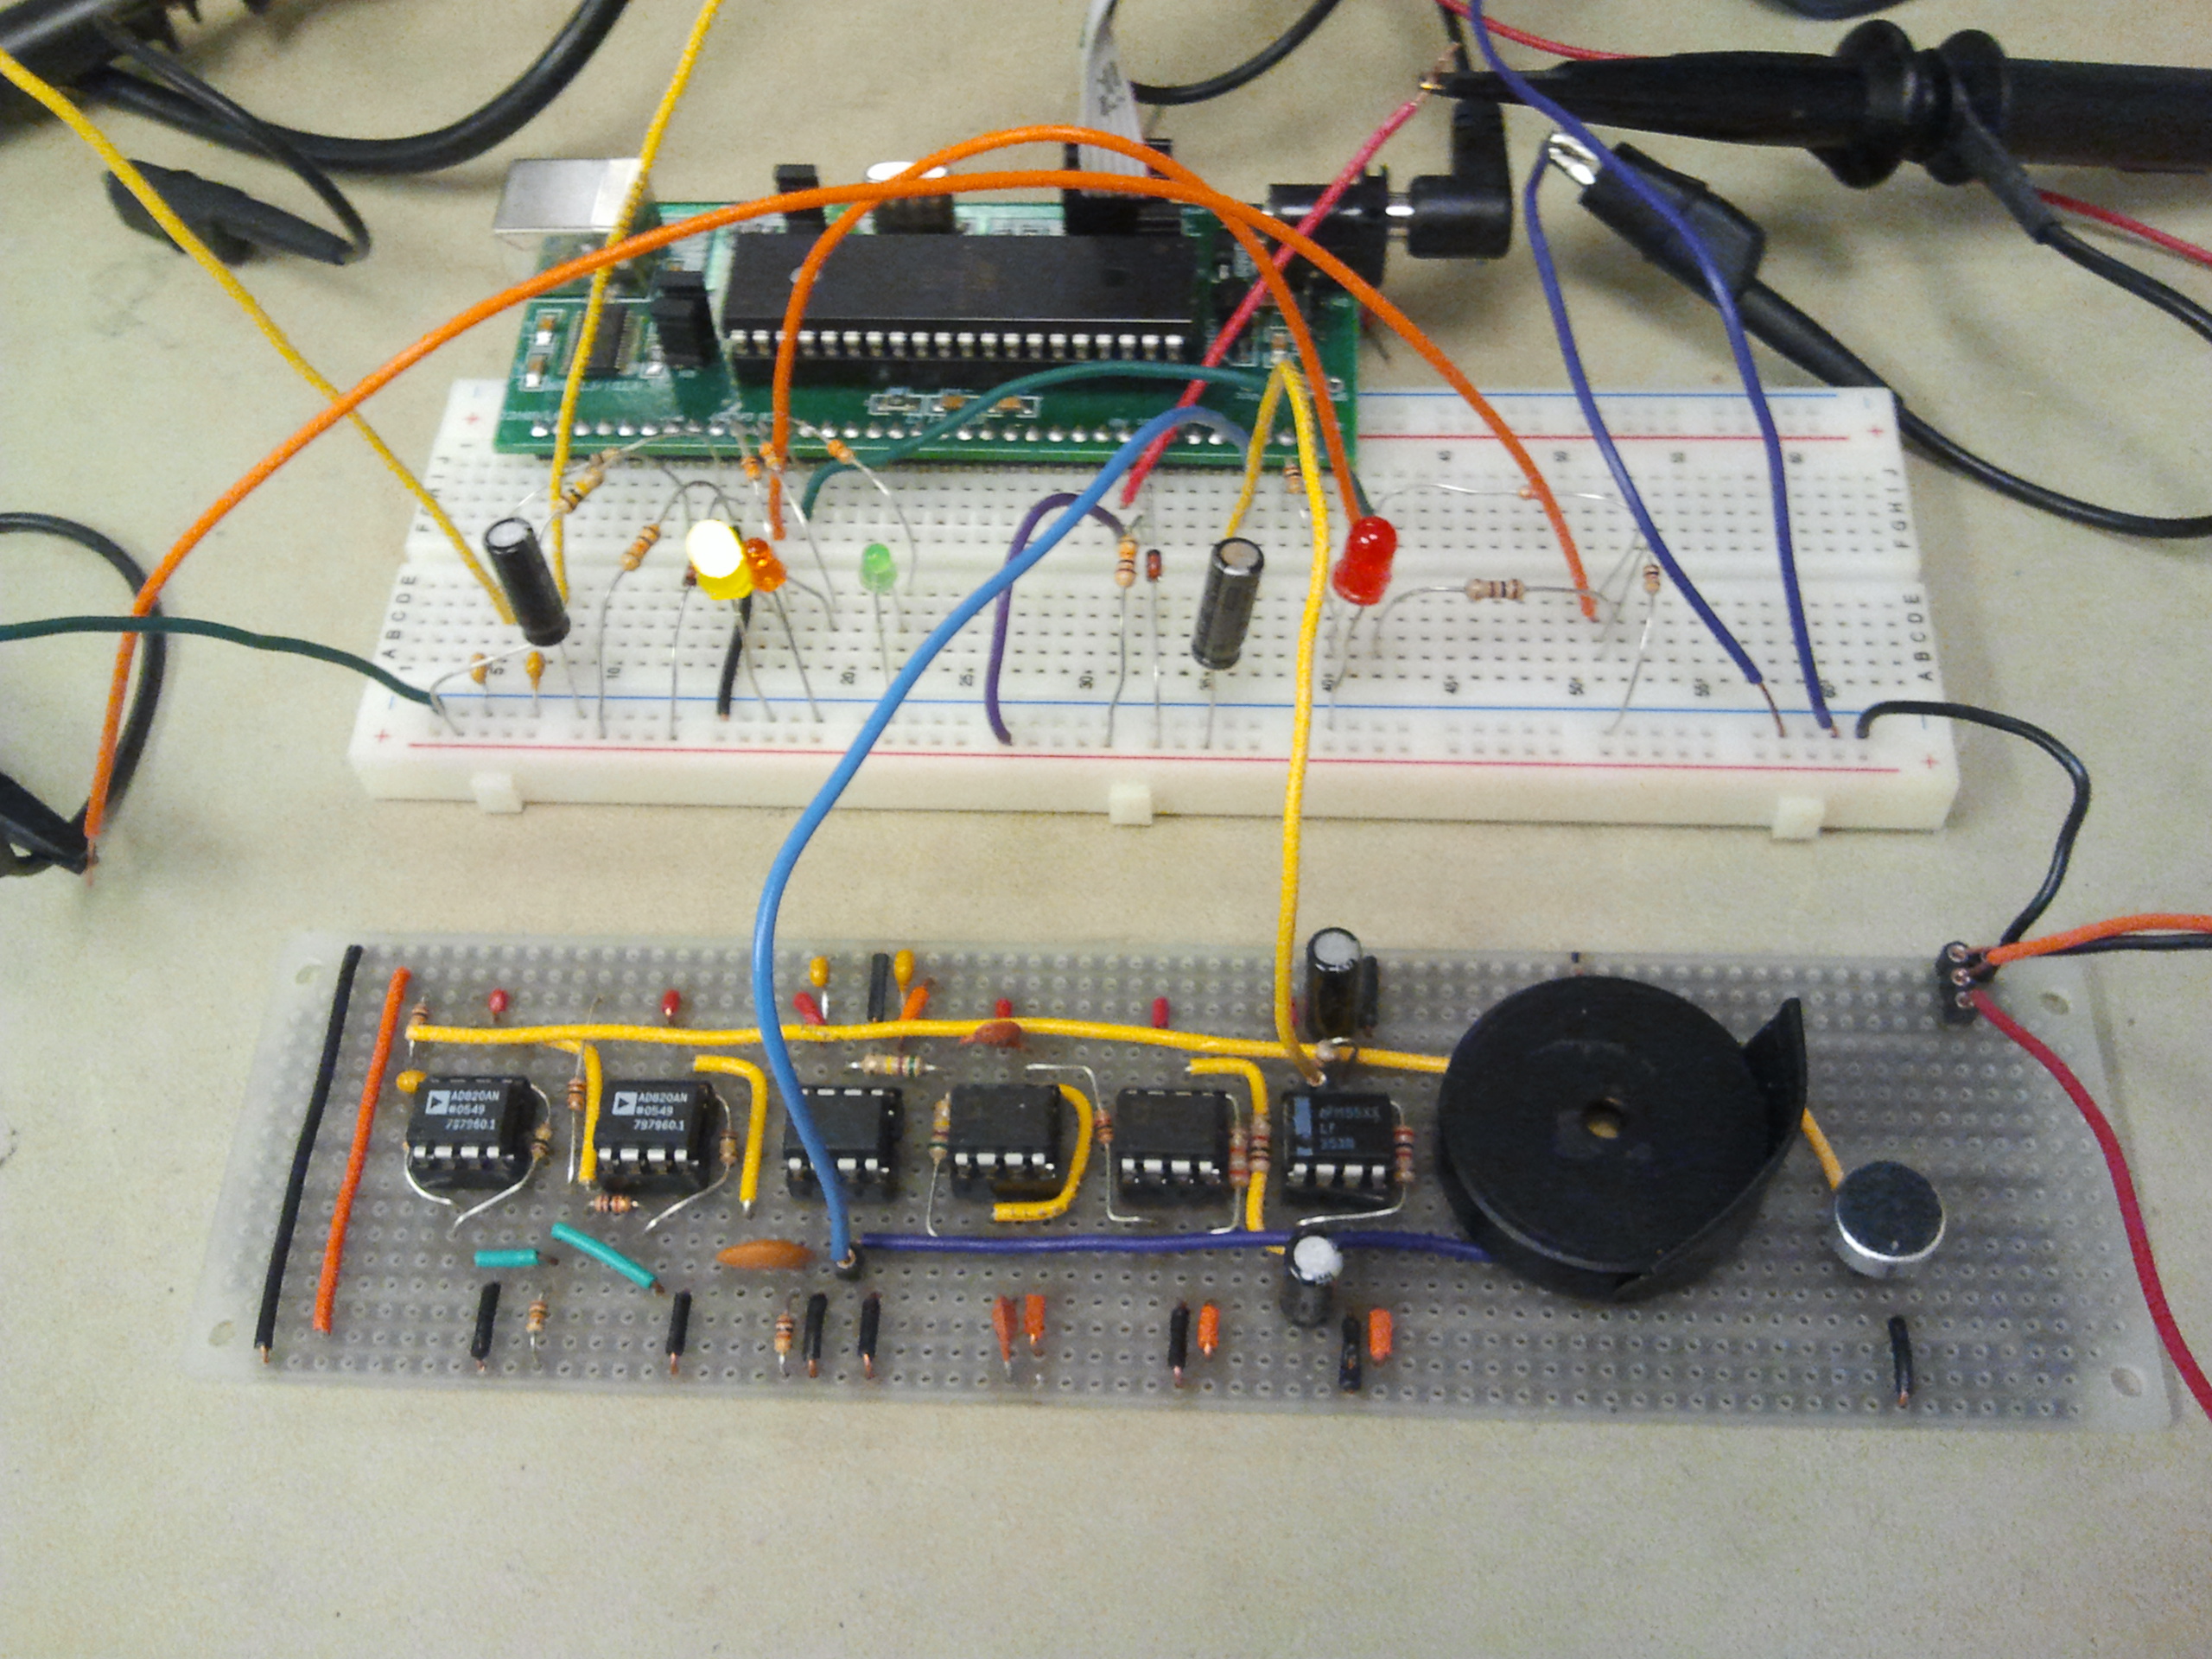
The microcontroller used was the Atmel 1284p microprocessor. The microprocessor is mounted on a printed ciruit board that was issued to us at the beginning of the semester. The printed circuit board gave us easy access to all 32 pins of the microprocessor. The printed circuit board was not rebuilt due to lack of time, also, use of the issued circuit board made debugging much easier. The printed circuit board also had a USB connector, which provides us easy access to terminal output through UART.
Microphone
The microphone used was a normal microphone for the auditory range. It was purchased for DigiKey.com and had the model number CMA-4544PF-W. It was chosen because the price was within budget. We were initially not sure if the microphone would be able to receive sound at frequencies above the auditory range, but we took the risk and tried things out. We first tested this out by putting a sine wave through the piezoelectric transducer, and testing the response at various frequencies above our hearing range. Above 20 kHz, 24 kHz seemed to have a good response and we chose to use that frequency.
Blocking Capacitor
The blocking capacitor was used after the microphone to cut out the DC offset of the microphone bias, so that the higher frequency signal would pass through.
Amplifiers
Amplifier circuits were used in two places in our hardware to amplify the signal that we were trying to isolate.
Initially, the rails of the amplifiers we used were set at +5 and -5 V. One thing that we learnt about this configuration was that our voices and other background noises such as tapping on the table were amplified so much that the the signal reached the rails. Because it reached the rails, the frequency of those signals were removed and became zero. Since those frequencies were removed, they were not passed to the later hardware stages and hence was not sampled into the microphone. This is an interesting way of filtering out speech and other noise from our signal.
However, the tradeoff was that the eventual signal was very small, which made the signal-to-noise ratio very low. Since we wanted to have a large signal-to-noise ratio, we decided to raise the rails to the +12 and -12V in our eventual implementation and chose to remove any residual noise using filters.
High-pass filter
The high pass filter before the multiplier was used to cut out the lower frequency signals, which must have been noise. We were expecting the incoming signals' frequencies to vary between about 23 kHz and 25 kHz at most, and so none of the lower frequency signals would have been useful. Hence, cutting these signals out before the multiplier makes sense.
Multiplier
This is the core unit in our hardware maniplation. As described above in the section on Background Math, we used the multiplier to calculate the difference and sum between the incoming and outgoing frequencies. The multiplier has the model number AD633 and was also purchased from DigiKey.com. This multiplier was found to be very reliable and use was almost just plug-and-play.
Low Pass Filter
This low pass filter after the multiplier forms part of the core in the signal manipulation path. The purpose of this low-pass filter is to remove the high frequency sum frequency of incoming and outgoing signals, thus leaving only the low-frequency difference frequency of the incoming and outgoing signals. This difference in frequency is exactly the Doppler shift that we were looking for.
This difference between frequencies tells us only the magnitude of the shift, and not the direction of the frequency shift. However, from the waveforms sampled, we noticed characteristics in the amplitudes that correspond directly to either a push or pull motion. These characteristics are exploited to determine either a push or a pull, and is further explained in the Software section. Initially, we wanted to further add a pair of filters, one with a passband peaking at about 23500 Hz and the other with a passband peaking at about 24500 Hz. By comparing the amplitudes of the signals passed by both of these filters, we would be able to tell which way the frequency shifted and therefore the direction of the motion. Eventually, this was not implemented since it seemed sufficient to make decisions based on the amplitudes. This can be implemented in future if we have more time to improve on the project and accuracy of detection.
Second Low-pass Filter
This low-pass filter was added because we noticed that after the second amplifier, voice and surrounding noise was still being passed through as very high frequency noise. These high frequencies were effectively cut out with the addition of this low-pass filter, resulting in a much cleaner signal.
Unit to prepare signal for ADC input
We noticed that the DC offset level of the signal at the point after the second low-pass filter was changing with the surrounding environment. Because the ADC required the signal to center around a fixed voltage for accurate detection, we had to find a way to hold the DC offset constant regardless of environment. This unit was added to pin the DC offset level of the signal at 2.5 V, which is the middle point for the microcontroller's ADC to sample.
Capacitor coupling to ground
At this point in the signal path after the signal was prepared for ADC input, we noticed spikes appearing in the signal. These high frequency spikes seemed to be coming from the microcontroller, because when we measured the signal when disconnected from the microcontroller, the spikes disappeared. To remove these spikes for a cleaner signal, we added a capacitor coupling to ground.
Software
Characteristics in Waveforms of Different Gestures
Each motion (push or pull) exhibited specific characteristics in the resulting waveform that made them distinguishable from one another. In general, they exhibited two traits that were useful in the rest of our program:
- Difference in frequency: a push or pull would result in a shift in frequency
- Difference in amplitude: a push or pull would increase or decrease the signal amplitude
NONE
The term "none" describes having neither a push nor pull gesture. The signal detected is nearly constant, meaning it has very little frequency or amplitude variation. An example of a waveform when no gesture is occurring is shown below:
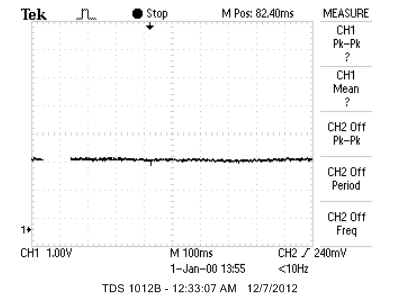
Waveform When There is No Gesture
PUSH
We defined a "push" as a gesture (such as by a hand) towards the microphone that detected the sound produced by the piezoelectric transducer. Since our transducer was mounted in the same plane as the microphone, the push gesture would be towards them both. An example of the waveform that resulted from a push is shown below:
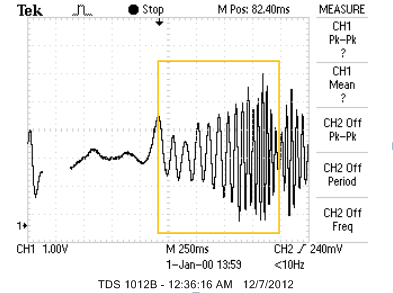
Waveform Resulting from a Push
The waveform resulting from a push is in the right-most half of the waveform shown, marked with a yellow box. The push shows specific characteristics in the frequency and amplitude of the signal. More specifically, a push increases both frequency and amplitude of the signal from the level at which no gesture is performed.
PULL
We defined a "pull" gesture as moving away from the microphone and the transducer used to produce the ultrasound. An example of the waveform resulting from a pull is shown below:
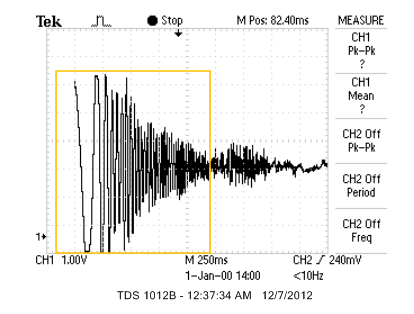
Waveform Resulting from a Pull
The waveform resulting from a pull is shown in the left-most half of the waveform above. The frequency and amplitude characteristics are representative of all pull gestures. The frequency decreases during the pull, but is at an increased level from no gesture. In addition, the amplitude of the signal decreases during the duration of the pull.
LED Blinking Mode
This mode operated our program in a live detection mode for gesture detection. This required an algorithm that would use a set of constantly-changing sound samples to determine whether there is currently a gesture (pull, push, or none). Each gesture has a corresponding LED that will light immediately once the gesture has been detected. The LEDs were lit by outputting a logical level of 1 to a port pin. No gesture (none) corresponded to a yellow LED, a push gesture corresponded to an orange LED, and a pull gesture corresponded to a green LED.
Algorithm for Live Detection
To detect the gesture in real-time, we needed to analyze a constantly changing set of sound waves that were detected. We modeled the algorithm in a state machine to break up the task into specific steps. The entire state machine we used in our code is shown below.
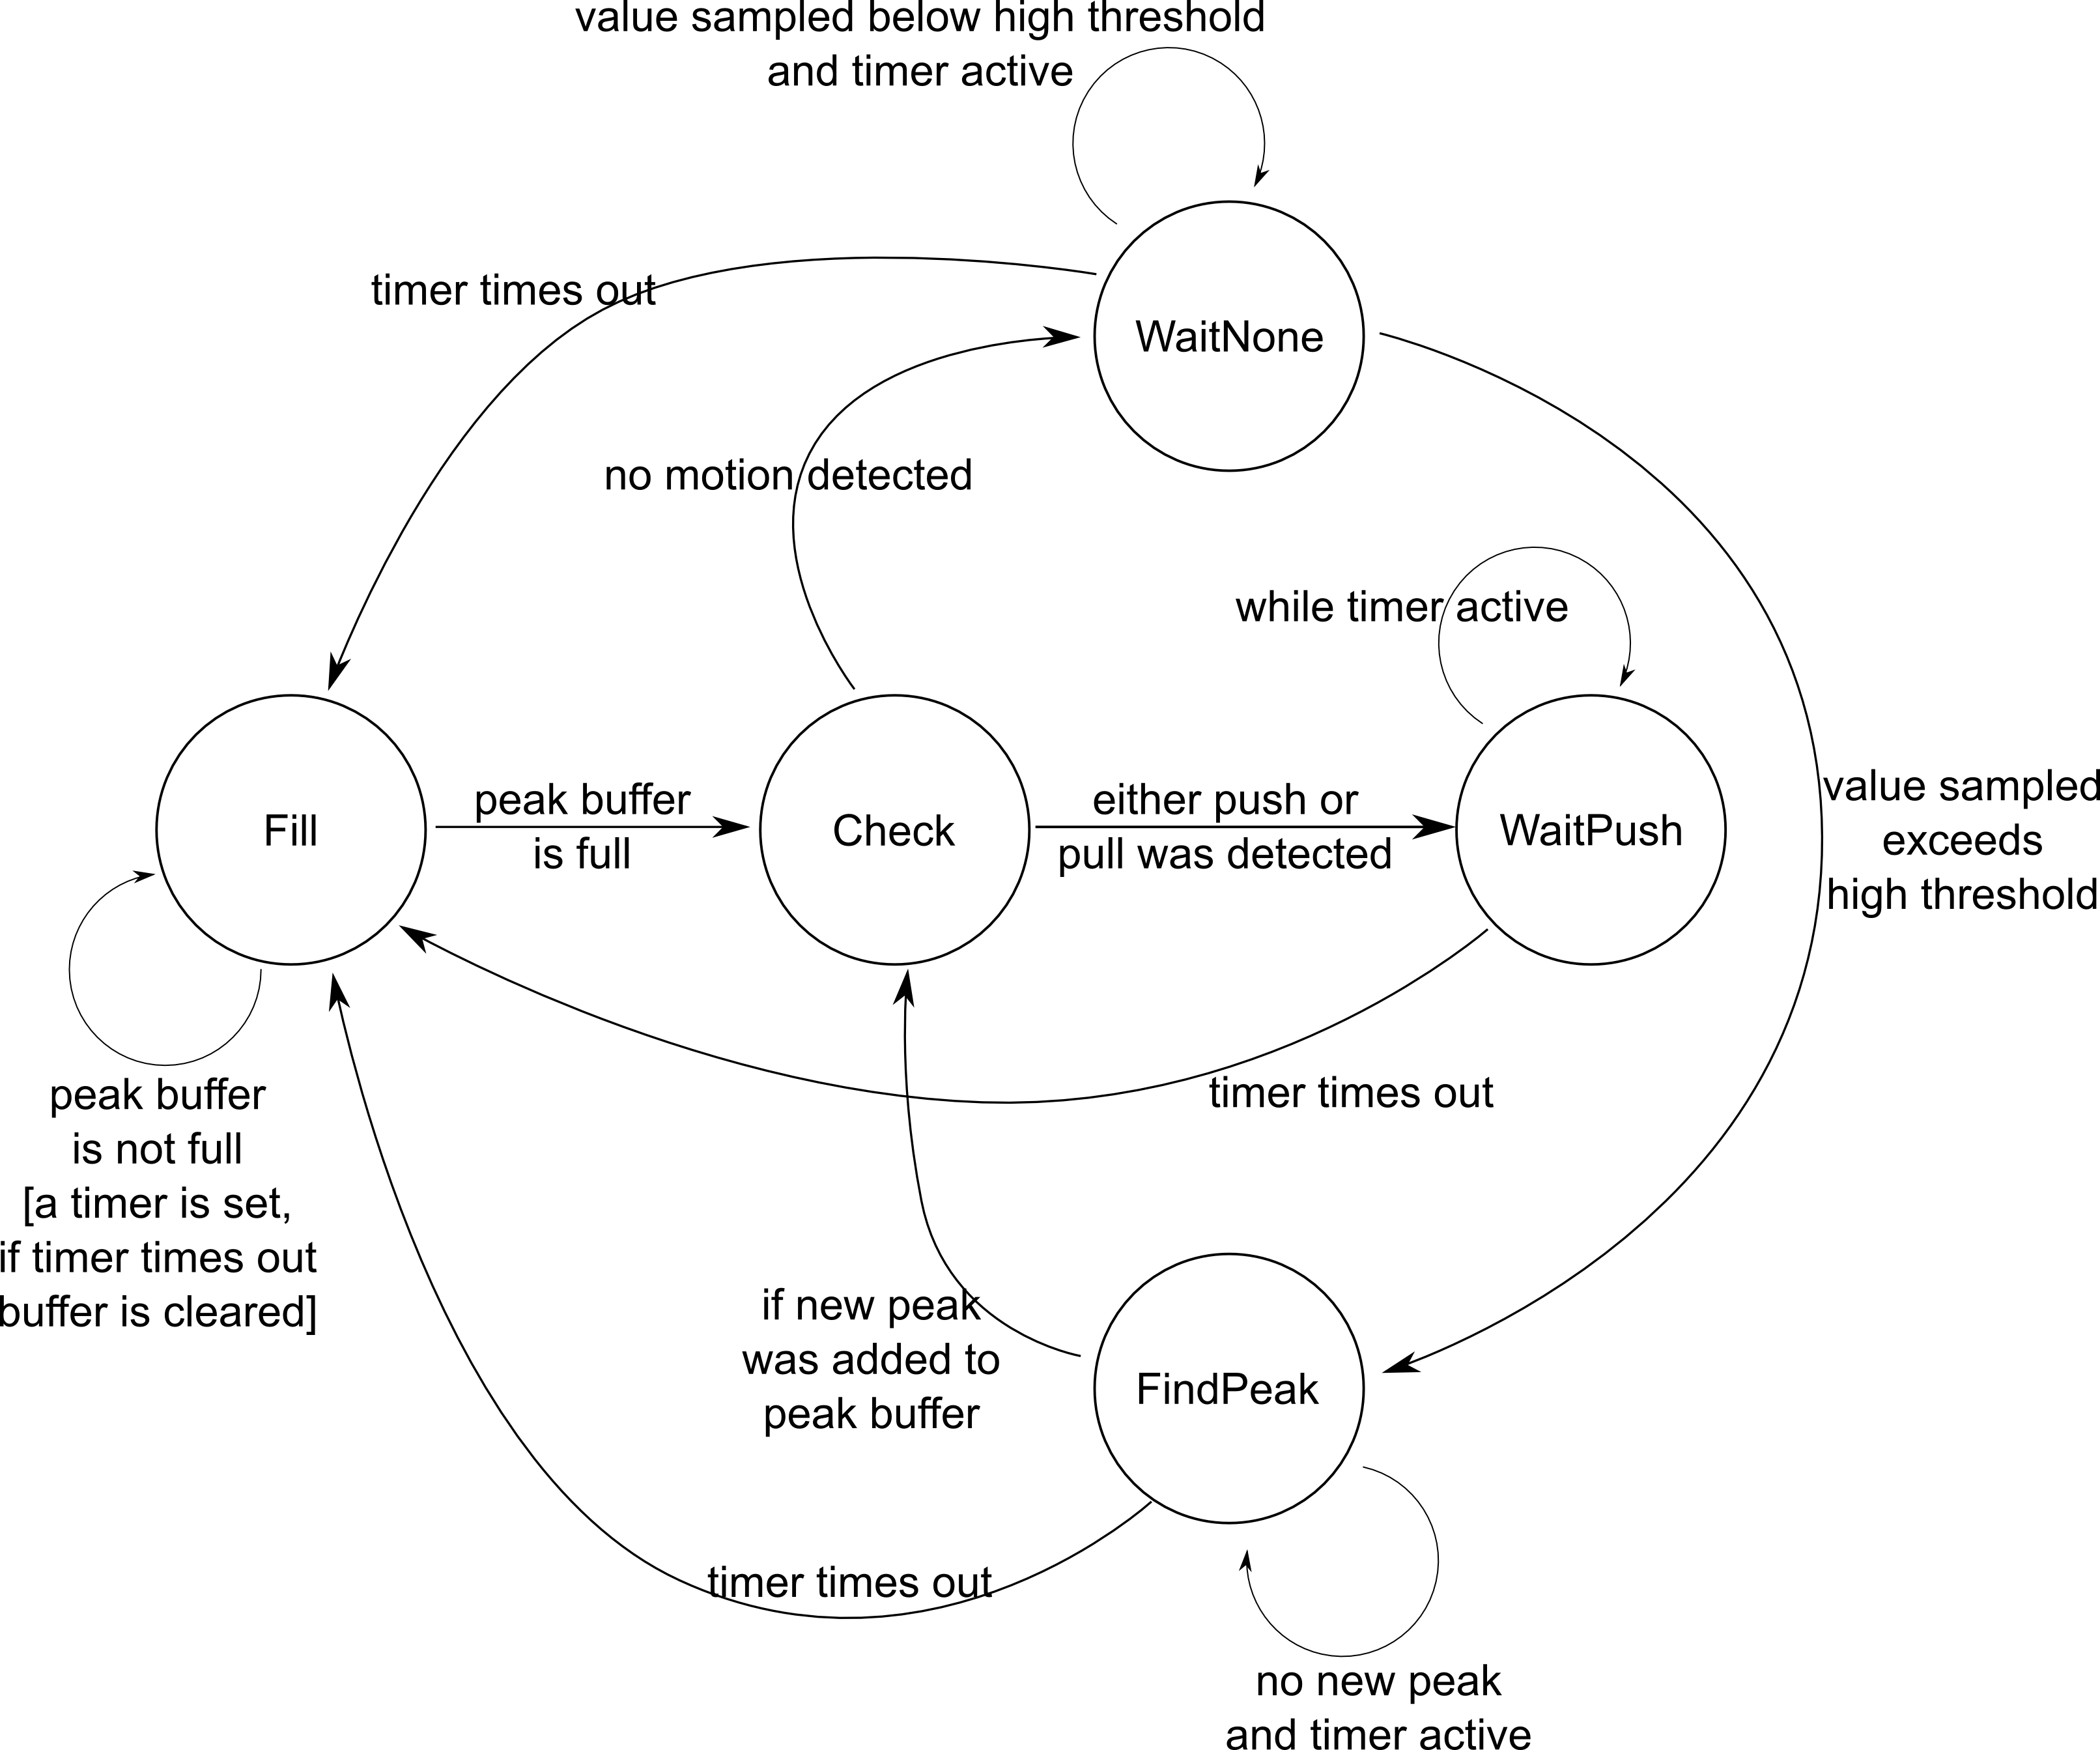
State Machine for Live Gesture Detection
The initial state is Fill, where the peaks in the ADC samples fill the buffer until it is full. We used local highs that were above a high threshold (which we set) in the ADC sampling as our peaks. After the buffer was full, there were enough samples to do gesture detection accurately, so we transitioned to the Check state. The Check state is where the local highs recorded in the buffer were analyzed to determine whether there was a gesture (push or pull).
The analysis of the local highs was done using a simple majority. Iterating through the buffer, we would count the number of peaks that dropped from the previous peak, as well as the number of peaks that increased from the previous peak. Whichever count was greater was the resulting decision made by the Check state. This is very much like the majority-rule voting present in many computer science algorithms.\
The Check state would transition to WaitPush if either a push or pull was detected, but it would transition to WaitNone if neither was detected. Two states were necessary because we wanted to introduce a delay in the next detection if a gesture had been detected. The delay would prevent fast oscillations between two different LEDs that would appear as if two different gestures were detected in fast succession. Without a delay, the state machine could make hundreds of rounds in the time it took to execute one slow gesture. Thus, the state machine could possibly predict the same gesture many times in a row. However, because our algorithm is not foolproof, mistakes would toggle a different LED, making the output seem very erratic. The delay adds stability to the gesture detection, which was one of our biggest struggles when designing the algorithm.
The difference between FindPeak and Fill is that Fill will completely refill the buffer from array position 0, where FindPeak only finds one local peak before it transitions. The difference in the two states made our algorithm predict more accurately, because the buffer will not need to be completely refilled even if no gesture was detected. Thus, the next detection would occur sooner if only one peak was needed before a detection. On the other hand, the buffer should be refilled if a gesture was detected, so the same gesture is not detected using the same points multiple times.
Finally, a timer was introduced to allow states to time out. This was another one of our challenges in the software section, because without a timeout, the algorithm could potentially stay in a state (such as FindPeak) forever; if there were no peaks to be detected, the gesture should be None. Having a timer ensured that if the next peak does not occur within a certain time after the current peak, there would be a transition back to the Fill state. As expected, no gesture would be detected in this state, which matches the expected outcome when there are no peaks or the peaks are extremely far apart (very low frequency).
Record & Playback Mode
Our program could be run in this Record & Playback mode, which was one way of presenting the results of our gesture sensing. This mode operated in a two-step process of capturing a set of sound data and then analyzing it:
- Recording a Waveform
- Analyzing the Waveform
In the first step, the analog-to-digital converter (ADC) would be sampled every 1 msec to obtain a regular reading of the sound wave. During this sampling, a red LED would be lit to indicate that the microcontroller is recording. Then, after the red LED turned off, the microcontroller would use an algorithm for detecting the different gestures (push, pull, or none) and output the results to a computer screen through UART. The results would indicate which gestures were detected at which point during the recording period.
Recording a Waveform
The first step in this Record & Playback mode of operation was recording a sample waveform on which to perform gesture sensing. The ADC was initialized and sampled every 1 msec, and the samples were saved in an array called "recordings." The program was configured to take a certain number of samples, and when that number had been reached, the recording stopped. We found 5000 samples to work well, since it was a large sample without occupying all the RAM on the microcontroller. The 5000 samples were taken in 5 seconds.
Analyzing the Waveform
The next step in the Record & Playback mode of operation was analyzing the waveform sample that was obtained from Step 1, "Recording a Waveform." The analysis would need to determine which gestures occurred at which points during the recording, and how long the gesture lasted. This information would be output from the microcontroller to a computer screen through UART. Thus, after running our gesture detection in the waveform capture mode of operation, the user would be able to see the entire waveform on the screen, marked with sections of pushing, pulling, or no gesture. To perform the analysis, we created an algorithm for matching sections of the waveform to their most likely gesture; more details are in the "Algorithm for Analyzing Recorded Waveform" section.
Algorithm for Analyzing Recorded Waveform
After recording the waveform from the recording stage, we needed a way to segment the waveform and determine which motion occurred. Thus, we created an algorithm to step through the waveform samples one-by-one, and determine which motion most likely occurred. The method is not foolproof, so it does not detect with 100% accuracy. However, it utilizes many characteristics of the push and pull waveforms as described in the "Characteristics in Waveforms of Different Gestures" section.
The algorithm first detects sections of the recorded waveform with high frequency. This is determined by the frequency of zero-crossings, where "zero" is defined as halfway between high and low. Since we used 8 bits from the 10-bit on-chip ADC, our zero level was at:
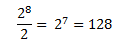
Zero on the ADC
We used a sample threshold to determine what comprises a high frequency versus a low frequency. More specifically, we set a threshold of the maximum number of samples there can be between zero crossings. Since the samples occurred in approximately equal time steps, we know that the number of samples can also be interpreted as a time. Thus, if we set the threshold to 30 samples, the time between zero crossings must be at most 30 msec. This allowed us to disregard parts of the waveform that occurred at lower frequencies, since they would not define a gesture.
Areas of high frequency were then concentrated into subsets of data called blocks. Because any of the gestures (push or pull) could be in the block, the block had to be broken up into subsections of different gestures. Thus, each block was individually traversed to find the borders between pushes and pulls. We used peak detection, which defined any oscillation above 240 units on the 8-bit ADC, to create a border between the gestures. In addition, the block boundaries were used as gesture borders as well. In the picture below, 10000 samples were obtained over 10 seconds of push/pull gestures. The horizontal red line is drawn at the ADC zero value (128 units), and the two vertical red lines are the beginning and end of a block.
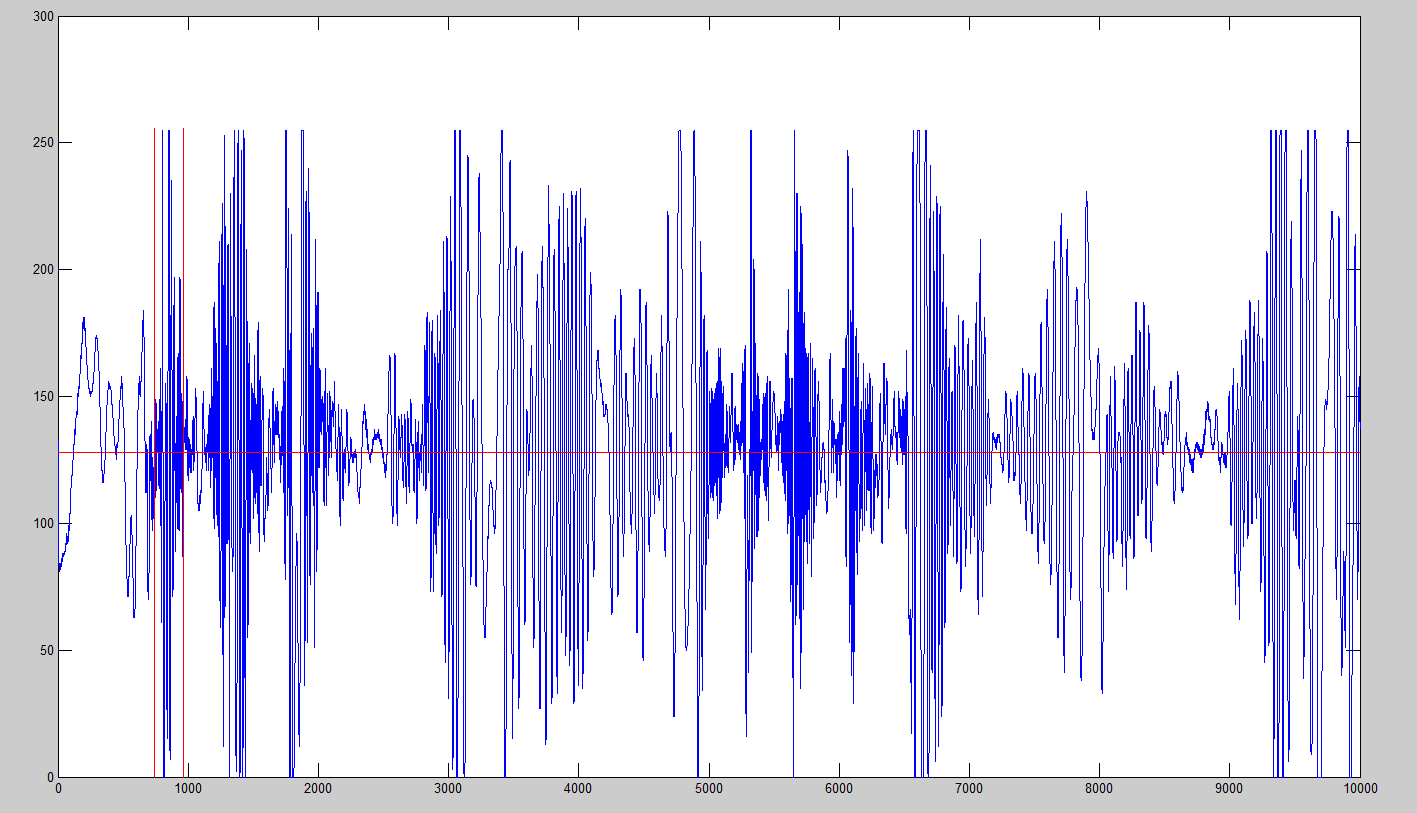
A Block in the Sampled Waveform
So far, frequency had been used to determine where the gestures are occurring in the waveform, but amplitude of the signal had not. We also used the amplitude to determine whether the gesture was a push or a pull. In general, if the peaks of the waveform are increasing, it means the hand is getting closer to the microphone, resulting in a push gesture. The opposite is true for a pull. In the plot shown of the waveform, there is one push and one pull, in that order, between the two vertical red lines (block).
One of our biggest challenges with software was detecting the gestures reliably. This was a problem because the waveform is not always consistent, so pushes can actually have sections of decreasing peak heights and pulls can have sections of oscillating peak heights. Thus, the peak heights do not monotonically increase or decrease, and our detection algorithm had to take these errors into account. We considered doing linear regression on the peak heights to determine if the resulting slope was, on average, increasing or decreasing, but decided against it since it is computationally heavy. Using a state machine that would require significantly less memory on the microcontroller, we thought we would be able to achieve comparable accuracy without using as much memory or computation time. The state machine diagram is shown below, and is a two-bit saturating counter. The idea of the counter state machine is borrowed from Computer Architecture, which uses them to predict branching in code.
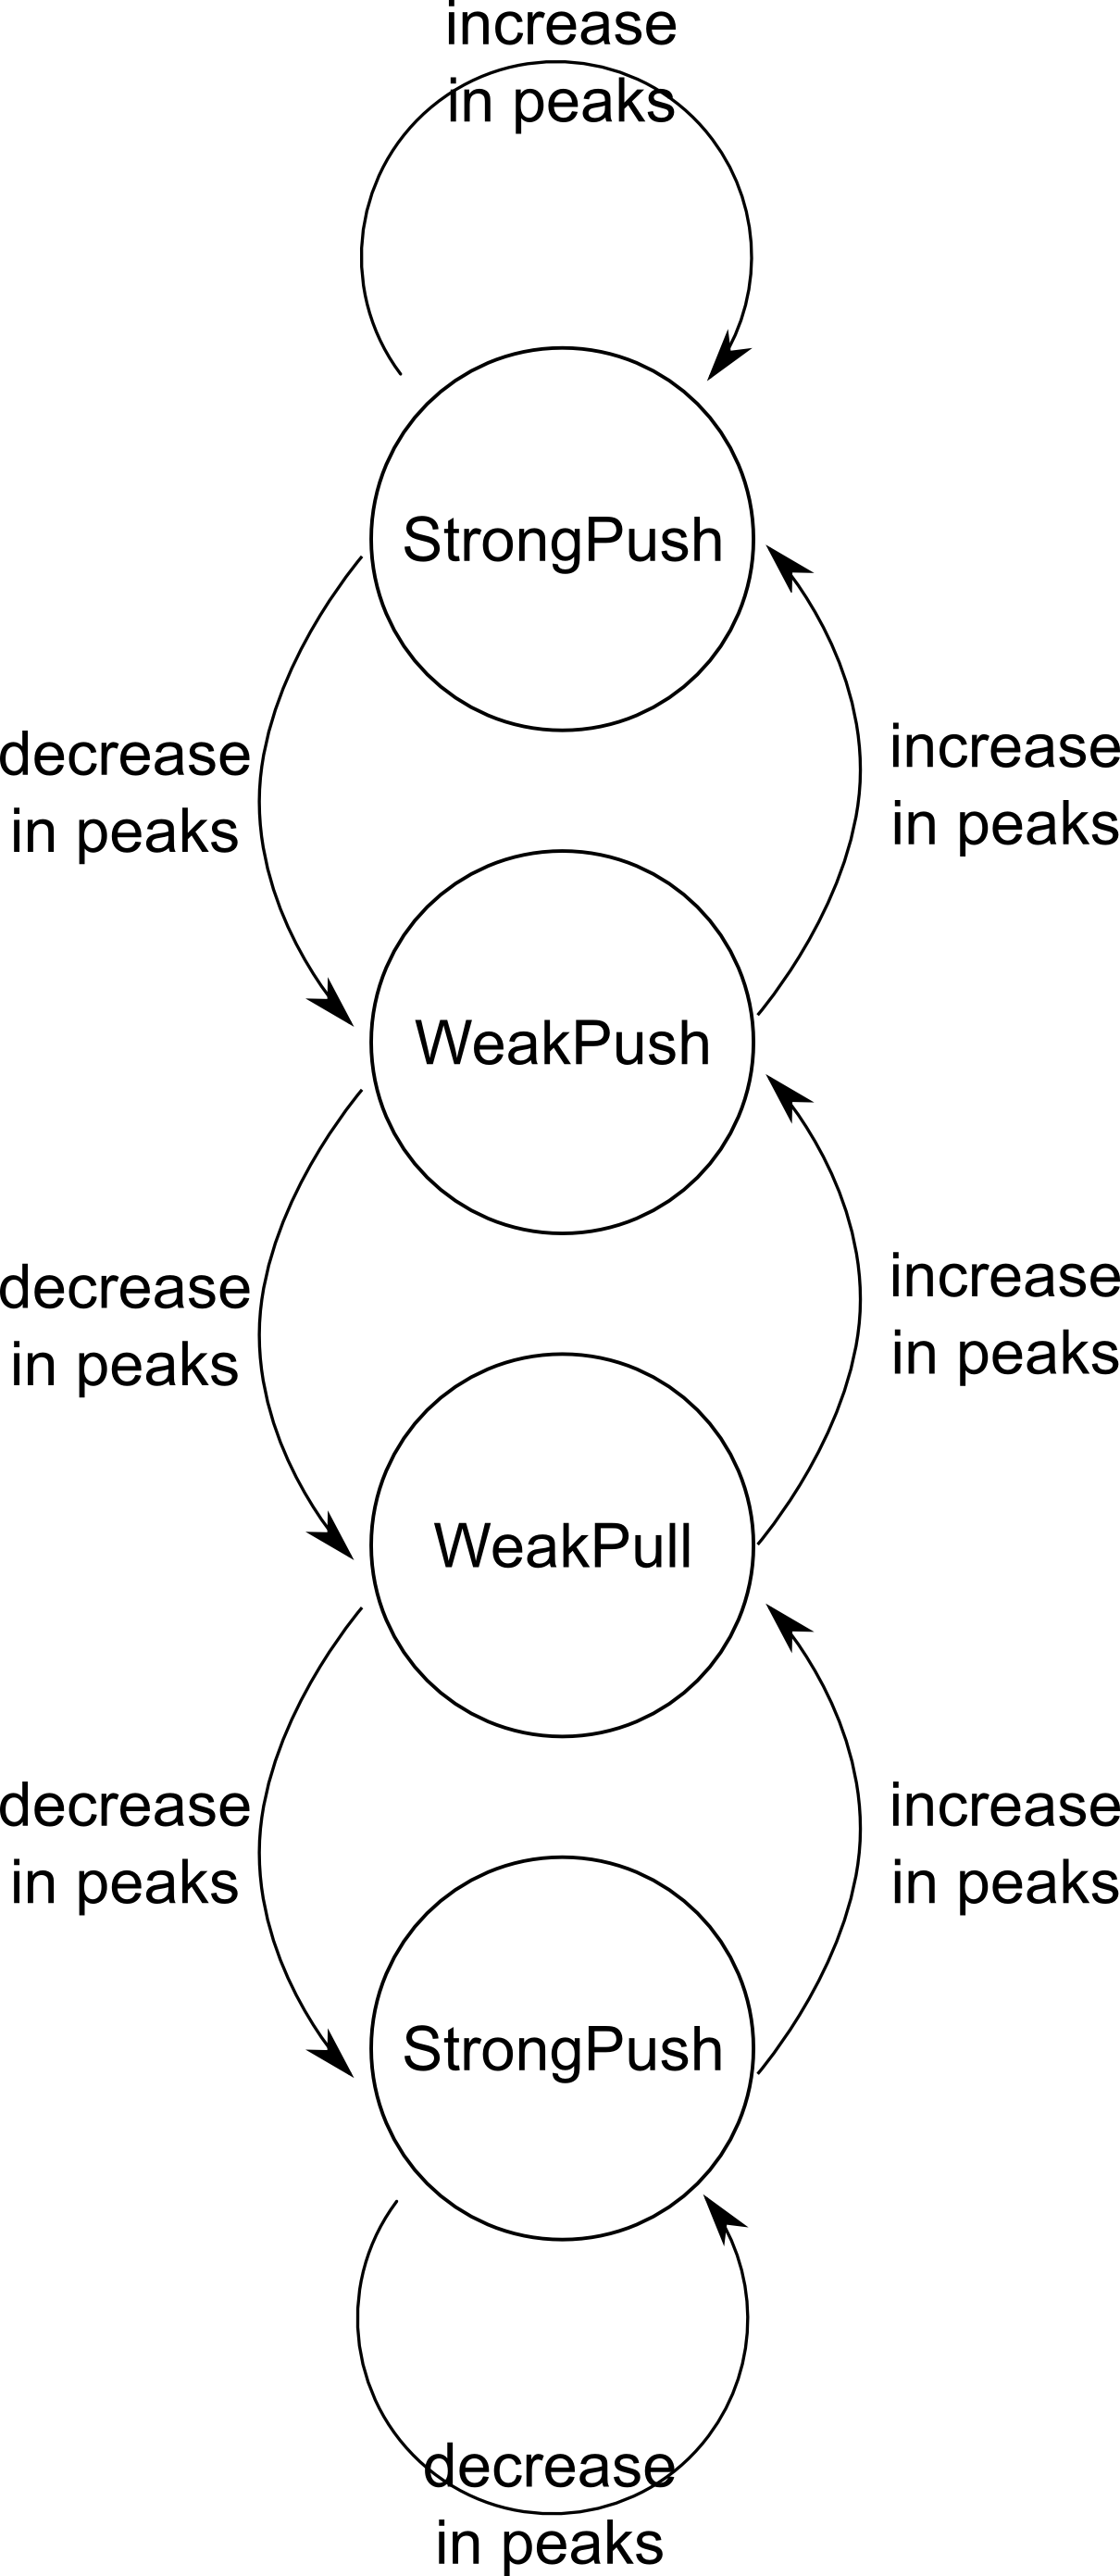
Two-Bit Saturating Counter for Gesture Detection
Thus, we were able to combine the waveform characteristics of frequency and amplitude, as well as a state machine for determining the most-likely gesture, into our algorithm. The state machine in particular was very valuable, because it introduced a little bit of memory, or hysteresis, into the gesture detection. In other words, if the trend of peaks is indicating the gesture to be a push, then one peak drop at the end will still result in a PUSH detected. If the state is either strong or weak push, the gesture detected is a push; if the state is either strong or weak pull, the gesture detected is a pull. The resulting motions and range of times were output to a computer screen through UART.
Results
Detection of Pushes and Pulls
Our Ultrasound Gesture Detection sytem is able to detect pushes and pulls with reasonable accuracy. No numerical support is provided because we have no way of generating consistent pushes and pulls for comparison. However, for most actions, the system sufficiently detects the motion and is able to discriminate pushes and pulls.
In our design procedure, we used the microcontroller to record a long series of samples (10000 samples) to an array and then output those results to UART. Then we copied those numbers and put them into a large array, and we coded the logic for discriminating pushes and pulls offline. We found this to be an efficient methodology because there was at least some consistency in the samples. In addition, feedback was also quicker and more accurate since we were able to print to screen. For the sampled data, the algorithm for live detection was tested on the first 2000 samples and was found to be accurate as long as the patterns are not outlandishly erratic. The algorithm for the record and playback mode was tested on all 10000 samples. Out of the approximately 10 pushes and pulls (and intentionally created erratic samples) in the sampled data, the algorithm mispredicted only twice. This gives us an accuracy of about 80 %. This is the best idea of accuracy we can provide since we have no way of consistently generating the same style of pushes and pulls.
The two different algorithms for detecting pushes and pulls are compared below.
Live Detection Algorithm
The live detection algorithm works best on pushes and pulls that cause waveforms with steadily-increasing peak amplitudes, such as the one shown below:
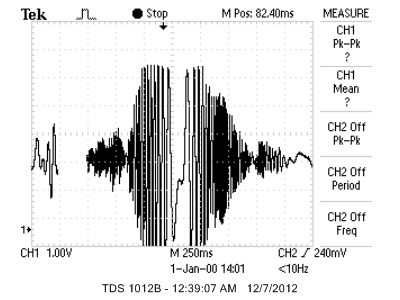
Steady pushes and pulls
For these pushes and pulls, the peak buffer is filled sequentially, and since the first three entries in the buffer are likely to be steadily increasing (or steadily decreasing), the detection algorithm immediately returns PUSH (or PULL) immediately.
If the amplitudes do not increase steadily, such as in the picture below,
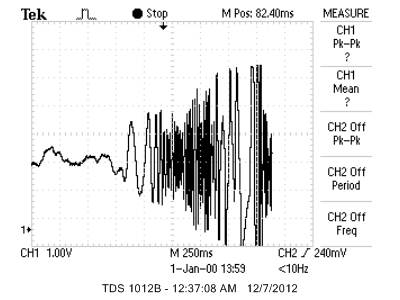
Unsteady push
the algorithm still detects correctly (a PUSH) if there are sufficient increases in amplitudes over a peak buffer size of 6. However, one caveat is that the peak buffer has to accurately cover the right range of peaks when the detection takes place, so that there are sufficient increases to indicate a push. The buffer size of 6 was empirically chosen because it gave relatively good peak detection. Buffer sizes were parameterized usign #defines to facilitate empirical testing. If the buffer size is too big, quick pushes and pulls with a small number of peaks will not fill the peak buffer completely and hence no detection will take place. If the peak buffer size is too small, the algorithm will be forced to jump to conclusions, which often causes it to mispredict.
The following picture shows how the live detection algorithm works. The high DC level in channel 2 indicates push, and the lower DC level indicates pull.
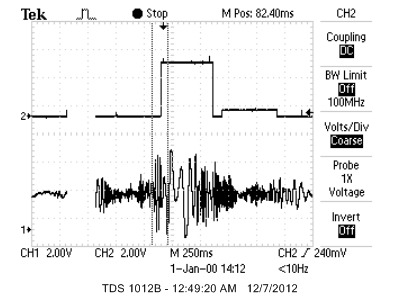
Outputs
This algorithm is able to find every peak accurately. We know this because when the algorithm is run on the sample set that we took, it managed to identify every single peak in the data we collected. The rest of the decision process may not be perfect, but being able to detect every single peak is very useful because more sophisticated algorithms can be implemented using highly accurate information about peaks, such as applying a linear fit and finding the gradient, for example.
The main advantage of this algorithm is that it allows for live detection, since it has no dependence on a large number of samples. Of course, accuracy is traded in for speed. We believe that further improvements can be made to improve the accuracy. In general, this algorithm works better over a general case: even if the user changes his mind at the end of a sampling window and decides to pull, it will still register as a PUSH since the peak values were increasing over most of the buffer.
Recorded Mode Algorithm
In contrast to the Live Detection Algorithm, the Recorded Mode Algorithm used a state machine that updated the gesture detected based on the most recent peaks in the waveform. Since the state machine used was a two-bit saturating counter, the state could change based only on the last two peaks. This is advantageous if the buffer used in the Live Detection Algorithm was very large, and in the last few samples the user changed their gesture. Then, the Recorded method would reflect the most recent changes in the motion, rather than the average.
In addition, the Recorded mode also has an overall view of the waveform, which contributed to its likelihood to predict more accurately. It potentially has unlimited time to calculate and make a decision, since no samples will be missed during the long calculation time. However, we were still limited by the size of the memory on the microcontroller, so we were still motivated to find an efficient algorithm.
Safety
The device is safe to use. There are no moving parts, and if developed into a full product, all electrical wires could be hidden away safely.
The high frequency of the output sound should be beyond the hearing range of any human, but since young children are more sensitive to high-pitched sounds, the high frequency of the output sound may affect young children. Further exploration will have to be carreid out to see if there is any effect on the children.
Interference
Our system emits a high-pitched sound and may interfere with other projects if they also make use of high-pitched sounds in the same range. However, this did not happen during the entire course of testing and so we believe the probability of this occuring is quite low. No other wireless signals were emitted and no other interference is expected.
Usability
The product is easy to use although detection can be improved. The hardware has been engineered so that surrounding noise does not affect detection and this allows the product to be used even in noisy environments such as the lab. The following image shows the signal when there are no movements nearby:
No motion nearby
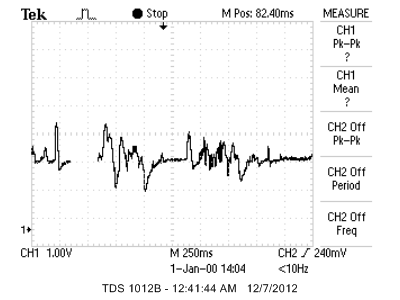
As shown above, no background noise is sampled whatsoever. The following image shows the ADC samples when the table is knocked:
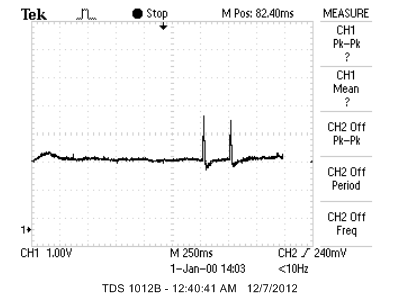
Knocking on table
The waveform sampled has sharp peaks that quickly return to the 0 level, with no ripples after that. If this signature is detected, it can easily be eliminated, hence this does not impact accuracy of detection. The following image shows the effect of sustained loud noise near the system:
Sustained loud noise
The above sustained loud noise was produced by whistling when sitting next to the system. We observe odd peaks that may interfere with operation of the device. However, such sustained loud noises are not expected of a person trying to use the system and so we do not expect this to impact operation of the device.
Conclusions
Analysis
Our project exceeded our expectations in how well we would be able to characterize sound waves. However, we did not meet our initial expectations in being able to detect several (more than 2) gestures in real time. This was because we were mistaken about the level of computation that we would be able to achieve with a microcontroller, and ended up re-directing our project down a more experimental path. We gained much understanding in how a sound wave's frequency and amplitude shifted in response to a gesture near the transducer (speaker) and microphone, and were able to use our findings in our own software detection algorithms.
Intellectual Property Considerations
The only code we used from someone else's design was the uart.h library used in the class, ECE 4760. The reference is included in the References section. We coded the rest of the algorithms used in this project ourselves. Initially we were interested in reverse-engineering the Microsoft SoundWave project on a microcontroller, but we ended up only borrowing the idea of a frequency shift due to motion. We did not copy a design because we were interested in exploring the effects of gestures on sound waves and created our own algorithms. We did not have to sign non-disclosure to get sample parts.
There are no patent opportunities for our project, because it was more experimental. Motion sensing using ultrasound has already been patented, and publishing opportunities would only be available if we were able to clean up our design and built a prototype with one of our algorithms. We currently have no plans for publishing or patenting our project.
Ethical Considerations
For the duration of this project, we tried our best to comply with the IEEE Code of Ethics. We soldered our project board so the circuit would be safe to touch and use, and we clipped exposed leads on the ends of wires on our un-soldered boards to make them safe to pack up and move. In addition, we did our best to give all due credit in the References section, and attributed the source to all the datasheets and code that we used.
In addition, we made sure to double-check our component values to ensure we were correctly representing our work online. Since we switched many components around, we made sure to verify which one we actually used in our final circuit.
We also tried to abide by the ethical code by double-checking all of our data used in the results section. Since we obtained accuracy data from those waveforms, we made sure to take several in order to get a good representation of our project, to prevent misrepresenting our results.
We do believe that we strived to improve the current understanding of technology and its application, because our project was about characterizing aspects of gestures and how they affect sound waves. We were most interested in our findings, and not a final design in particular. In addition, we made sure to research the effects of the ultrasound on the environment, with small children in mind in particular.
Legal Considerations
Our device does not use any wireless transmissions or devices that would be necessary for legal considerations.
Appendices
A. Source Code
Download all files: everything.zip.
B. Schematic
Image of schematic: circuit.pdf.
C. Parts List
This section lists all the parts that cost us "money" to either rent or purchase.
| Item | Quantity | Total Price |
|---|---|---|
| Breadboard | 1 | $6.00 |
| Solder board | 1 | $2.50 |
| Power supply | 1 | $5.00 |
| Speaker CDM-20008 (did not use this eventually) | 1 | $2.18 |
| Microphone CMA-4544PF-W | 1 | $0.96 |
| Multiplier AD633 | 1 | $9.89 |
| DIP socket | 6 | $3.00 |
| SIP socket | 8 | $0.40 |
| DIP socket for 1284p | 1 | $0.50 |
| ATmega1284p | 1 | $5.00 |
| USB connector for custom PC board | 1 | $1.00 |
| SIP plug | 36 | $1.80 |
| Custom PC board | 1 | $4.00 |
| Total | $42.20 |
D. Tasking
Tasks for this project were not specifically divided between Ackerley and Lydia since most of this lab was experimental, and we did not know what would work till we actually built it. Much of the plans were changed along the way and we worked on all the tasks together and alternated tasks as plans changed.
Acknowledgements
We wish to specially thank the following people:
- Professor Land, thank you for your suggestion on using the multiplier in our signal manipulation. Thank you also for your expertise in this field, thank you for spotting the broken solder joint that saved our project and saved us hours of debugging. Thank you also for your guidance in the earlier parts of the course and earlier labs.
- The rest of the ECE 4760 TAs for the many hours you guys spent in lab with us.