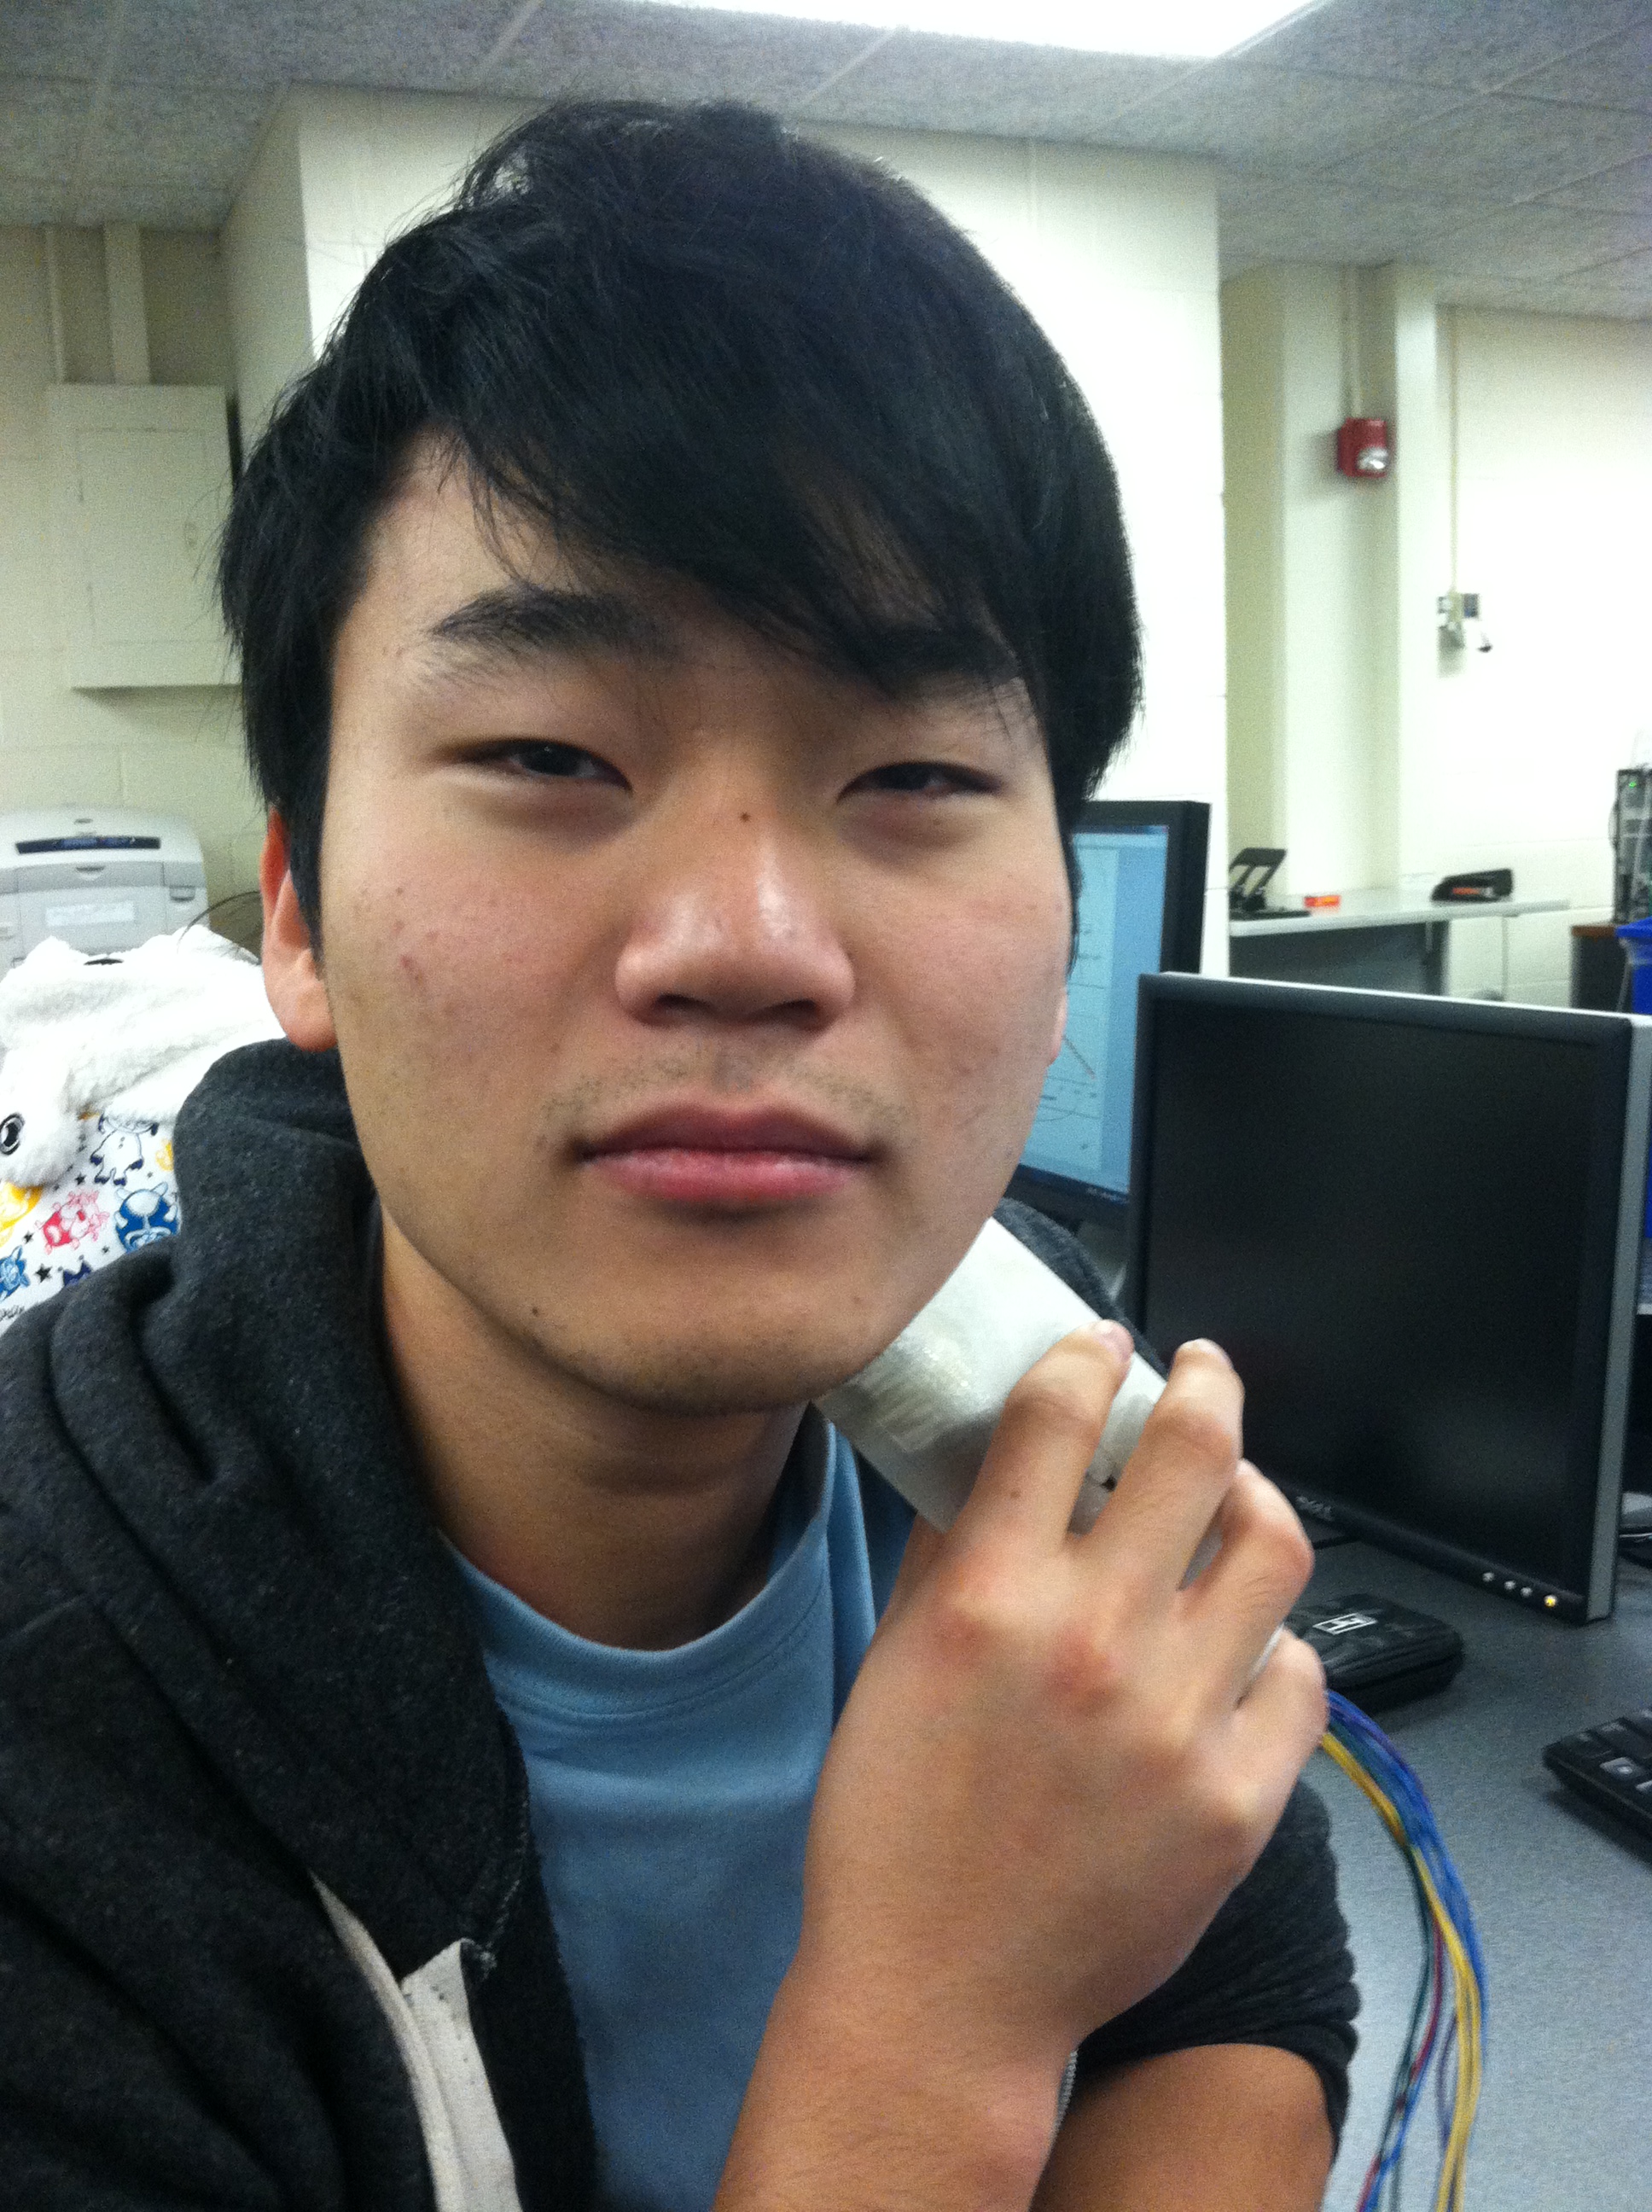
Randy and Alex with Scan-E
Scan-E
Introduction top
For this project, we created a noninvasive heart rate and blood pressure measurement tool with the intention of gathering data for large-scale analysis for the automatic prediction of heart disease.
In modern society, patients often have access to a wealth of electronic data concerning their social networks and surroundings, but have little personalized insight into their own health. Our plan is to distribute a small handheld device with an array of biometric sensors to collect data about a user’s body. With the patient’s current and past data, we can give the patients a pre-diagnosis (outlining symptoms and possible sickness) using machine learning techniques to create a general summary of the patient’s symptoms and potential treatment while collaborating with physicians to reach a final consensus of the patient’s health status before the patient is aware of his/her illness. We want to empower users with basic knowledge of their vital signs and help them be more proactive in disease prevention while relying less on frequent primary care physician office visits.
For this project, we implemented the heart rate and blood pressure monitoring devices. For the final device, we want to have a complete array of physiological sensors. We wanted to build the basis for the optical sensing hardware, since most of the metrics gained in the final device will be based on optical design. We experimented with different methods of both analog and digital optical sensing, and found that digital sensing was the most effective for our purposes. In addition, we developed a reliable method of real-time digital signal processing to extract pulse transit time and heart rate information.
Currently, our project can measure a pulse transit time that correlates logarithmically to the blood pressure of the subject. There are still issues with the peak detection algorithm and the physical interface, but in ideal operating conditions the device can measure pulse transit time effectively.
High Level Design top
Project Rationale
The ratio of health workers in the United States numbers 2.4 physicians for every 1000 people, yet in other developed countries such as Norway this metric goes up to 4.16 per 1000, leaving the US on the low end in the developed world. In other less developed countries, that number is far lower: for example in Africa, there are 0.003 physicians per 1000 people. This disparity between the number of people and the available health workers limits the effectiveness of the healthcare system. On another front, the rate of increasing cost of healthcare in the US due to advances in medical technology and increases in reimbursement incentives for physicians and hospitals is greater than the rate of increase of governmental spending in healthcare. As the costs of medical treatments and amount of money spent towards treatment increase, the quality of treatments also increases, yet the number of people who can afford such healthcare decreases. Paradoxically, the general health of the nation declines despite increases in medical technology.
Currently, there are 2.4 physicians per 1000 people in the US, with other lesser developed countries with as few as 0.003 physicians per 1000 people. This wide disparity between health workers and patients has been one of the main limiting factors of the effectiveness of the health care system. In addition, the rising cost of healthcare because of advances in medical technology has risen far faster than the government and the patient’s ability to pay for these technologies.
While reading through some news articles, we stumbled upon a gizmag article that discussed how IBM Watson was being utilized to aid in the diagnosis of patients, and we thought it would be useful to build an infrastructure where patients could do a health analysis on themselves by themselves. Because of the wide disparity between the number of available health workers per person, we thought it could benefit society to empower the common person with the means of tracking his or her own health, prevent illnesses, and be able to send quantitative data to doctors easily for analysis. By providing this data to both patients and doctors, we hope to facilitate and augment the throughput of doctors’ efforts.
Our solution, which provides people with a consumer electronic device that can collect biometric data and interpret it, will give users a method of gathering insight into their own bodies and health. We will provide users the ability to purchase a low-cost device that can pay itself back in orders of magnitude by reducing unnecessary doctor visits while giving users the ability to have some control and knowledge over their own health. We hope to eventually create the infrastructure through which we can collect and securely transfer patient data between patients and their respective physicians, as well as perform machine learning tasks that can predict health risks for patients, in a similar fashion to IBM Watson.
Background Math
In order to measure blood pressure, most methods involve invasive intravenous (IV) force measurement or pressurized air cuffs. The IV methods are highly invasive and require skilled administration by a nurse, while pressurized air cuffs can be uncomfortable and inconvenient. We decided to pursue an optical pulsatile method of blood pressure measurement, using pulse transit time rather than direct force measurements. Similarly, to gather pulse data we utilized optical reflectivity. We can optically measure pulses because of the reflective characteristics of blood, as indicated in the figure below. Different volumes of blood have different reflective characteristics, so by measuring the changing in reflectivity we could measure the time between pulses in varying parts of the body.
Our focus on optical measurements comes from our idea to reduce the level of invasiveness as far as possible. Compared to traditional methods, our optical measurement method is fast and simple enough to ideally be used by anyone with little training. In order to get pulsatile readings on two parts of the body simultaneously, we use a front and top facing sensor on the final device. The user positions his/her finger on the top sensor while pointing the front sensor to a different part of the body, thus measuring a difference in pulse time.
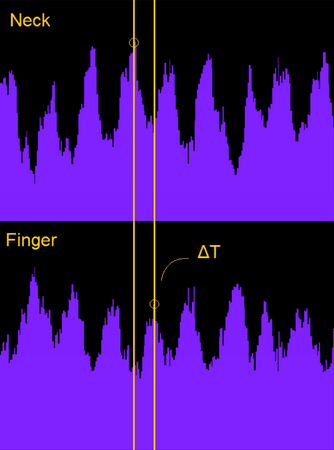
As blood pumps through the body, the volume of blood in the points of measurement also changes. These volumetric changes modify the optical reflectivity of the measured area, since the composition of the surrounding tissue stays the same while the volume of blood changes. We can measure these volumetric changes and detect peaks in the signals to detect heart beats, and use the delay between peaks at different parts of the body to detect differences in pulse transit time.
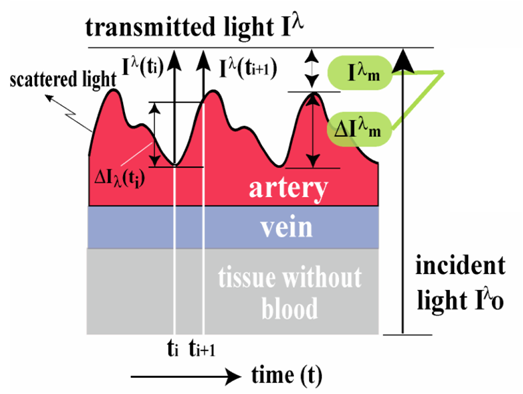
Relationship of Transmitted Light to Blood Flow.
The reason we chose to measure blood pressure and pulse were because of some preliminary machine learning statistics we gathered about heart disease prediction. Using the UCI dataset, we trained an SVM classifier to predict whether or not a patient had heart disease using only non-invasive data. We utilized a linear kernel, and our only features were age, sex, chest pain types, resting blood pressure, and maximum heart rate. Just utilizing these basic features, we were able to achieve a relatively high rate of accuracy in predicting heart disease, and so we wanted to build a prototype that could help us acquire the data necessary to begin data mining for the eventual purpose of diagnosing patients. Below we present the statistics gathered, where we show the obtained accuracies given number of training documents. By using just a few health metrics, we could obtain accuracies of >76% using purely these metrics alone.

Relationship between SVM Accuracy and Training Docs
We used the Moens-Korteweg model of blood pressure to justify the validity of our pulse transit time measurements to estimate blood pressure. The Moens-Korteweg model describes the relationship of PTT with blood pressure. Essentially, the PTT is directly proportional to the pulse wave velocity with linear offset based on the path length.
E = elastic modulus of the blood vessel
h = vessel thickness
p = blood density
r = vessel radius
The elasticity modulus is further dependent upon the blood vessel wall pressure, related exponentially.
In this equation a is a constant 0.017mmHg, while P is the mean arterial pressure. The elasticity modulus thus changes exponentially with changes in pressure. From this relationship, we can fit known PTT measurements and ground truth blood pressure measurements to a logarithmic model.
This can be done with standard regression techniques to find calibrated coefficients A and B. The model assumes the pulse transit time measures the time from the aortic valve of the heart opening to the pulse propagation to the measured area. However, for our model, we measured the difference between the propagation times to the neck and the finger. This approach has the advantage of using only pulse propagation methods and does not require additional instrumentation such as an electrocardiogram (ECG).
According to the Buenos Aires group, the PTT still follows the calibratable logarithmic model if certain features are fixed. The mean pulse wave velocity must be assumed to be similar for both pathways regardless of the different blood vessel thicknesses. As a result we have used this regression-based model to gauge the accuracy of the PTT measurements for this project.
Logical Structure
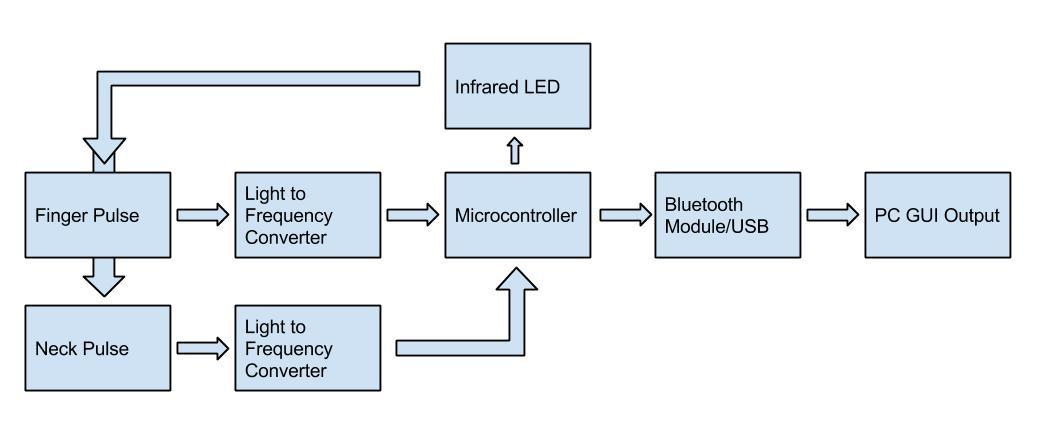
This diagram shows the overall structure of our system. At the heart of our device is the ATMEGA 1284p, this device is controlling the infrared LEDs that will transmit light which is reflected back to the light to frequency sensors. The microcontroller takes in the signals that reflect pulsatile measurements, and will digitally process these signals into pulse measurements, and send the data through either USB or bluetooth to a PC. The PC will have a GUI that graphically shows the two pulses and the blood pressure and pulse.
There are two main components of our design: the base station unit and the mouse unit. The mouse unit contains the mouse controller, a mega1284P microcontroller, an ultrasonic sound transmitter, three ultrasonic sound receivers and an XBEE wireless transceiver. The base station contains a mega32 microcontroller and an XBEE wireless transceiver.It is connected to PC using a USB cable. Users input their commands using the mouse controller, the raw distance data will be generated in the mouse unit within the mega1284P microcontroller for it to output the x and y coordinate data. The microcontroller also handles the ISR generated by button click actions. The mouse unit finally encodes the data into packets and the data is then transmitted to the base station unit using XBEE radio transceiver. When the base station receives the data, it encodes and transmit the data to PC through serial connection. The serial data is read and decoded by java application and utilized for the java HID class. A diagram demonstrating the logical structure is shown as above.
Hardware/Software Tradeoffs
To begin our project, we had to make a few decisions between hardware and software. Because this sub-project was part of a larger theme, we wanted our project to be very modular such that we could add sub systems for new sensors as we developed more ideas. In order to ensure a more modular product, we decided that most we wanted to limit the hardware as much as possible. Adding more and more hardware to the medical scanning device would only make our product more expensive, so we decided that having a microcontroller that could digitally process and receive signals would allow for more future modularity, as we could add smaller pieces of cheaper hardware and filter all signals through the microcontroller. The tradeoff is that the software becomes increasingly complex, and at some points we even found that the ATMEGA1284p did not have enough RAM to handle some floating point operations, so an even more expensive microcontroller would have to be obtained.
Hardware top
Hardware Selection
Throughout the course of this project, we experimented with several hardware elements to find an optimal combination of components. Firstly, for the optical sensor, we initially experimented with analog components. However, the analog hardware required was large, and multiple components were required to sample the values. In addition, the onboard ADC did not have sufficient resolution (10-bits) that we desired. The analog circuit had to be tuned very precisely as well and as a result could not easily have a variable dynamic range without additional hardware. As a result, we experimented with digital methods. Though sampling rates could potentially be very high at the speed of the ADC, the practicality for an eventually multipurpose light sensor was not evident.
The TSL2561 digital light sensor communicated via I2C (or two wire interface TWI) and essentially combined a high resolution ADC with a high sensitivity analog photodiode. However, to achieve accurate measurements on the TSL2561, the sensor required long integration times to achieve a high enough signal to noise ratio. With our experimentation, we found this rate to be 50mS. Since the length of the pulse transit time averages around 200mS, this sampling rate would be too low temporal resolution to be practical.
We eventually chose the TSL235R, a light to frequency converter, because it allowed completely digital measurement of light. The typical square wave output from the sensor was several kilohertz, which was reasonably accurately detectable by our microcontroller. The advantage of the light-to-frequency sensor was its variable dynamic range. Since we ultimately used counters to measure the frequency, we could measure over a wide range of frequencies and light intensities by measuring timer overflows.
We also experimented with multiple microcontroller chips. In the interest of price, we initially attempted to use an Atmega328 chip. However, the Atmega328 only had three hardware timers, but our initial timer implementation of the frequency sensing required four timers. As a result, we experimented with polling methods of counting, but found that the approach resulted in high levels of jitter. Because we found that the polling method was unstable, we used the Atmega1284p in order to use the greater hardware capabilities and additional timers to build this project.
Hardware Constraints
During the initial design of the project, we experimented with offline analysis of the acquired light sensor data. However, in order to achieve an appropriate sampling rate, we needed to allocate a large portion of memory to store the sampled data. Since the Atmega1284p has 16kB of RAM, we would be unable to store data for several seconds at a 1kHz sampling rate for two sensors. Over the course of the project, we also reached this memory barrier after implementing multiple floating point large digital filters. We had to restructure the memory allocation in order to overcome this barrier.
In addition, a large portion of our final developed system was dependent upon the hardware constraints of the microcontroller. The frequency and execution of interrupts, for example, prevented us from using externally triggered interrupts to track the light sensor frequency, since the execution of each interrupt service routine would slow down the microcontroller as the input frequency increased.
System Design
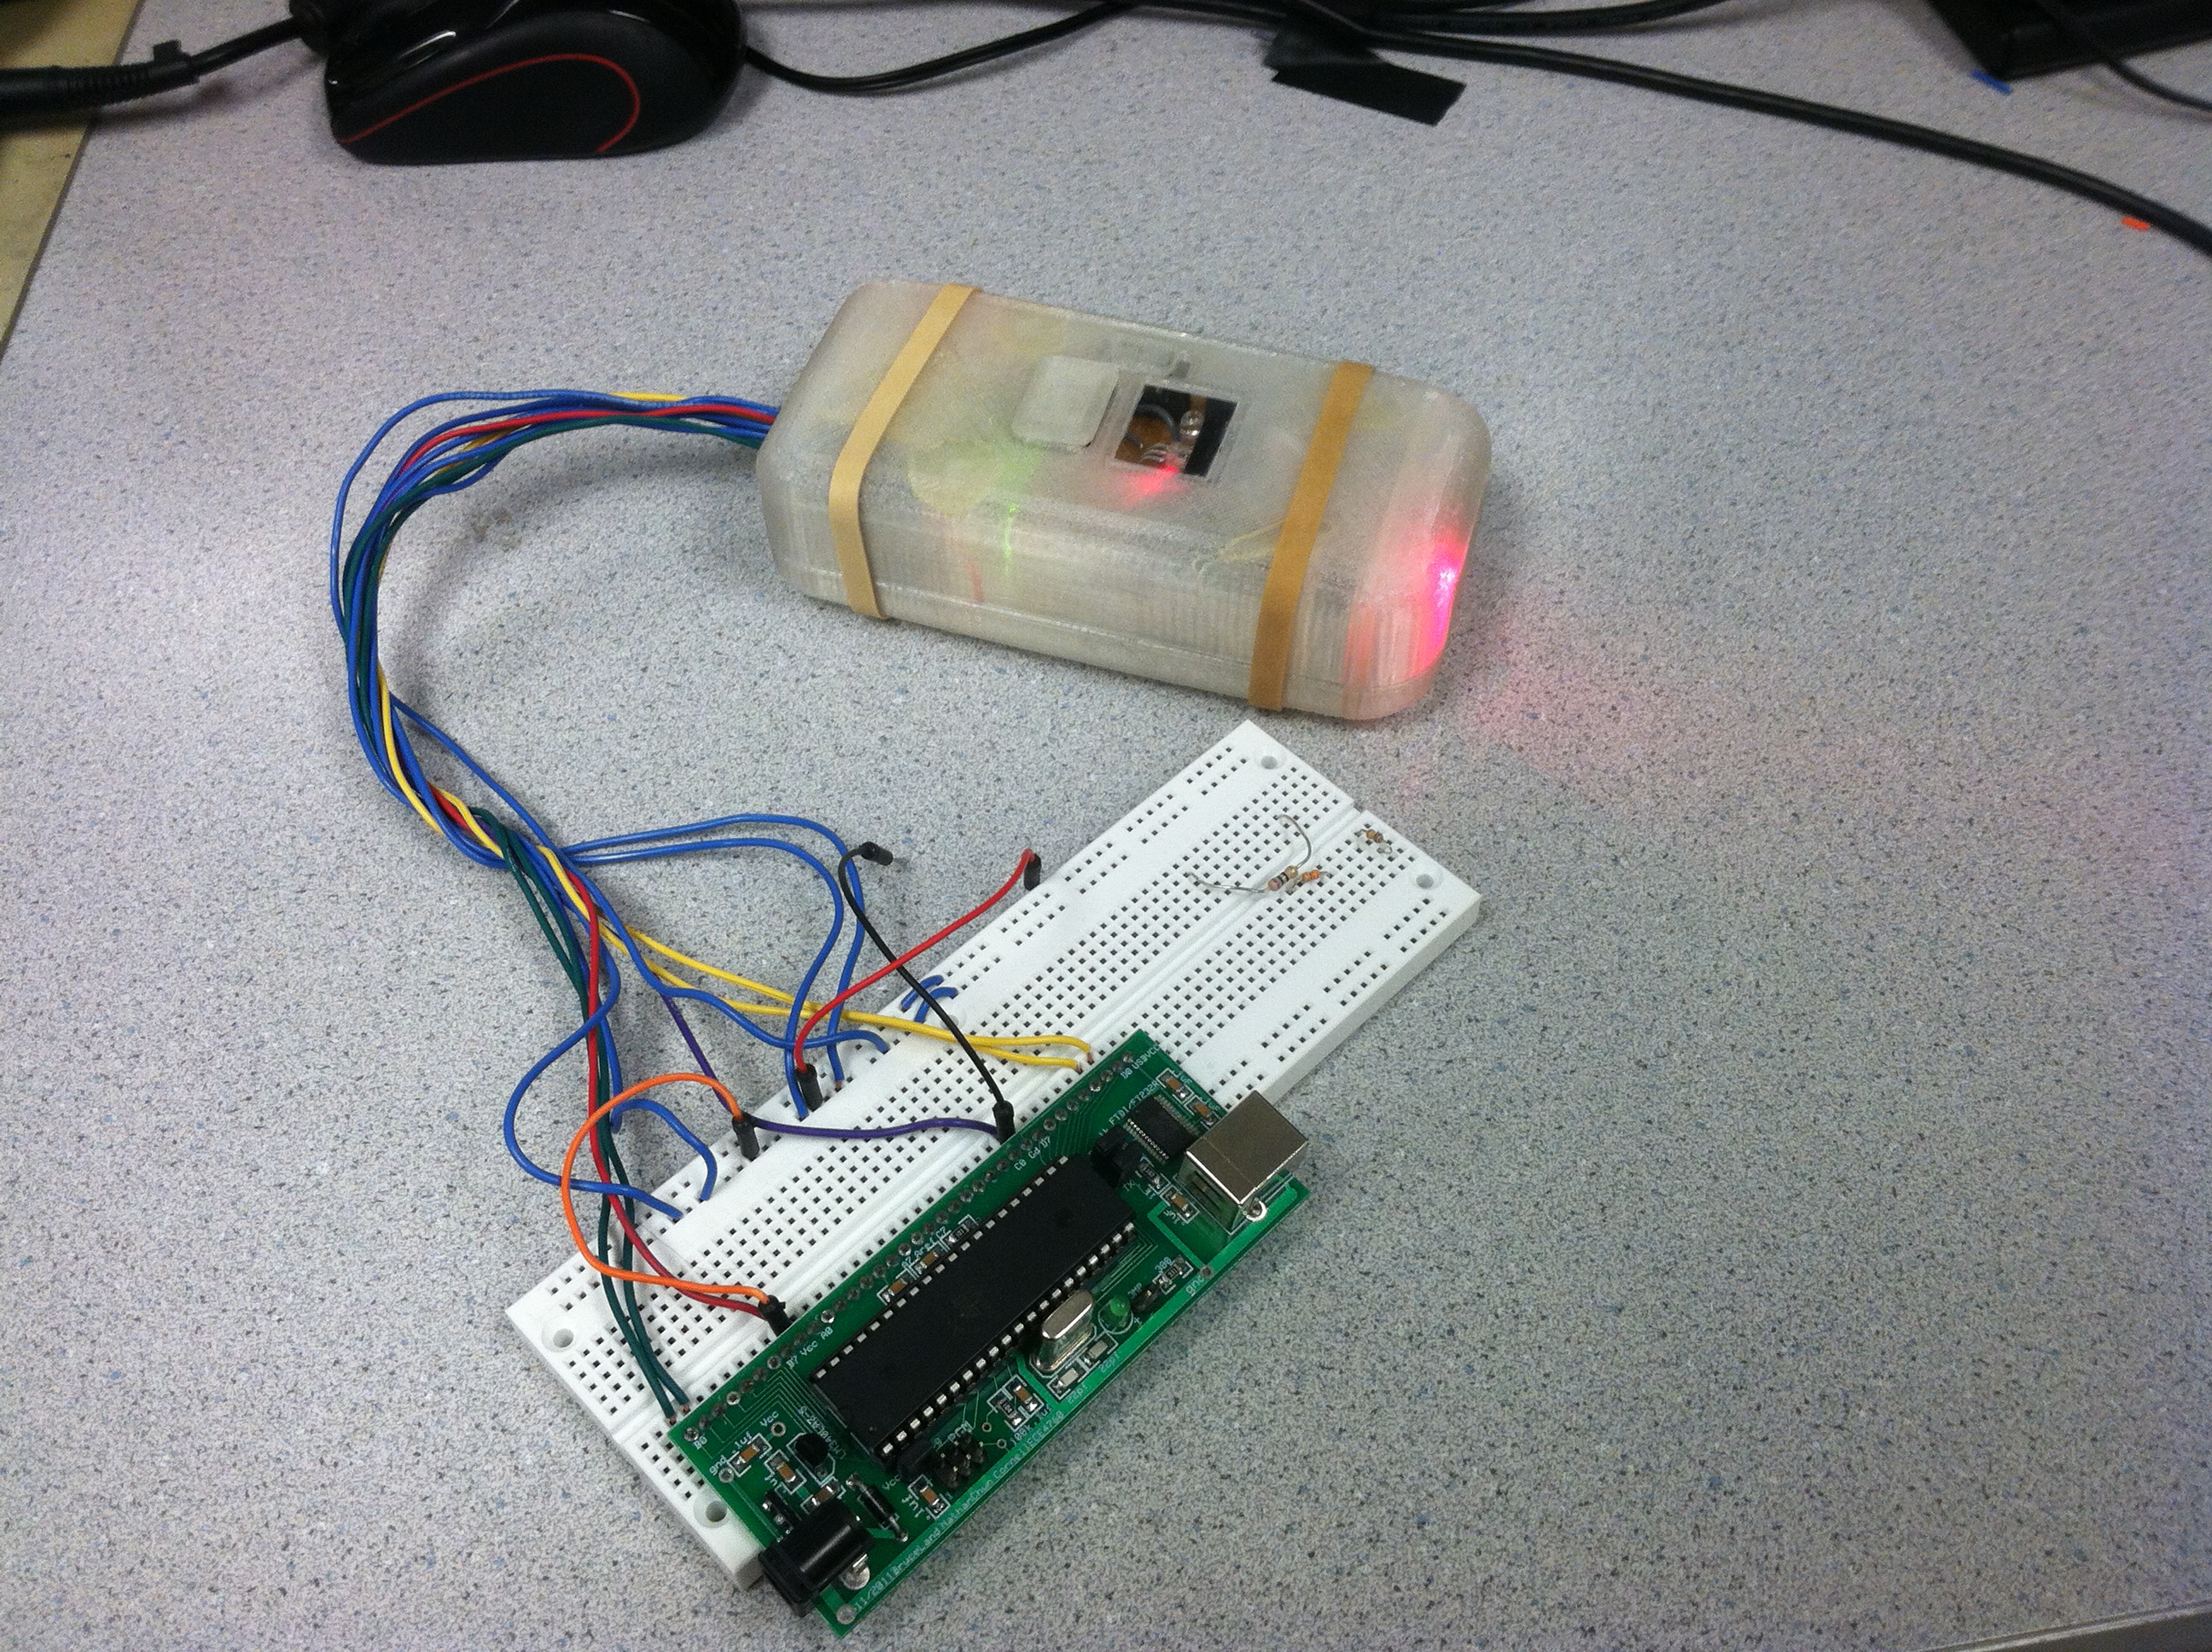
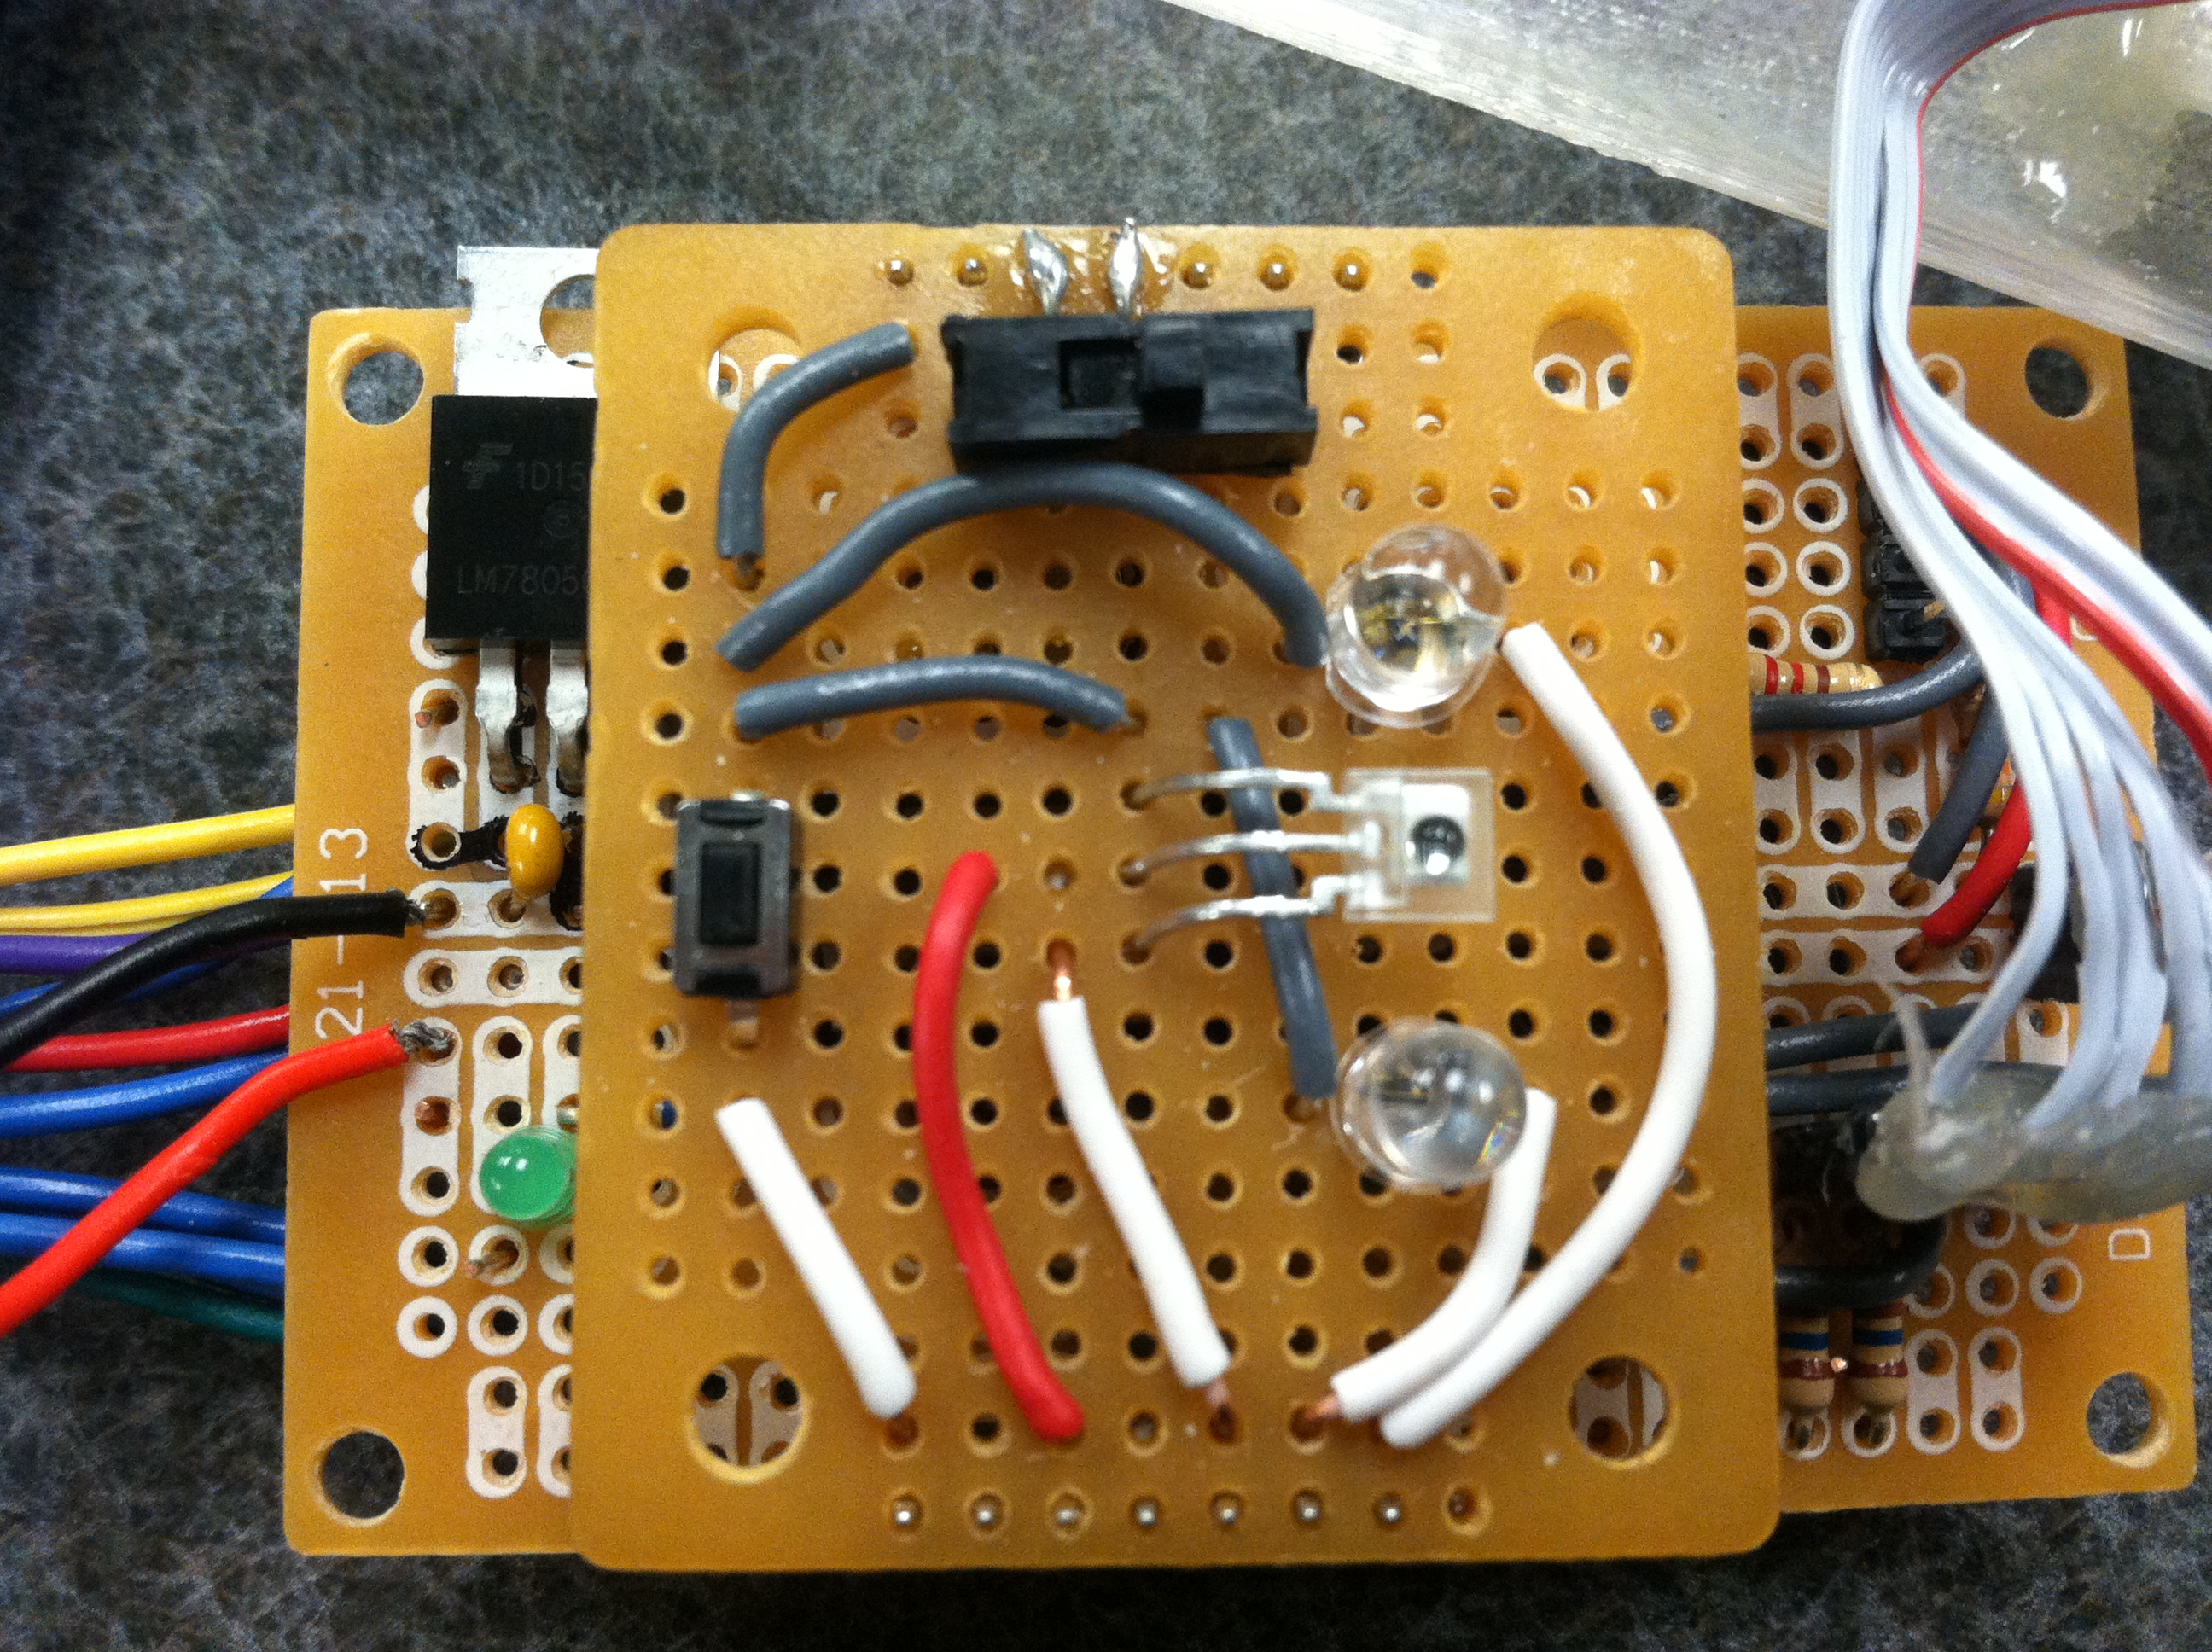
This is an overall view of our design project. Two light sensors connect to the ATMEGA1284p through pin B0 and B1, externally triggering timer 0 and timer 1. Our UART is connected through D0 and D1 to the bluetooth module, although the project can also be configured to use USB to connect to a computer. Port A controls the various LEDs.

High Level Diagram of Device
Optical Sensors
The TSL235R light to frequency converters used in this project were arranged on the front and top of the device, to allow for neck and finger pulse sensing. The optical sensors are placed in between two LEDs, one red 660nm and one 980nm IR led. Also included is a toggle switch for power and a momentary push button switch to signal data acquisition.
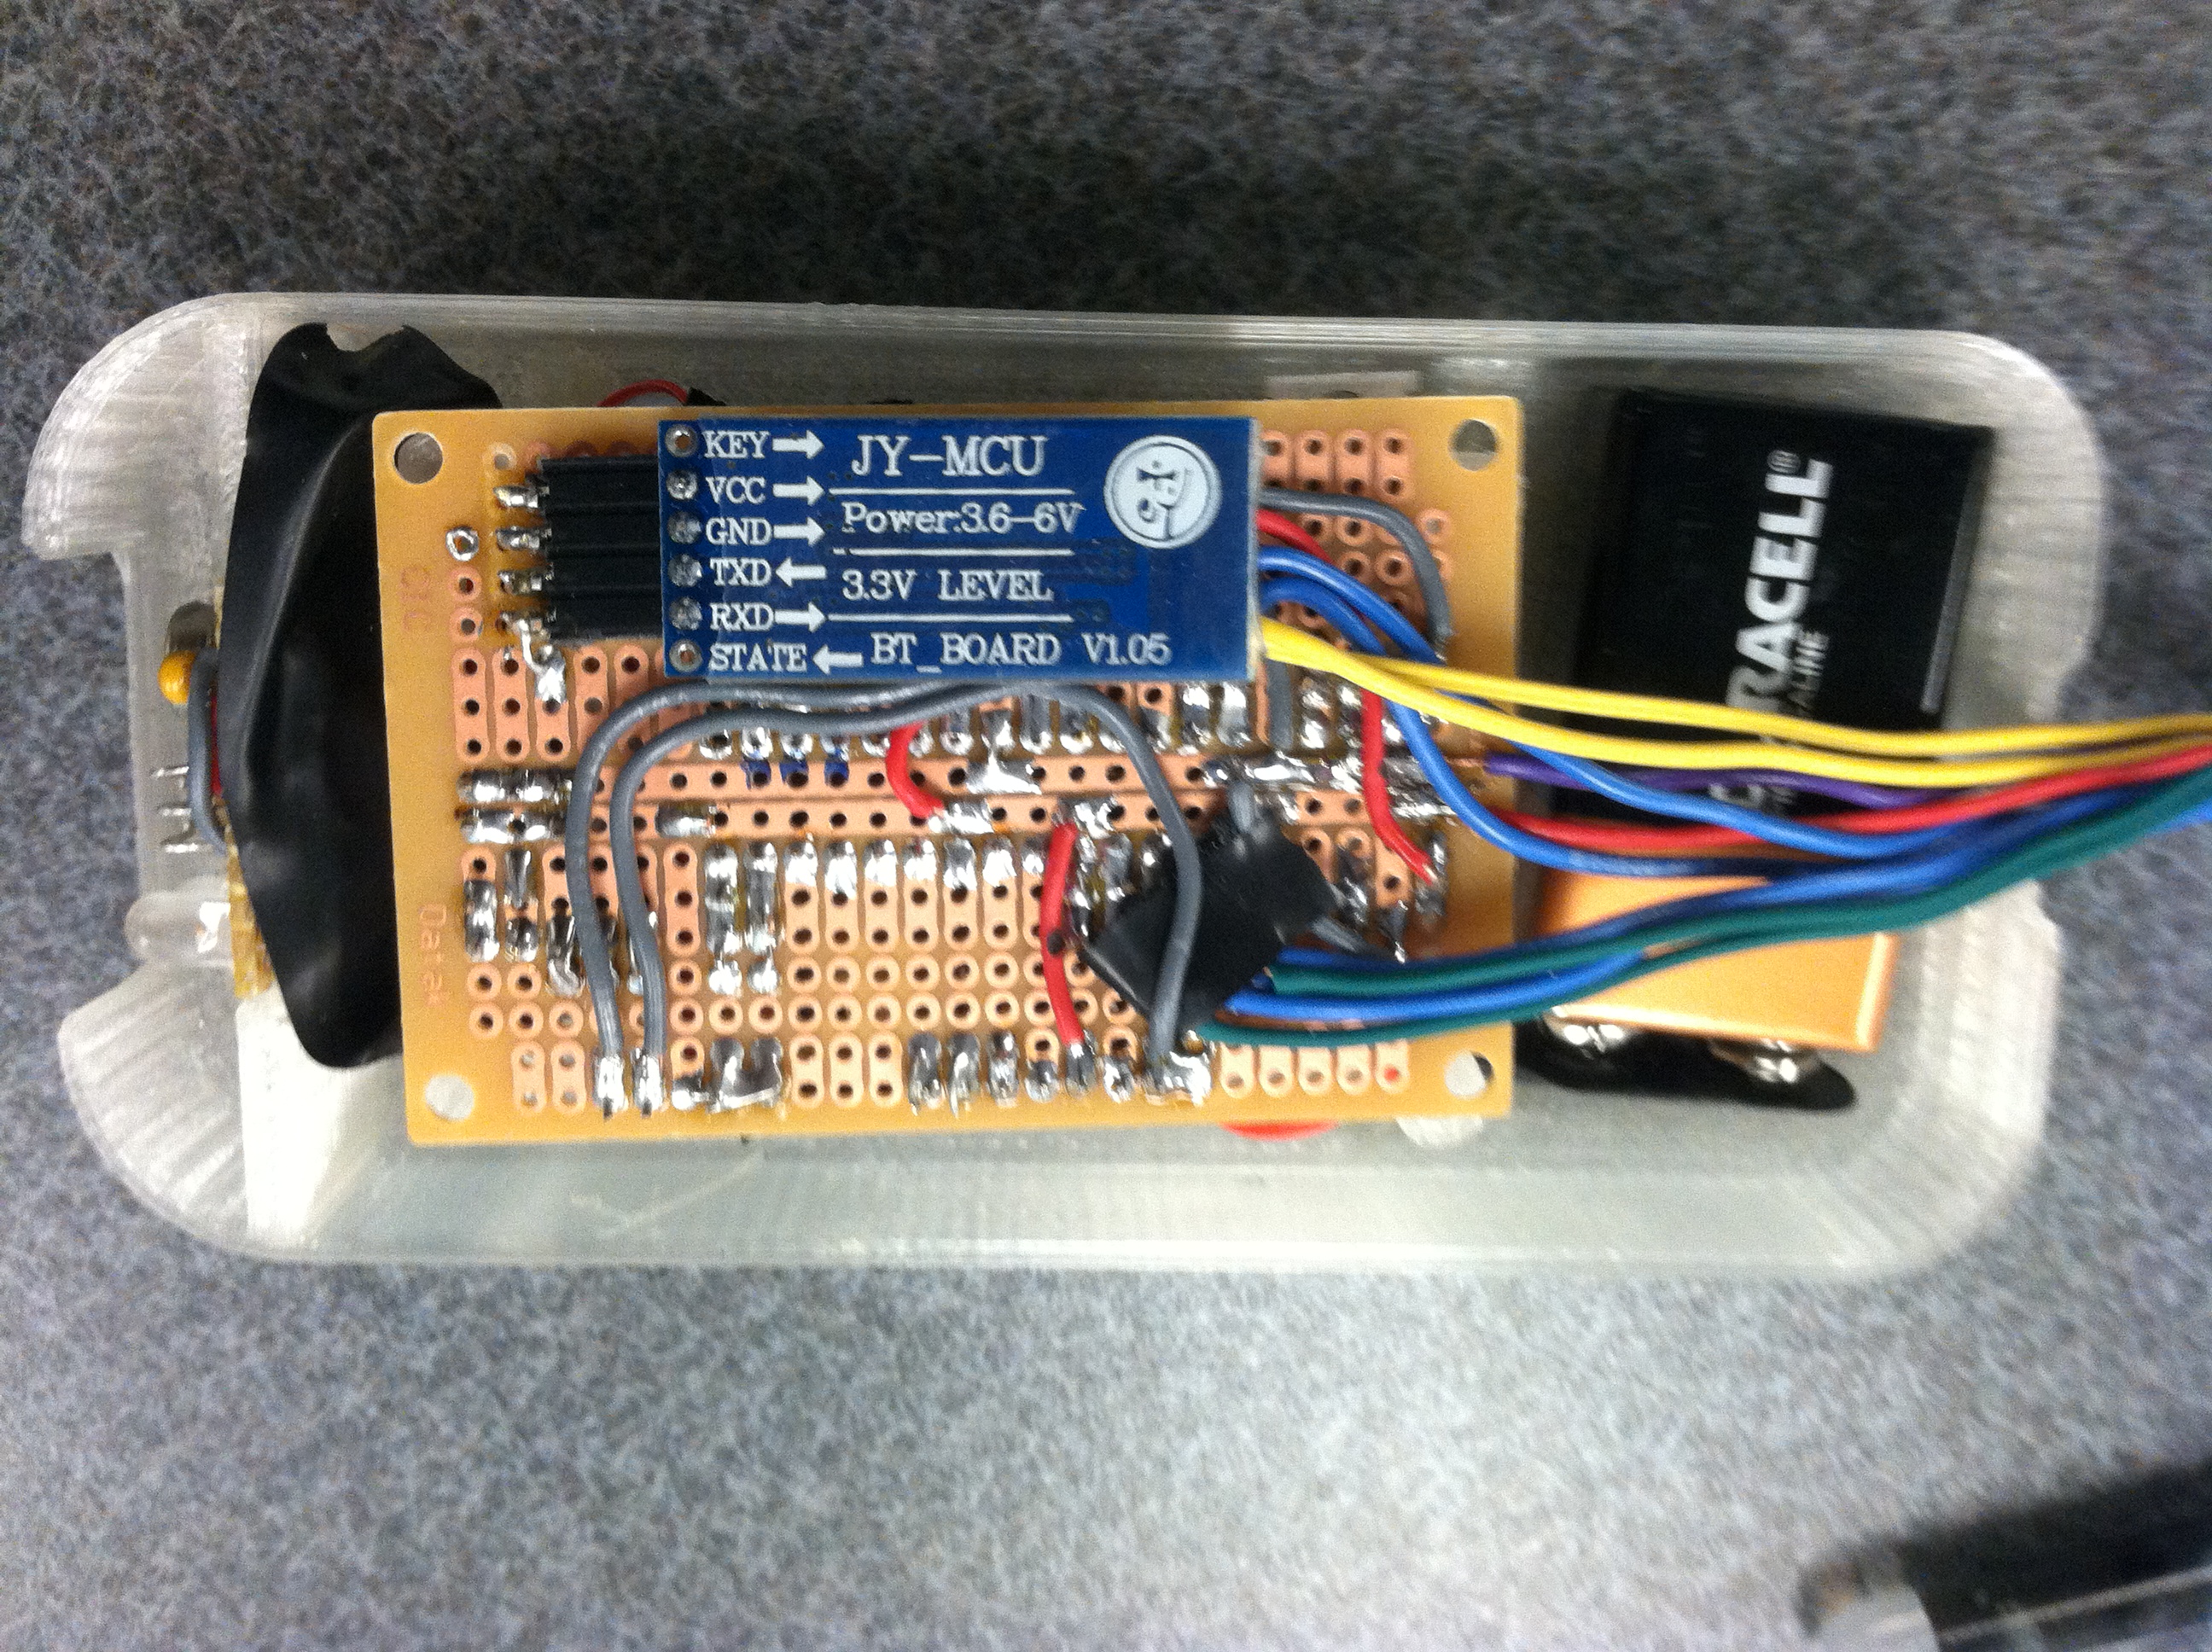
Bluetooth Module
The HC-06 Bluetooth module is shown in the image below. It is mounted underneath the main board and is connected to UART0 on the microcontroller. This module is paired to a PC that has Bluetooth connectivity via a USB dongle.
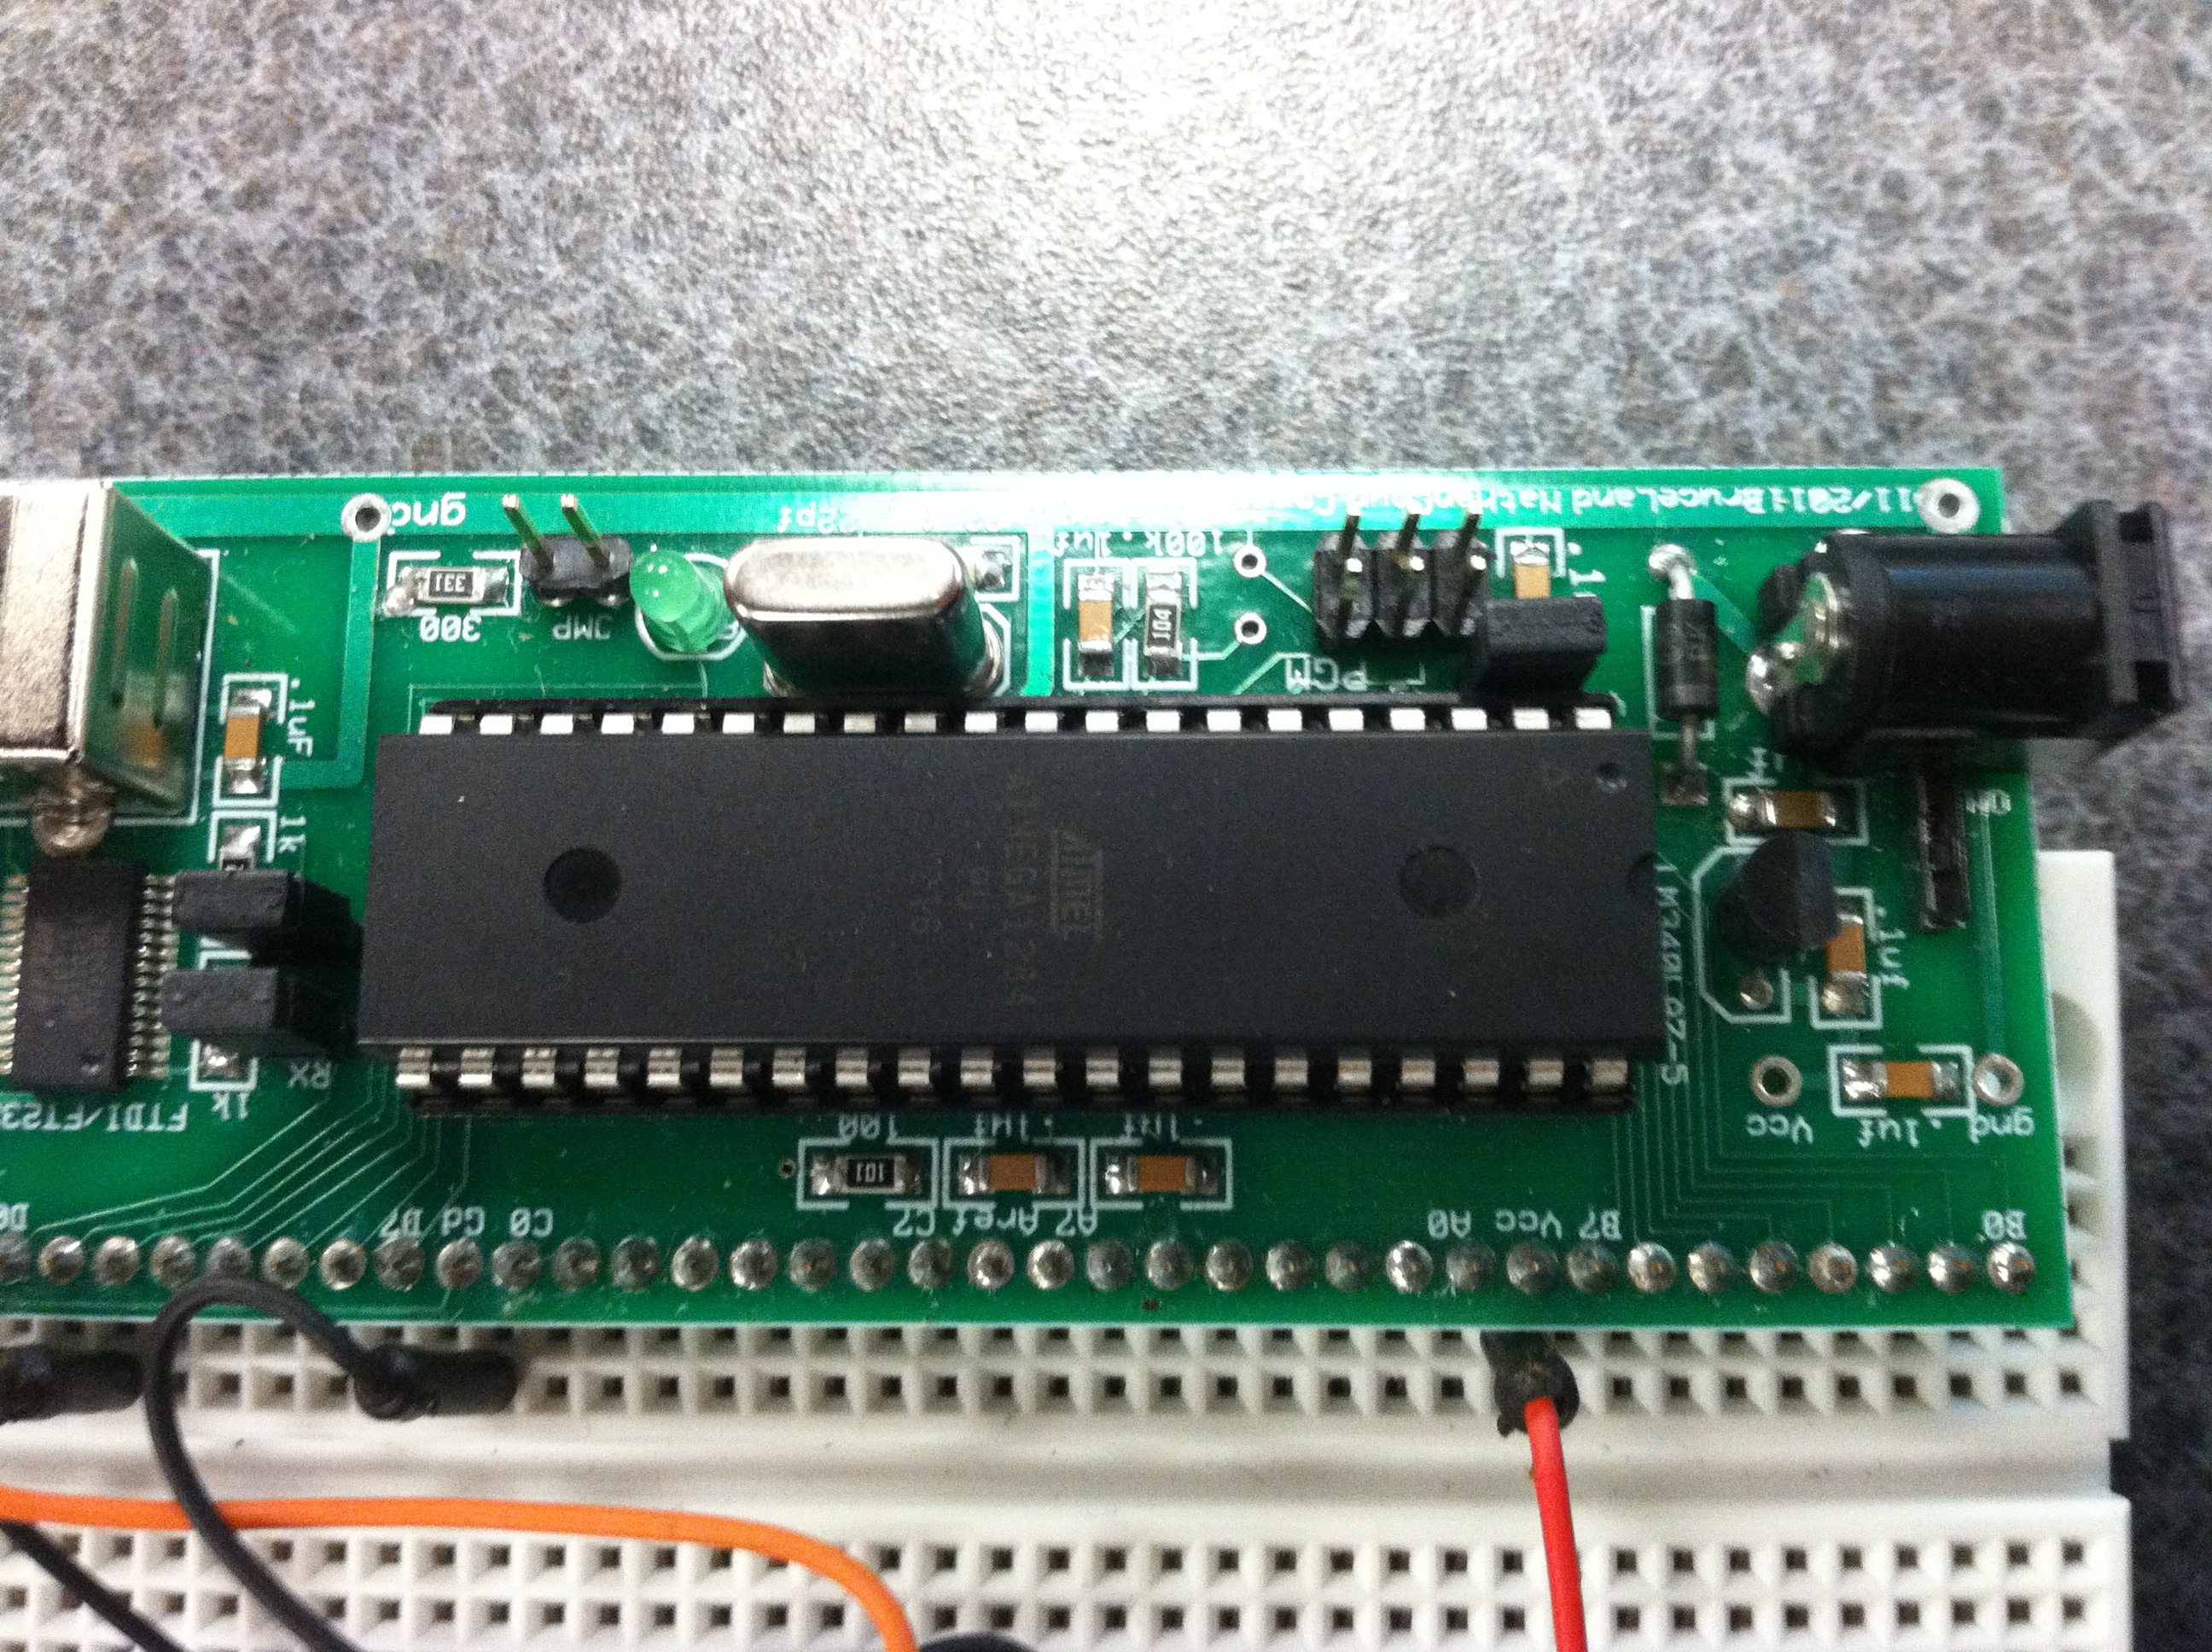
Atmega 1284p
The Atmega microcontroller is the brain of the device. All of the sensors and LEDs are broken out and connected to the microcontroller, which is connected to a white board. The unit is still on battery power, and thus the entire device is still wireless. We used the board provided to us for this class for this project.
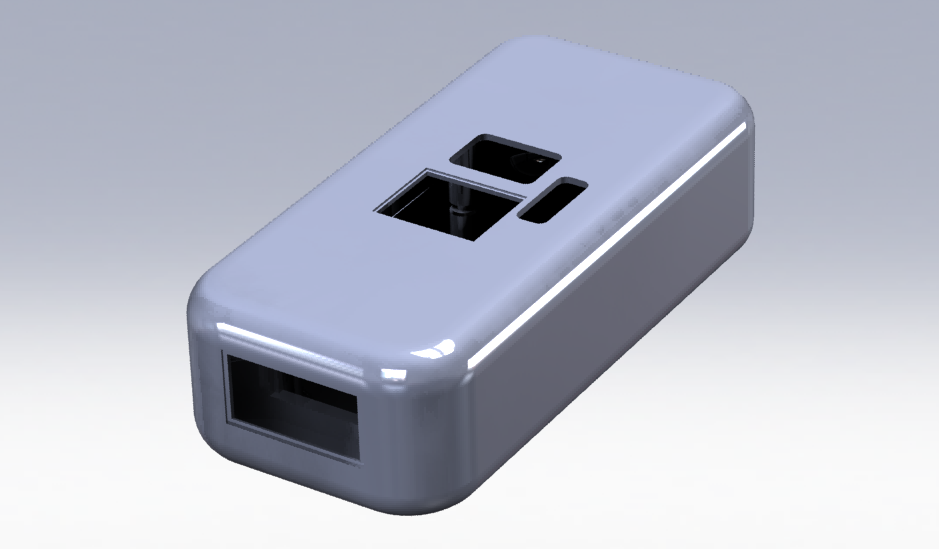
Physical Housing
The physical housing was designed in Solidworks and converted to an .STL file to be printed on a 3D printer. The housing includes ports for the light sensors and associated leds, as well as ports for a on/off toggle power switch and a momentary push button for user input. The ports are designed so a plastic window is mounted on top, so the user has a place to rest his/her finger on top to reduce movement during measurement. Later revisions of the housing will more properly shroud the sensors from ambient light by better enclosing the sensing areas. There was also an issue with cross-talk between sensors within the housing, so thicker isolation between light sources and light sensors will increase information gain.
Software top
Overview
The main tasks of our program included acquiring data from the light sensors, controlling the output of the LEDs, processing the acquired data and extracting measurements in real time, and transmitting the measurements to a PC for visualization with a GUI.
Digital Optical Data Acquisition
As described in the hardware selection section, we experimented with several light sensors for this project. The analog based I2C sensor required integration to stabilize the light reading to have a high enough signal to noise ratio to be useful. However, the minimum integration time for this was 50mS, which was too long since we required a high sampling rate for temporal accuracy. With the light to frequency converter, optical data acquisition methods always had a tradeoff between hardware requirements and software time constraints. In order to have a fast sampling rate with low signal jitter, we needed more hardware timers and a fast clock speed in order to process data accordingly. However, since we were constrained by the hardware on the Atmega 1284p, we had to make tradeoffs to using software solutions.
Our final optical data acquisition method used a mixture of externally triggered counters and internal timer interrupts in order to sample the number of pulses from the light sensors in a given amount of time. We used a total of four timers. Timer 2 and timer 3 were used for timekeeping. Timer 2 was set with a clock divider of 64 with an output compare register with value 249, in order to trigger an interrupt every 16000 cycles, or 1mS. This became the timebase for the system. Timer 3 was set as a precise 10mS timer, and since it is a 16-bit counter it can count to a higher value with minimal jitter. Timer 0 and 1 were both externally triggered by the light to frequency sensors. However, timer 0 is only 8-bit so the anticipated counts of approximately 300 per sample exceed the limit without overflow. As a result we added an ISR for the overflow of timer 0 to increment a variable which is later used to determine the final count of timer 0 after the sampling period.
Digital Signal Processing
Though our data acquisition methods were designed to reduce jitter and noise, the signals were still unstable. Since the data acquired was proportional to the total measured light, we needed to add a degree of high pass filtering in order to extract the AC values. In order to do this we created a moving average filter of 20 samples. To extract the AC components we then subtracted the original signal from the mean of the 20 previous samples in the moving average filter.
In addition, we needed to add a low pass element to the filtered data in order to smooth some of the high frequency jitter. To do this we additionally added a small 5 element low pass filter and extracted the mean of the samples. This effectively reduced the variability due to jitter and resulted in a stable signal.
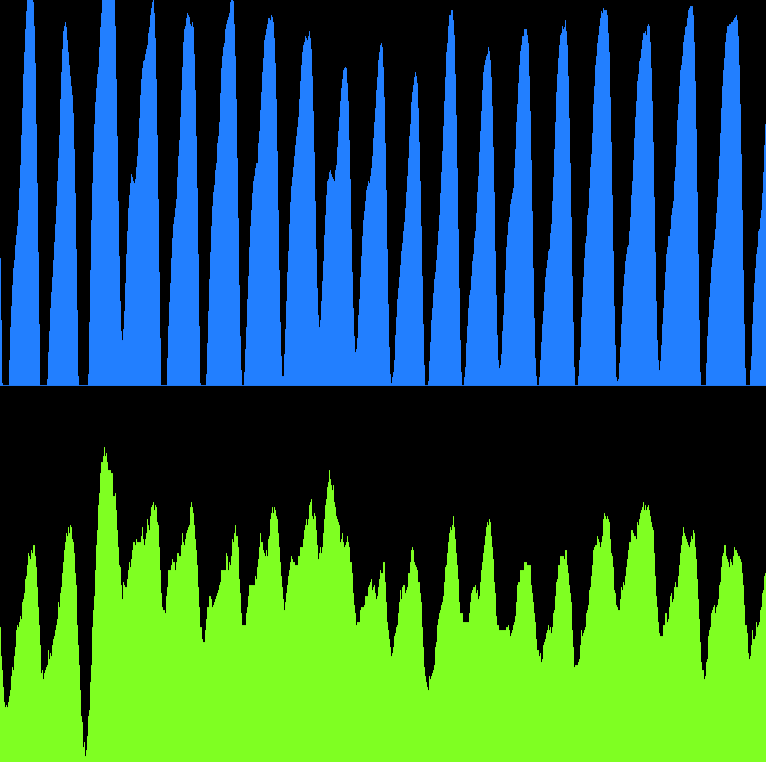
Filtered Signal acquisition
Peak Detection
In order to implement a reliable method of peak detection for this project, we went through several strategies of peak detection. Initially, we aimed to use thresholding to determine peaks over a certain size. We logged the max and minimum values sampled within a time period, then counted the entire pulse signal as a peak until the signal dropped below the minimum threshold. This approach had several disadvantages. By thresholding, slight movements by the patient could easily result to false peak detection. The max and min values sampled were difficult to extract especially if the range was constantly changing. Another downside was that additional time was required to sample for these max/min values.
Jitter from polling method
We also had to determine what would be considered the the actual peak of the data. If thresholding was used, and each peak was slightly differently scaled, the location of the peak on the waveform would vary. Other groups defined the peak point as a percentage of the total amplitude, or the lowest point in the signal. We decided upon the highest point in the signal to be considered the peak, because it would be the point at which the most blood would flow through the measured point. Other areas would possibly be inconsistent under different conditions.
To implement peak detection, we explored several other methods. We tried to use a state based approach, where we would look for points where the next new values read would decrease past a threshold number. This would detect local maxima, as the peak would only be detected when values were non-increasing and decreasing for threshold amount. However, the characteristic optical pulsatile signal sometimes included multiple peaks for the systole and the diastole. In addition, a little jitter might render the signal invalid.
We also experimented with taking the derivative of the signal to extract peak information with zero crossings. The derivative was taken by subtracting the signal with its previous sampled value. Ideally, when the derivative would be near zero, it would signify either a maxima or minima. We could then check the signage of the signal to specify a maxima or minima. However we did not use this method because the difference between samples was too great as our sampling rate was not high enough. The result of our 10mS sampling period was that the derivative signal was too jittery to use.

Derivative Method of Peak Detection
Ultimately, we were able to reliably detect peaks in a signal by finding the first local maxima in a positive pulse. The sequence waits in the first state if the signal is negative or zero, and changes state when the signal becomes positive. In this state, we check if the signal is increasing or decreasing. When the signal begins decreasing, we have detected the first local maxima, and a flag is set. In order to make sure the signal was not due to jitter, we increment a counter. When the counter is incremented a threshold amount of times and the values continue to decrease, the state changes to set another flag that a valid peak has been detected. This flag is reset when the signal returns to the original state when the signal drops below zero. We have found that this method works reliably with the optical signals, as it only counts a peak for the first major peak.
Final Data Capture
Bluetooth
For this project we used Bluetooth to communicate between our microcontroller and a PC application we created to display the collected data. We used the HC-06 Bluetooth to UART converter to transmit and receive from the microcontroller. A standard USB Bluetooth dongle was used to provide connectivity on the PC side.
To establish a connection, the HC-06 module must be paired to the PC manually since it is a slave only module. This was possible in Windows by installing the Bluetooth driver software and clicking “Add a Device” to search for available Bluetooth devices. If the HC-06 module is powered on, the device should show up as “Unknown” or “HC-06.” To connect, the initial pairing code “1234” can be entered to establish a connection. The HC-06 modul led would have been blinking beforehand, and should still be blinking until a connection is made to the designated COM port. The Bluetooth software should have designated two COM ports for the device, though the COM port specifying the computer initiated, transmit/receive will be the right one. From there, the Rx/Tx pins on the HC-06 pins can be connected to the UART pins on the microcontroller, Rx on the module to Tx on the microcontroller and Tx on the module to Rx on the microcontroller. Depending on the input module used, the HC-06 is also designated for 3.3V. As a result, the Rx line should be read fine on the microcontroller but the Tx line may need a voltage divider to not damage the module. We used a 100 ohm and 200 ohm resistor for this, and built the voltage divider with the Tx line as the source such that the output voltage was (Vtx)(200/(10+200)). Once a serial connection is established, such as with PuTTY, the blinking light should turn solid to indicate a connection. The Bluetooth module can then be used as an abstraction of a standard UART communication channel.
One problem we encountered with the addition of Bluetooth was that it interfered with our optical data acquisition. We discovered that though the Bluetooth module itself is relatively low power (max 40mA), some batteries cannot source enough current to the entire system to retain a stable signal. This can be solved by adding a large capacitor (10uF) and by adding another battery in parallel if necessary.
Graphical User Interface
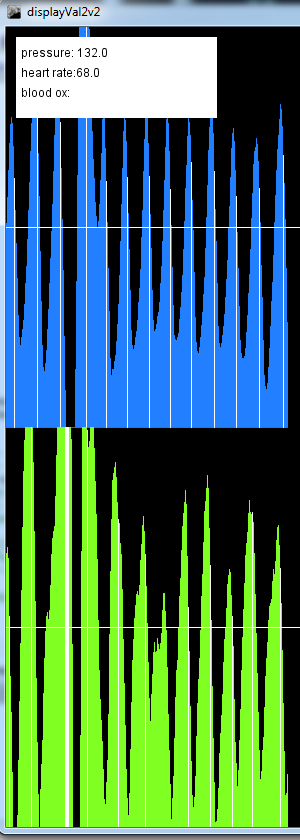
To visualize our collected data and aid with debugging, we created a simple GUI to use with the unit. The GUI was helpful to visually represent our peak detection and filtering methods, and also provides a convenient method to validate if the data collection is working. To implement the GUI, we used a visual Java IDE called Processing to quickly build the real time display. The program simply updates on each valid reception from the Bluetooth connection, delimited by a newline character. We transmit multiple variables indicating sensor readings and detected peaks for pulse transit time. We made a predefined packet structure and delimited between different transmitted variables with a space character. The transmitted variables are then displayed on the GUI, including the measured pulse transit time and measured heart rate.
Function Listing
uart_init, uart_putchar, uart_getchar
The uart functions were taken from Joerg Wunsch on Bruce Land’s ECE 4760 website. These functions are utilized for serial communication with a computer in order to send data to a GUI.
initialize
The initialize function initializes timer 0 and timer 1 to be externally triggered through pin B0 and B1, and both timers used overflow interrupt routines that extended the length of the counters to 32 bits. Timer 2 and 3 are initialized to count 1 ms and 10 ms. Timer 2 serves as a millisecond time base, while timer 3 serves as a counter that counts the number of clock edges from timer 0 and 1 in 10 milliseconds.
main
The main loop runs lightSensorCapture, filter the values with filterSensor, run peak detection on the two sensors using threshold1 and threshold2, calculate pulse transit time and pulse rate using ptt_calc and ps_calc, and send all relevant data using uart to the main computer.
lightSensorCapture
This function begins the 10 millisecond sequence that kicks off timer 3. Because we can run different biometric sensors at different times, we have a dead waiting while loop that waits until the timer has counted 10 milliseconds. Once the timer 3 interrupt occurs, this function records the number of counts from each of the light sensors in order to obtain intensity information.
filterSensor
The filterSensor function applies a running average filter and a mean subtraction filter to the acquired values.
threshold1/threshold2
These functinos run a state machine that checks to see if the intensity information changes from positive and growing to decreasing. This peak is then utilized by ptt_calc and ps_calc.
ptt_calc
This function uses the timebase to calculate the amount of time passed between the peaks of the two different sensors.
ps_calc
Similar to ptt_calc, ps_calc uses the timebase to calculate the amount of time between two peaks in the same sensor.
GUI Function Listing
main
The program itself displays a line scaled to the measured value in height on the screen, and increments its direction on every message received. When the counter exceeds the size of the GUI window, the screen is wiped and the display is reset at the initial position on the left side of the screen. In addition, other variables such as the PTT and heart rate are displayed as text in the left upper corner.
Modeling Blood Pressure
The pulse transit time alone can vary widely between individuals, and thus cannot be used as a direct substitute measurement for blood pressure. This is due to the variability in between people and their body types. For example, someone with short arms could register a shorter pulse transit time than someone with a longer arm with the same blood pressure. In addition, variabilities in health conditions or measurement conditions can change the relationship between PTT and blood pressure. To solve this, we created a linear model to approximate blood pressure based on a known calibration point.
We measured the blood pressure and PTT of a subject to create the base point for calibration, and used the generated model to predict blood pressure with the subsequent PTT measurements. Since blood pressure can be slightly varied depending on activity and position (e.g. doing a headstand), we could measure different ground truth blood pressures of the same patient. The blood pressure ground truth was measured with a standard inflatable cuff.
Results top
Overview
With our maximum sampling rate we obtained 5% accuracy with our pulse transit time. Due to the limitations of the microcontroller, we utilized a scheme through which we capture frequencies from the light to frequency converter that samples every 10ms, while pulse transit times are on the order of 200ms, thus our accuracy for pulse transit times and pulses are on the order of 5%. The filtering of the signal is very good, as we have a very clean signal, but we could obtain a higher accuracy if we obtained frequencies more accurately. With a higher clock speed we could create a control scheme that captures the frequencies at a faster sampling rate. Since we continually capture the data and process it, there is no problem with execution speeds and delays.
The pulse transit time data is also highly personalized, which is useful for our final machine learning goal. Variability amongst different people result in different associated blood pressures for each pulse transit time. As a result, a model must be made based on different body types and demographics in order to approximate true blood pressure based on pulse transit time. Since we have not yet built a large enough dataset to achieve this, we were unable to analyze the PTT data to fully predict blood pressure.
The device is fairly simple to use, as you only need to cover one part with your finger and hold the device to your neck to gather all readings.
There was an issue with interference with Bluetooth requiring too much current from the battery and reducing power to the LEDs. However, that issue was fixed with stabilizing capacitors and fresh batteries. The range of the Bluetooth was acceptable for our given operating conditions. We tested the range of the Bluetooth to around 20ft, and the signals were still valid. However, the intended usage of this device should always stay within several feet of the Bluetooth receiver, so further testing was unnecessary.
Accuracy of Model
To extract useful blood pressure information from the PTT, we created a regression model to predict blood pressure from pulse transit time. We used a standard cuff sphygmomanometer to measure systolic blood pressure (SBP). Since we did not have a stethoscope, we logged the systolic blood pressure as the pressure where the first peak from blood flow was visible. Diastolic blood pressure was too difficult to measure accurately without a stethoscope, and will be a topic of further study not included in the scope of this project. In order to remove outlier measurements due to movement, we took several blood pressure measurements at each reading and took the median value of the measurements as the valid reading. The same method was done for the pulse transit time, where measurements were taken until a series of precise measurements were taken. We then took the median of those measurements as the valid data point. This was necessary because of occasional invalid readings due to movement artifacts. Since our design requires the user to hold the device in one hand while positioning the two sensor heads, movement artifacts would be unavoidable.
The data was collected from a variety of conditions. The conditions include sitting, lying down, and sitting/lying down after various degrees of physical activity. As a result, we were able to collect data for a wider range of blood pressures with two test subjects. We used ourselves as the main test subjects for data collection, and created two models relating PTT and SBP. The extracted models are shown below:
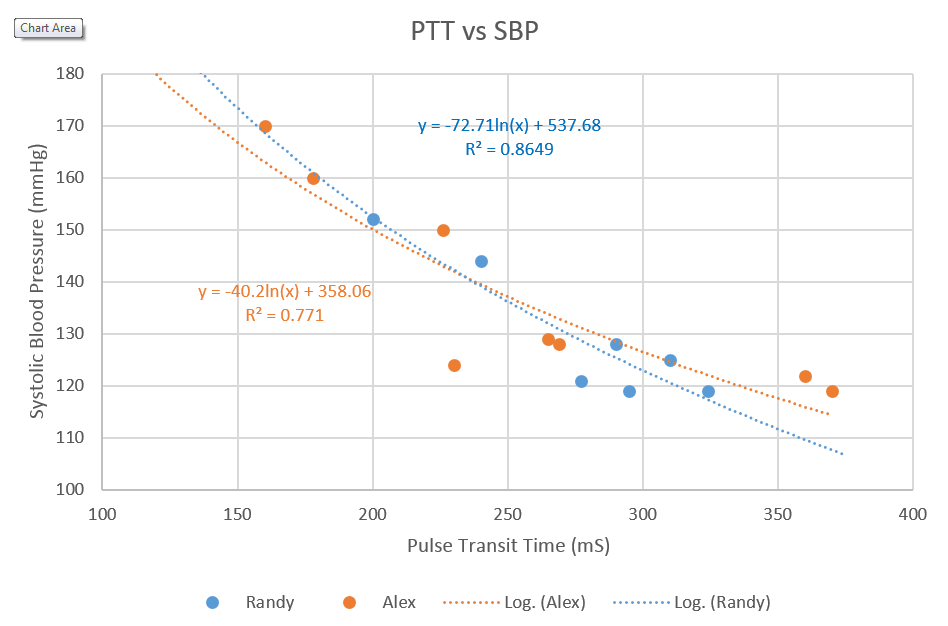
Model of Pulse Transit Time and Blood Pressure
The reason why this mode of blood pressure measurement requires some baseline measurement is that there are inherent differences in body types and measurement methods between people. For example, differences in arm lengths and body proportions can increase the path length and thus rescale pulse transit time accordingly. Factors such as height, weight, and BMI can influence the final measurements. Though we plan to use these factors in a later revision of the device to select a model, for this project we used the ground truth blood pressure with the sphygmomanometer to test the accuracy of the PTT measurements. Nevertheless, the different models correspond to each subject’s body type. In our collected data, we noticed that the models were not identical, though they were very similar. This is because both test subjects have very similar body types, heights, and lifestyles. These results suggest that the model could be used to extract blood pressure from PTT for other subjects with similar body types.
With these models, we can gauge the accuracy of our system. Since we run with 10mS sampling increments, we can use the model to find that the resulting accuracy of the systolic blood pressure is around 1.2mmHg/10mS sampling. This is fairly acceptable for gauging blood pressure, though it may not be as exact as different methods. This uncertainty error could always be decreased by increasing the sampling rate.
Safety
There are no safety concerns with our project. We are utilizing low power infrared lights that have no potential for damage. In addition, the device itself is battery powered, so there is no risk of electric shock from mains. We initially considered ECG (electrocardiogram) as a method of obtaining the initial heart pulse, but found that proper ECG would require wet electrodes to be attached to the skin. Since this added another layer of difficulty, which would make the process less appealing to an end user, we decided to not pursue ECG. In addition, electrical sensing modalities risked electrocution during usage and testing.
According to the ICNIRP Safety Standard, in order to prevent thermal injury in the cornea, infrared radiation exposure to the eye must be below E = 1.8*t^-.75 W * cm^-2. The user will be warned not to look directly into the device, and safeguards can be put in so that the device is only on for thirty second intervals. In thirty seconds, the maximum allowed radiation is 140mW * cm^2, and the amount of radiation emitted from the device will be a maximum of 80mW * cm^2 if the user puts the LED directly into their eye. In addition, the device is not meant to be shined into the eyes, so there should be no reason for this to occur. Likewise, in order to prevent thermal injury to the skin, H = 2 * t ^(¼) J * cm^-2. Conservatively estimating that the cross sectional area of skin exposure is 1 square centimeter, and that 80 mW of power is being emitted from the infrared LED and that their is perfect power transmission to the skin over 30 seconds, we have a maximum allowed value of 4.8 J/cm^2 and an actual value of 2.4 J/cm^2.
Usability
Currently, the device is portable but there are several wires protruding from the main device to the Atmega protoboard. In addition, due to the construction of the device and the sampling techniques utilized, we currently need close supervision to get good data without motion artifacts. Our device does not filter out results that are obvious outliers, but only averages the data so we do not always get very accurate samples. While we were testing, we had to hold the device to our necks very still to acquire a few decent samples, and we had to record samples of data that we knew were accurate readings while rejecting motion artifact corrupted data.
The way the current device is configured, a user must place his or her index finger on the top facing window of the device. Next, the user must point the front window at his or her neck. Currently, in order to get accurate readings, the user must take a deep breath, and slowly exhale. The readings while slowly exhaling are the most accurate. For best results, the user may have to adjust the placement of the forward facing window, as it must be pointing directly at a larger artery.
Example of Usage
Interference
Since the HC-06 Bluetooth module conforms to the standards set by the Bluetooth Special Interests Group, it is within the allowed transmission power levels and does not have a problem with interference with other devices. In addition, the device must be paired to the PC manually before use, so it will not interfere with other HC-05 or HC-06 modules in proximity.
Conclusions top
Analysis
In the end, we obtained adequate results that serve as a proof of concept for an optical blood pressure and heart rate monitor using digital signals processing. Our results show the correlation between Pulse Transit Time (PTT) and Blood Pressure, giving us a good stepping stone towards making a general health metric acquisition device. Although we would need more data from patients of different body types, we show that for certain body types it is possible to acquire some level of accuracy utilizing PTT. We processed the data in real-time so that we could analyze the data. We have learned what physical constraints we meet using the ATMEGA1284p, and how effective the sensors we utilized are.
Now that we have run rudimentary validation on our PTT measurements, we wish to refine our acquisition methods as well as begin creating a more user friendly interface. Currently, the device itself is not very user friendly as we have not soldered the microcontroller directly into the device. In addition, the GUI can only display data, with no options for saving or acquiring data. We wish to include these features with our device.
From our experiments with our device, we noticed several areas that need improvement for future work on the device. Due to the nature of our PTT measurement and the 10mS sampling increments, faster pulse wave velocities result in lower accuracies in PTT. As the PTT approaches small numbers, the percentage of uncertainty due to the sampling rate increases. Our device thus works less effectively for people with lower PTT and correspondingly with higher blood pressure measurements.
In addition, many of the measurements we gathered were invalid due to some inaccuracies with peak detection and movement artifacts. These invalid results could be easily removed since the invalid measurements were much different than the correct measurements. We could easily remove outlier data points due to deviation from the median and retain only valid values. In addition, we could remove data points that are larger than a certain threshold. However, without these countermeasures the measurements were often skewed and inconvenient as we had to manually stabilize the device to reduce movement artifacts. To remove some of the movement artifacts, the optical sensors and emitters could be moved closer to the surface and a non infrared blocking plastic should be attached to the front sensor window. In addition, shielding from external sources of light and an opaque shielding would create a less noisier signal.
For further development, we wish to use a more powerful microcontroller with more precise timing so that we can acquire a higher precision when calculating pulse transit time. We also want to include an acquisition mode on the device that acquires data for a set amount of time so that the LEDs would not be sourced when the device is not in operation, as they a heavy amount of power from the battery. Last, we want to explore how to shield our signal from noise that is received from the bluetooth module. Currently, we cannot use bluetooth for realtime data acquisition because of noise.
Standards
Our bluetooth HC-06 module follows the Bluetooth Special Interest Group standards. It connects to our microcontroller through UART. We utilized a USB dongle to establish the Bluetooth connection on the PC side, with the communication done via serial.
Universal Serial Bus (USB) is a communication standard utilized to connect computer peripherals to personal computers. We utilize USB to connect the microcontroller to a personal PC utilizing an FTDI chip, where we communicate via UART with the computer.
The C code in our project abides by the C Language standards set by the ANSI (American National Standards Institute) and the 1666-2011 IEEE Standard System Language.
Intellectual Property
We have not used any other people’s code, other than common AVR libraries and the UART Beerware, so we owe that guy a beer. We have done adequate research and determined that none of our hardware has been patented.
Currently, there are no existing patents on optical methods for blood pressure detection. Other research papers discuss utilizing optical methods for detecting blood pressure; however, we may be able to patent the specific approach we utilized in order to detect blood pressure. The techniques behind digital optical cardiac plethsymographs have been well known and are publically available.
One of the aims of our product is to create a data acquisition device for consumer use. We believe that there are significant publishing opportunities, both in investigating the usage of optical signals for obtaining blood pressure readings and tracking of overall health patterns over longer periods of time.
Ethical Considerations
The decisions we made while developing and testing our product, and the goals we have in sight for future considerations are consistent with the IEEE Code of Ethics. We accept responsibility concerning the safety and welfare of the public concerning our device. If any further developments are made concerning its safety, we will take steps to notify any possible users of any dangers. We guarantee that all gathered data is accurate, we have not made any false claims concerning the data. Currently, the product is not accurate enough to be used as a diagnostic device, and is not intended to be used for monitoring biometric signals in its current form, but improvements will be made to increase the accuracy of our models, and we will publish our results when available.
Guidelines will be given with our product to ensure its safe use. Currently, all LEDs are powered at acceptable levels (<50mA) that guarantee no harm to skin or eyes, although direct eye contact is not advised. There are no environmental hazards of our product.
The initial purpose of this project is for educational and research purposes, used as an initial stepping stone for the acquisition of biometric data. We will seek and accept any criticisms of our product and will continue upholding the IEEE code of ethics as we work on our product.
Appendices top
A.1 Program Listing
Please email rs644@cornell.edu or asn54@cornell.edu if you would like to see any part of the code!
A.2 Schematics
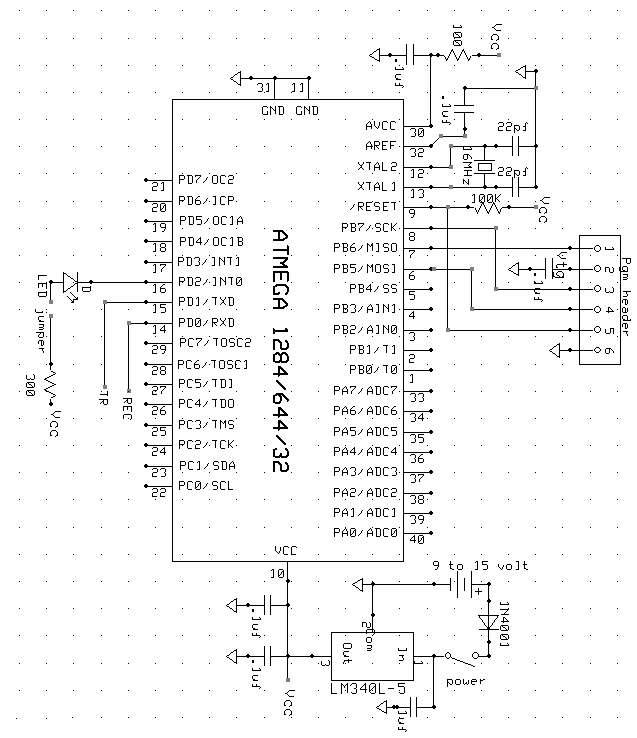
ATMEGA1284p Schematic (Courtesy of Bruce Land)
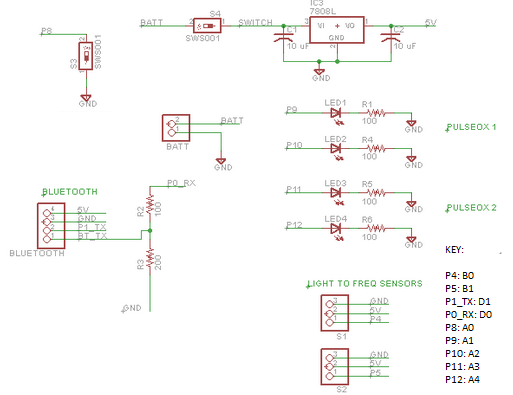
Main Schematic
A.3 Parts List and Costs
| Part | Vendor | Cost/Unit | Quantity | Total Cost |
|---|---|---|---|---|
| 9v Battery | Target | $1.57 | 1 | $1.57 |
| Prototype Board (Atmega 1284) | Lab Stock | $15.00 | 1 | $15.00 |
| Header Pin | Lab Stock | $0.05 | 40 | $2.00 |
| White Board | Digikey | $6.00 | 1 | $6.00 |
| Breadboard | Lab Stock | $0.00 | 2 | $0.00 |
| Momentary Push switch | Digikey | $1.00 | 1 | $1.00 |
| Toggle switch | Digikey | $1.50 | 1 | $1.50 |
| 5V Regulator | Digikey | $2.00 | 1 | $2.00 |
| Wires Resistors | Lab Stock | $0.00 | Many | $0.00 |
| Capacitors | Lab Stock | $0.00 | Many | $0.00 |
| LEDS | Lab Stock | $0.00 | Many | $0.00 |
| Bluetooth RS232 TTL transceiver | Dealextreme | $6.80 | 1 | $6.80 |
| Infrared LED LTE-4208 | Digikey | $0.50 | 2 | $1.00 |
| TSL235R Light to Frequency Converter | Digikey | $3.00 | 2 | $6.00 |
| Kinivo USB Bluetooth Dongle | Amazon | $15.00 | 1 | $15.00 |
| 3D Printer Filament PLA | Makerbot | $25/kg | 100g | $2.50 |
| TOTAL: | $60.37 |
A.4 Division of Labor
The group had a very fair division of labor, with both group members contributing to most aspects of the design.
Alexander Ngai
- General Hardware Design
- Soldering
- Digital Filter Designs
- Bluetooth Design
- GUI Design
- 3-D Housing Design
- Website Design
Randy Song
- Machine Learning Research
- Soldered Circuit
- Peak Detection Task
- General Debugging
- Website Design
A.5 Initially Proposed Project
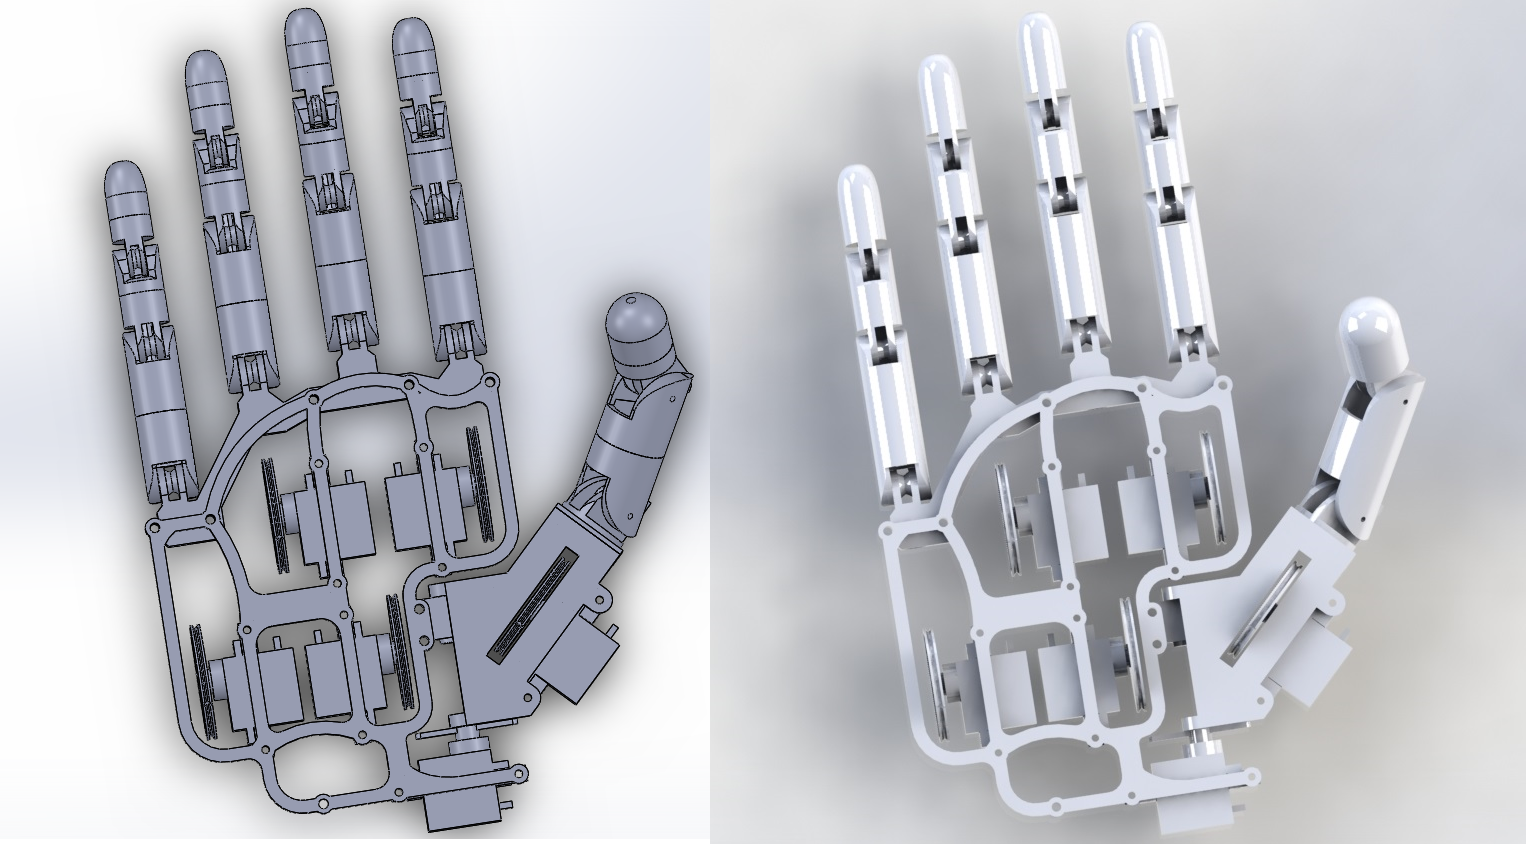
We initially planned to pursue a prosthetic hand that was controlled by muscle movements. The hand would be 3D printed and controlled via “tendons” connected to servos on the hand. The control scheme would be by EMG (electromyogram) with electrodes placed on the surface of the hand. However, due to safety and testing concerns we did not pursue that option and instead focused on optical methods. We were also concurrently building a product for the ECE Innovation Award that we started this semester. Since we were already working on the project, we switched to the blood pressure meter in order to add additional functionality on the device we were already building. As a result we switched our direction to the noninvasive blood pressure monitor. While we were working on the prosthetic hand, we were able to design and build the hand, as well as assemble the hardware. We were also able to acquire signals for an optical EMG, though we did not do the appropriate signal analysis to extract muscle flex information.
References top
Acknowledgements top
We would like to thank Professor Bruce Land for teaching us that debugging complex state machines with LEDs is not the most efficient way to go about it, and for also teaching a great class. We would like to thank the staff of ECE 4760 for putting their time into teaching us about all the odds and ends of microcontroller based design, and for keeping the labs open at all sorts of unholy hours of the night. Also thanks to Cameron for letting us use his template! And thanks to Roland for dealing with our crazy antics!