Doppler Radar for Collision Avoidance
by Mayur Patel
ECE 4760, Fall 2014
Contents
Hardware and
Software Tradeoffs
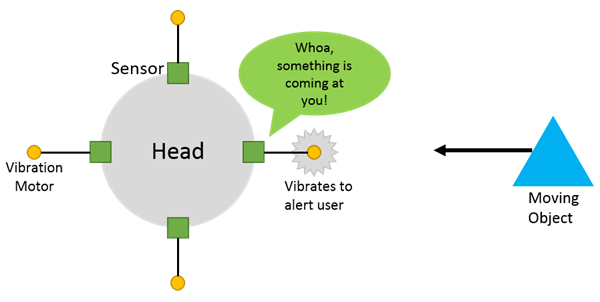
Figure 1 General Concept of
Functionality
My project uses Doppler radar sensors in order to provide the
user with movement, speed, and distance information of their environment. An
array of Doppler radar sensors are placed on the user’s head and vibration
motors are placed on the user’s chest, neck, back, and/or arms in order to
provide input to the user without impeding any of their other senses. When
something moves within about 25 feet of the user, the corresponding vibration
motor for the particular direction relative to the user where the movement was
detected will activate with a certain intensity to indicate how far away the
movement was detected. In cases where an object is moving rapidly towards the
user at a high speed, an emergency notification is sent such that all motors
are activated and will pulse, while the motor corresponding with the direction
the danger is in will be continuous and at a higher intensity to alert the user
to where the danger is.
The reason for this project is that from looking at new
safety features being implemented in cars such as forward collision warning, I
found a great opportunity to use a similar technology to provide almost another
sense for people that may be walking, bicycling, or otherwise. This project is
intended to provide added safety to users in multiple situations. For example, this
can provide added comfort and safety to users walking at night by alerting them
towards anything they may not be able to see. In addition, when walking on the
street, this can alert users of bicyclists or electric vehicles coming from
behind that they might have not noticed. Lastly, this can also be used for
those who have visual or audio impairment by provided extra information about
their surroundings to improve their safety and comfort. For example, this
project also allows users to be able to detect that they are walking towards an
object like a wall, and can help avoid walking users from colliding into
things.
It is becoming increasingly interesting to have wearable
technology, but one type, we have had for decades: technology to help the
health and safety of people. This is just another kind of wearable device that
can help many people in their daily lives. Inspired from safety technology in
modern cars that car alert, and even prepare the car for dangers. One such
system is the forward collisions warning or mitigating system that detect an
imminent crash and can even help prevent it. With more and more people
including wearable technology into their daily lives, this would be a great
opportunity to integrate technology similar to the forward collision warning
system, but for people. Not only would this device be useful to those with
visual or audio impairments by providing almost another sensor to them, but
also any other person in their daily lives. Walking at night can be
uncomfortable and with very quiet hybrid and electric vehicles, it is difficult
to sense the presence of them, which can lead to dangerous situations. This
system helps provide extra information from every direction. However, we do not
want to impede the user. For example, blind people heavily rely on their
hearing to be able to understand their surroundings. This should not impair
their hearing, perhaps by requiring their use headphones, as that takes away
from their sense of their surroundings.
The main piece of information required is that Doppler radar
implements the Doppler shift effect. This means that the results we get are
relative to the user. So, if the user is stationary and an object is coming
towards the user, or if the object is stationary but the user to moving towards
the object, we get, for all practical purposes, the same result.
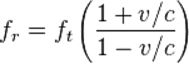
Here, ![]() is the original microwave frequency emitted by
the sensor, which is at 10.525 GHz. Using the second equation as an
approximation, the return frequency
is the original microwave frequency emitted by
the sensor, which is at 10.525 GHz. Using the second equation as an
approximation, the return frequency ![]() is just a function of the original frequency and
the relative velocity of the object. This is the fundamental property that
allows both an object moving and the user moving to be essentially the same;
thus enabling both collision avoidance and obstacle avoidance.
is just a function of the original frequency and
the relative velocity of the object. This is the fundamental property that
allows both an object moving and the user moving to be essentially the same;
thus enabling both collision avoidance and obstacle avoidance.
Approaching the design of the project, it is important to
first create an overall structure. For this project, there were two logical
components: the sensor system, and the notification system. In addition, both
of those systems are divided into the hardware and software systems. This
division not only has helped in the process of developing, testing, and
developing the project, but also modulizes the components so they could be
upgraded or changed in the future. In real development, this modularity was
actually kept up; for example, the vibration software is completely separate
from the sensor software and, instead, provides an easy to use interface to the
sensor software to control the vibration motors.
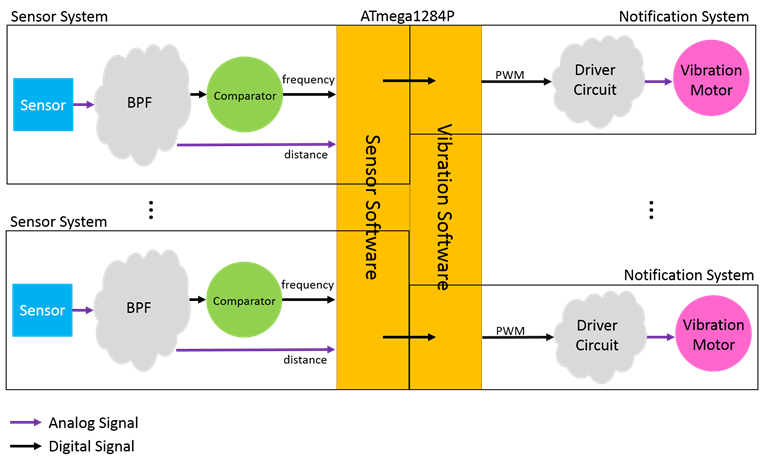
Figure
2 Logical Layout
of System
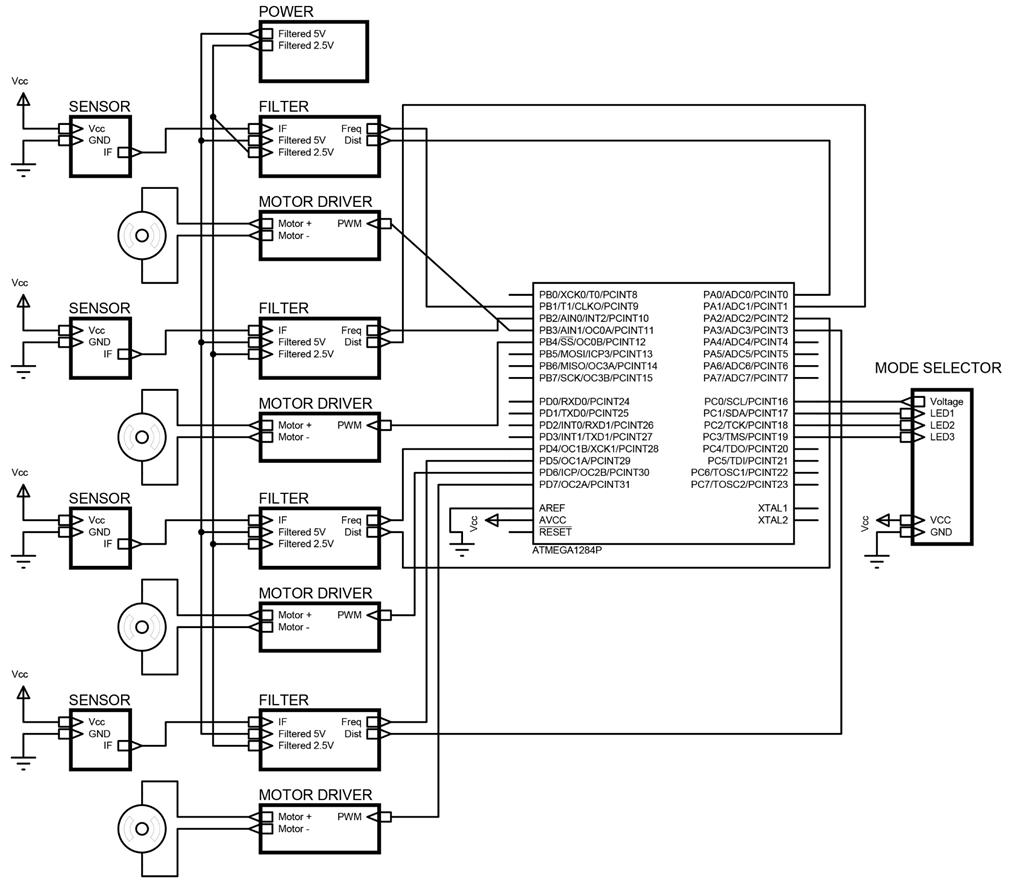
As shown in the figure above, the sensor provides an IF
(intermediate frequency) signal to a band pass filter, which not only filters
the frequency but also greatly amplifies the signal. The distance can actually
be taken from the band pass filter, as it is just the voltage of the signal. The
output of the band pass filter is also fed into a comparator, which outputs a
0-5V digital signal for movement changes. The higher the frequency of change,
the faster the object is moving. These two signals are fed into the
microcontroller, an ATmega1284P in this case. The sensor software measures the
frequency using timers and distance using the ADC. It then determines the
current situation and invokes vibration motor control functions. The software
changes the PWM output for each of the vibration motors periodically using the
input from the sensor software. The PWM drives a simple motor driver circuit
and invokes the motor to vibrate. Each sensor has a corresponding vibration
motor.
In addition to the core of the project, the extra piece is a
mode selector. The mode controller’s hardware is composed of a push button and
three differently colored LEDs for status indication. Pushing the button will
cycle through the three different modes: normal mode, near distance mode, and emergency
only mode. Each mode has a unique LED color to indicate to the user. This
system simply adjusts the sensor software to only trigger the vibration
software when certain conditions are met. This allows for more use scenarios as
normal mode might be too informative in certain situations. For example, for
most people, it is not an issue to be notified of every movement around them as
they walk through a busy street; in this scenario, emergency only mode is much
more appropriate as it will only alert them in dire situations.
One of the major engineering decisions that need to be made
is how much to do in hardware and how much to do in software. For this project,
I opted to use each of their strengths as a basis of how I split apart the systems.
In terms of signal filtering, I could have implemented it in both hardware and
software. However, to be precise with the IF signal on the magnitude of
millivolts, I would have needed much more than 10 bits of data from the
internal ADC to be able to read the IF input. In addition, this imposes
processing delay. Analog on the other hand was a much better choice because it
is able to process it instantaneously for all practical uses and it was not
limited by a finite resolution ADC. For the sensor information processing,
software was an obvious choice. This can actually be implemented in digital
hardware using basic logic gates, registers, and counters; however, the
hardware would require too much space and would be difficult to change or
upgrade.
There were also compromises required in order to produce
manageable results. The sensor provided information from relatively large
distances (about 25 ft.), permeates through many materials such as wood and
some metal, and, with the high frequency of 10.525GHz, can detect very small
movements as well. However, in order to actually make sense of the signal, it
required a sensitive signal processing circuit which required a lot of
calibration, a very consistent power source, and was fairly large. It would
have been possible to use ultrasonic sensors with much less signal processing
requirements; however, this greatly reduces resolution, permeability, and
distance. For a system that should warn a user about an incoming collision, it
is necessary to warn the user much earlier as it takes time for humans to
respond, and ultrasonic would not have enough distance and resolution to
provide the couple of seconds that people need to react.
As with any project, the IEEE Code of Ethics is always
relevant. Being a relatively-long term project, it is always a good idea to be
aware of the safety of others, good social conduct, and honesty. In addition,
there are other standards to comply with is the frequency for the microwave
sensor. The module complies with FCC rules, Part 15, Section 15.245, which
talks about radiation emissions. In addition, falling under the “motion sensor”
category, it must comply with the specified frequency for the US, which is
10.525 GHz. The specific module used compiles with both of the standards. The
module is QC passed, so it has been verified to meet these standards. Lastly, I
complied with the ISO C90 standard in which all variable declarations are done
at the top of a function. This is done to follow convention and to allow anyone
reading the code to be able to quickly reference the variable declarations in a
consistent spot.
There have been some similar implementations as this;
however, the form factors, interfaces, and technologies vary widely. Some such
implementations include a single sensor in a cane to detect movement in front
of the user, and a belt to detect movement around the user. However, none have referenced
using Doppler radar or as many use cases as this project. For example, the cane
can only sense ahead of the user, and is generally only useful for those who
carry canes, and the belt would get a lot of user interfaces since the arms and
hands tend to stay at about the waist level. In addition, none have reference
multiple modes, or any user interface at all, include how they notify the user.
Thus, I concluded there is no patents, trademarks, and copyrights relevant.
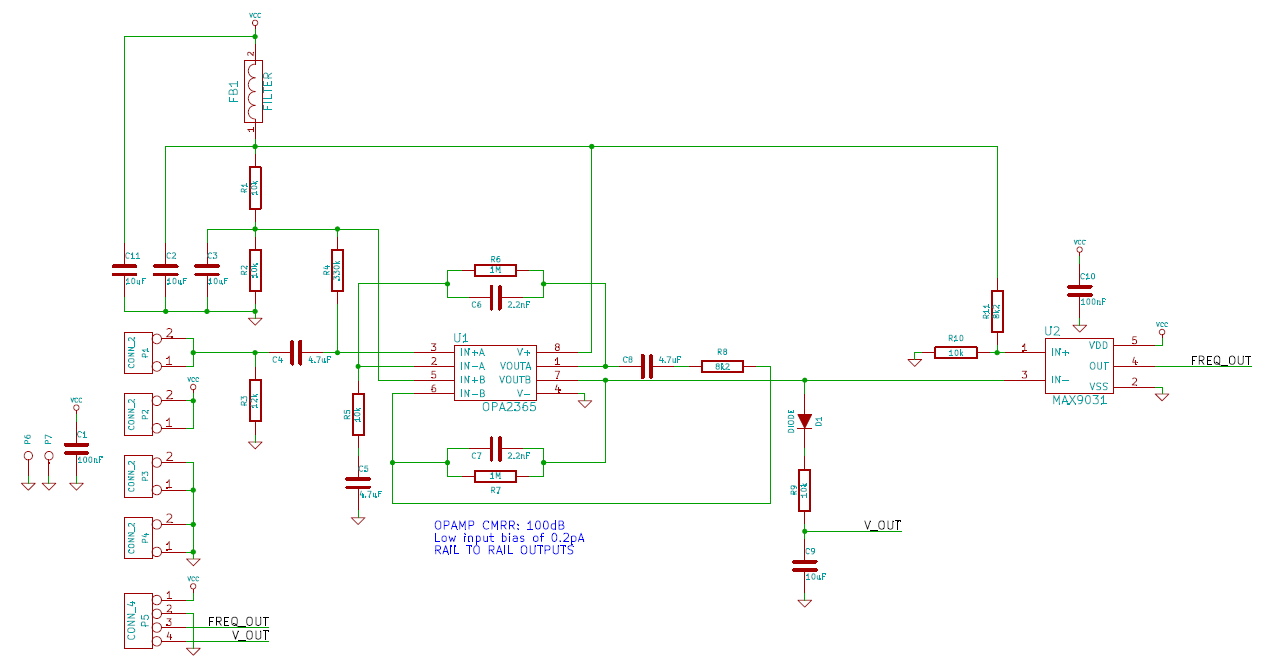
The high level circuit diagram is included in the Appendix. Since the ATmega1284P only has 3 regular interrupt
ports, I used the pin change interrupt ports instead. From the sensor system,
the frequency outputs were connected to pin change interrupt ports. In order to
help with both wire and software organization, two sensors were designated to
port B pins and the other two to port D pins. The distance readings require the
ADC, so they were all connected to port A pins. Lastly, the vibration motors
PWM ports where attached to the PWM pins for the designated port. So the first
two sensors (designated to port B) used B.3 and B.4 for the PWM and the other
two (designated port D) used D.6 and D.7 for the PWM.
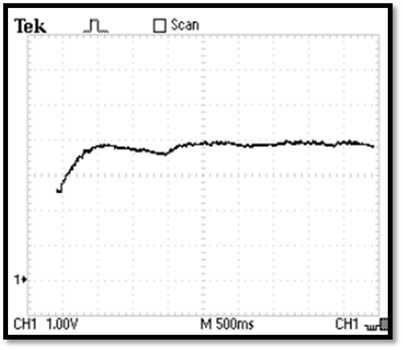
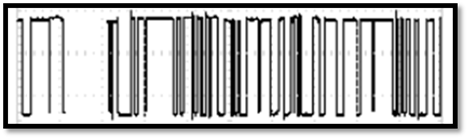
As previously mentioned, the sensor system requires a band
pass filter and a comparator to output an analog signal for distance and a
digital signal for frequency. Not only does this require frequency filtering
and amplification, but also noise reduction. Since the IF signal shown below is
just a few millivolts and very susceptible to noise, it is important to have a
consistent circuit. Note that the signal almost consistently stays within a
20mV peak-to-peak and that moving something in front of the sensor causes only
about 2mV difference in the signal. Also note the time base, with is 50ms per division. The signal is constantly changing, even at
this fine granularity.
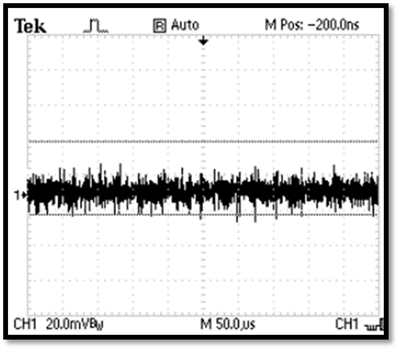
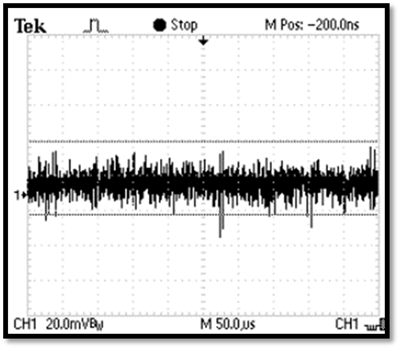
Figure
3 Raw IF Signal
from Doppler Unit. (1) No movement. (2) Hand moving directly in front of
device.
As a basis, I used Mathieu Stephan’s circuit and swapped out
some parts and made some changes to better fit this project. The circuit
composed of a small power circuit that provided a capacitor charged filtered 5V
and 2.5V power source, and, for each of the four sensors, a two stage band pass
filter and comparator.
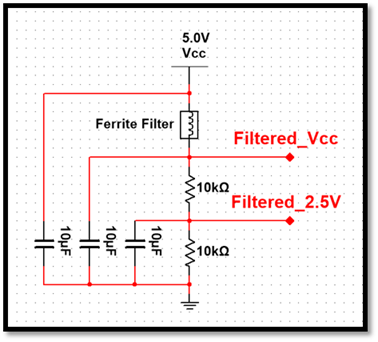
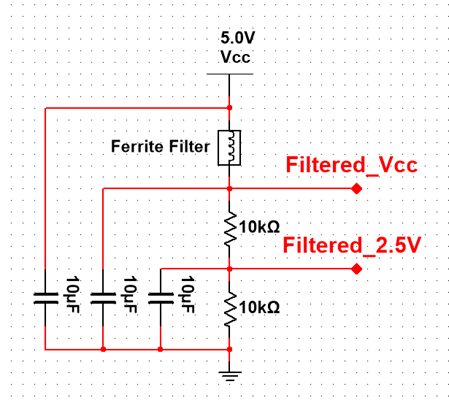
Figure
4 Power
Distribution Circuit
As shown to the right, there is a simple power circuit that
filters out high frequency noise, stores charge in capacitors in order to
provide a consistent voltage, and also goes through a voltage divider that
outputs a simple 2.5V. I included just one of these circuits in the system to
provide the power to all of the filtering circuits.
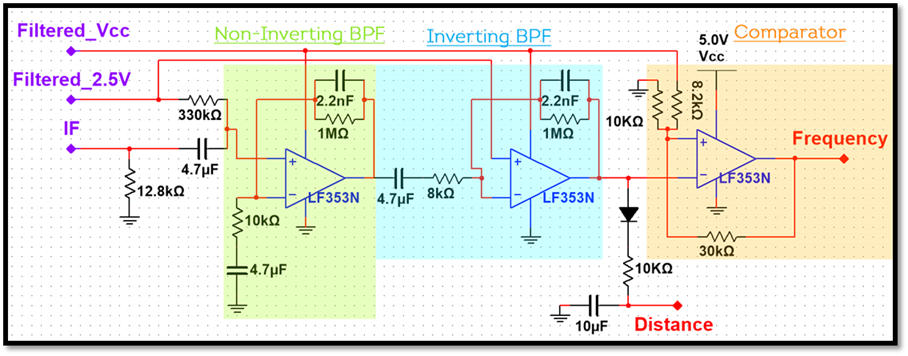
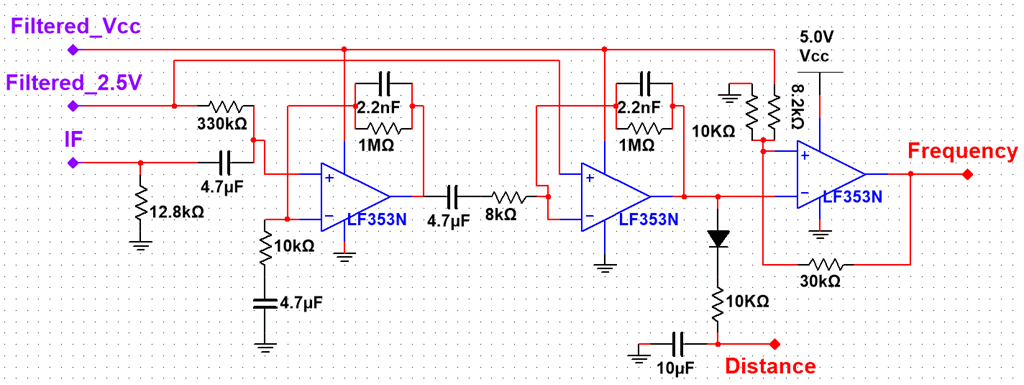
Figure
5 Sensor
Filtering Circuit
Each of the sensors had a filtering circuit to output an
analog distance measure and a digital frequency measure. In the figure above, I
highlighted parts of the circuits to help break apart the circuit into more
understandable parts. First, the purple nodes on the left are inputs and the
red nodes on the right are outputs. First, the non-inverting BPF (band pass
filter) and the inverting BPF provide precise filtering and high amplification.
With a two stage filtering system, we add more poles and zeros to create
ascends and descents our Bode plot. This first filter passes between 3.39 Hz
and 72.34 Hz. This is derived from the formula below such that the 10kW resistor and 4.7mF capacitor
is the low pass filter and the 1MW resistor
and 2.2nF capacitor is the high pass filter. In addition, it also amplifies the
signal by 100 (1MW / 10kW). Similarly, the second filter has a band width from 4.23 Hz
to 72.34 Hz, derived in the same way as the previous filter. The amplification
is 125, making it a system total of 12500.

Figure
6 Equation for
Center Frequency for Filter
Finally, we have the comparator. It takes the output from the
filter and compares it to a filtered 2.25V, established with a voltage divider (8.2/(8.2+10))
on the 5V supply. In addition, I added hysteresis on the comparator in order to
provide stability in the output of the system. Since the amplification of the
two filters is so high, noise can be greatly amplified. Adding hysteresis is
one of the ways noise is combatted in the system. The other major way noise is
combatted is the two BPF are actually in the same IC and I used the LF353,
which provides a CMRR (common-mode rejection ratio) of 100dB. The comparator
outputs a 0-5V digital signal to indicate a frequency change.
Finally, we have the line with the diode in it. I used a Schottky
diode, which has a lower voltage drop, and thus, higher efficiency. The resistor
and capacitor is in fact a passive low pass filter; however, in this case it is
being used as an integrator. It provides a voltage measurement of the output of
the sensor, which corresponds with how far the moving object is, although this
output is not linear to the distance of the object.
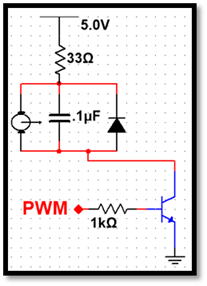
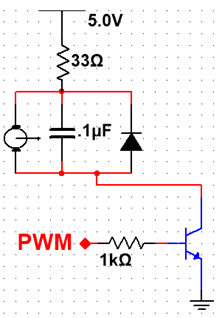
Figure 7 Motor Driver Circuit
For these small motors, it is easy to simply drive them with
the generic motor circuit, shown below. PWM is fast enough to be able to, at
least to any human, control intensity of the motor while continuously running. The
PWM signal is connected to the base of a NPN transistor; this allows us to
control the current flow through the circuit. When we output a digital low, the
transistor turns off and the motor no longer can get current to flow from VCC
to ground. When we output a digital high, the transistor turns on and allows
current to flow, activating the motor.
Note that the circuit also includes a diode across the motor.
This is very good practice to include, as it is a flyback diode, which absorbs
large voltage spikes caused by inductance from the motor. Without the
diode, we can have nasty spikes in voltage, governed by the equation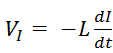 . These
spikes can be of very large magnitude (50+ V for typical motors) and can wear
out parts of the circuit or even destroy them. The diode allows for a space way
for current to be dissipated when the transistor turns off and there is
suddenly no other path for the voltage to follow.
. These
spikes can be of very large magnitude (50+ V for typical motors) and can wear
out parts of the circuit or even destroy them. The diode allows for a space way
for current to be dissipated when the transistor turns off and there is
suddenly no other path for the voltage to follow.
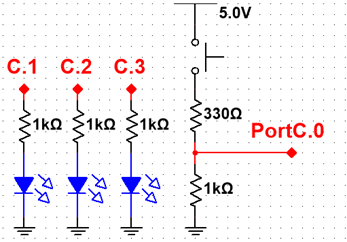
The hardware for the mode selector was very basic, as it did
not need to be complicated. The selector was just a switch in functionality
such that pushing it once would connect the 5V to the rest of the circuit and
then the microcontroller would be able to read a digital high on the connected
port. Pushing it again would disconnect the 5V source and the microcontroller
would read a digital low, as the lower part of the circuit is grounded. The
mode indicators were just a resistor and LED in series.

Figure
8 Mode Selector
and Indicator Circuit
As previously noted, the software was divided into two
sections: the sensor system and the notification system. Not only did this help
during the process for designing, coding, and debugging, but can also help in
the future if any upgrades or changes are needed. I used interrupts to capture
the frequency changes, which makes the most sense. In addition, I used interrupts
to detect mode selection. This is done because polling for these is not
efficient and is unnecessary. However, I would need a way to measure speed
using the frequency data in a consistent manner. I decided to implement a
completely interrupt based system. The main function, after some
initialization, will just idle, and interrupts will prompt the system to update
the state. So, I defined a sensor cycle to run at 120 Hz, or about every 8.3 milliseconds
using timer 1. This means that I will process collected data from the sensors
120 times in a second. I chose this as it was not fast enough that the response
would feel instantaneous, but long enough to collect enough data to be able to
determine a relative speed and whether the object was moving closer or farther
away. As for the vibration controller, I used the same approach in order to
provide a guaranteed minimum run time for each vibration using timer 0. The
vibration cycle runs at about 20 Hz, or about every 50 milliseconds. While this
may seem slow, the vibration is for humans, and this speed is sufficient to
provide up to date information without having situations where a single
movement detection only invokes a few milliseconds of vibration, which would be
virtually undetectable to users. However, timer 0 actually interrupts at about
980 Hz. The vibration state is only handled at 20 Hz, but other mechanisms,
such as the ramp vibration pattern, are handled at a much higher speed to achieve
a smooth transition in the pattern. The diagram below shows the general
software flow, which will be further explained below.
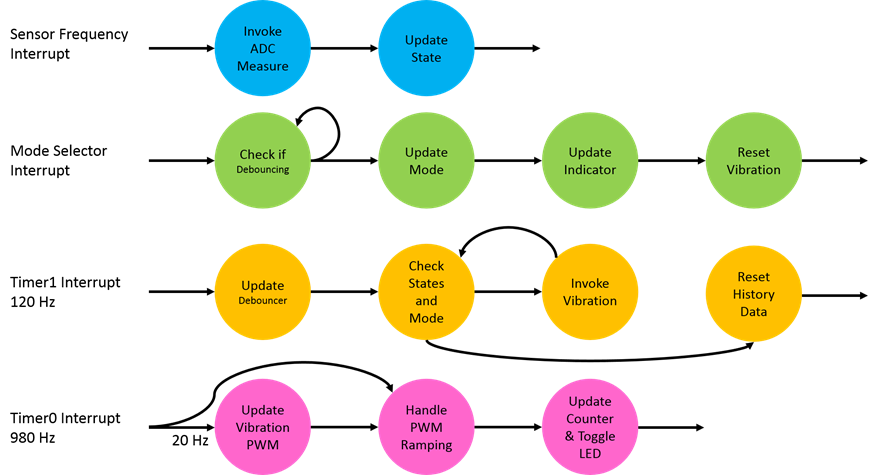
Figure
9 Overview of
Software Flow
The sensor system has two components: data addition and data
accounting. Data addition is done through the frequency interrupts from the
sensor. Since we can have four sensor interrupting at the same time and they can
interrupt as frequently as every 1.5 milliseconds (determined through testing),
this code needs to be relatively quick. The frequency signal is active low, and
since we have to use pin change interrupts, we would get two interrupts for
every movement detection. Each cycle takes 62.5 ns and we could possible
interrupt at 187.5 ns at the worst case, which gives us 3 cycles per interrupt.
Obviously this is impossible to achieve, and it is also very unlikely that it
will get to that point. Nevertheless, I implemented a “best effort” system that
is actually allowed to and designed to drop interrupts. When it gets to the
point that we are fighting for cycles, we can load the CPU as much as we can,
and calibrate our parameters to be able to understand and properly assess the situation.
So, if we take interrupts as fast as possible, we can at least take a large number
of the interrupts and we set our thresholds to slightly lower than this large
number. With this, we can tell that the CPU is at its maximum load and that the
particular object is at its maximum speed. In the interrupt, since it is a pin
change interrupt, we check if it was a valid interrupt (a negative edge),
update an interrupt counter for the sensor and take the distance measurement to
store it as the latest value.
In the data accounting section that runs at 120 Hz, we make
sense of all of data we had accumulated in that sensor cycle. For each of the
sensors, we look at the latest distance measurement to determine how far the
object is, we take the difference between the first and last distance measurement
to determine what direction the object is moving (towards or away from the
user), then we use the counter to determine the speed of the object. The more
interrupts we got, the faster the object was going. Using all of this computed
data, we invoke the vibration software, giving it a certain duration, pattern,
and intensity appropriate to the situation. We also determine if this was an
emergency situation. For each sensor that encountered an emergency situation,
we invoke an emergency notification. After the current sensor cycle is handled,
we clear all of the collected data so we can start fresh for the new sensor
cycle.
Similar to the sensor software, this runs in two components: state
set and state update. State set is invoked by the user of the software and
simply updates local variables. The three state set functions, vib_on, vib_off, and vib_emergency take in arguments and updates the pattern,
duration, power level, and/or start flag for each motor. The state update is
invoked, as the state diagram shows, through timer 0. At about 20 Hz, it
updates the state of the vibration motors by changing the PWM output compare
registers. When the duration of a motor expires, it stops the PWM output. When
a state update set the start flag, it will start a PWM output. This handles the
accounting for the vibration. Next, it handles PWM ramping. This happens at the
speed of interrupts, 980 Hz, and it simply updates the output compare registers
for the PWM output for motors that have a RAMP vibration pattern set. One ramp
period takes 127 cycles, so it runs at about 7.8 Hz. For the first 25 cycles,
it linearly ramps up to the full value of the set power level, and for the last
25 cycles, it ramps down. For the rest of the cycle, it sustains the maximum
output for the given power level. After that, it simply updates its internal
counter for timing and toggles the status LED, which is just used for purposes
of debugging (to check if the system is still running and making progress).
As previously mentioned, this runs through the pin change interrupt.
The push button switch provides an interrupt, letting us know to cycle through
the three modes. The mode is just a status variable that gets checked in the
sensor software. In order to debounce the button, we take advantage of the fact
that we already have timer1 setup and in use. After a mode change, we start the
debouncer, which is simply a counter. In each timer1 interrupt, when the counter
is set, it will increment the value until it reaches 5 counts, at which point
it resets. When the button is pressed and the debouncer is active, the pin
change interrupt for the mode selector will simply do nothing. However, if the
button is pressed after the debouncer is reset, it will change modes. This is a
very simply way to debounce – simply waiting about 33.3 ms between button
pushes. I chose this method because it was simple and required minimal effort.
Since this button would not be pushed very often, there is no need to load the
microcontroller with additional demand.
|
VARIABLES/MACROS |
DESCRIPTION |
|
S# (0,1,2,3) |
Pin number for where the frequency input for the sensor is connected
to |
|
S#_F (0,1,2,3) |
Value for current frequency pin of the sensor |
|
S#_D (0,1,2,3) |
Accessor to an 8-bit number, taken from the ADC. Does not invoke the
ADC to measure |
|
GRN |
Bit value
for the pin the green LED is connected to |
|
ORG |
Bit value for the pin the yellow-orange LED is connected to |
|
RED |
Bit value
for the pin the red LED is connected to |
|
STATE_NORM |
Enum for normal mode. Pertains to the state variable |
|
STATE_NEAR |
Enum for
near distance mode. Pertains to the state
variable |
|
STATE_EMERG |
Enum for emergency only mode. Pertains to the state variable |
|
NORM_DUR |
Configuration
parameter: duration for a normal vibration invocation |
|
NO_HISTORY |
Pertains to pin_history1 and
pin_history3. This value is what a
no history would be for those two variables. |
|
EMERGENCY_CNT |
Configuration
parameter: threshold for how many interrupt counts are required for a sensor
per sensor cycle to be determined as an emergency |
|
NO_EMERGNECY |
Serves no other purpose than just to make the code a little bit more readable |
|
DIST0 |
Configuration
parameter: minimum distance reading for the closest distance level |
|
DIST1 |
Configuration parameter: minimum distance reading for the 2nd
closest distance level |
|
DIST2 |
Configuration
parameter: minimum distance reading for the 3rd closest distance
level |
|
s#_cnt (0,1,2,3) |
Interrupt counter per sensor cycle. Pertains to the speed of the
movement |
|
s#_fst (0,1,2,3) |
First
distance measurement per sensor cycle |
|
s#_lst (0,1,2,3) |
Latest distance measurement per sensor cycle |
|
pin_history1 |
Holds the
last port B pin values. Required to determine if there was a negative edge
due to the way pin change interrupts work. This is for PCINT1 |
|
pin_history3 |
Holds the last port D pin values. Required to determine if there was
a negative edge due to the way pin change interrupts work. This is for PCINT3 |
|
state |
Current mode
of the system (normal, near distance, or emergency only) |
|
debounce_cnt |
Counter for debouncer |
|
FUNCTIONS |
DESCRIPTION |
|
ISR (TIMER1_COMPA_vect) |
Performs sensor data accounting, as described in the sensor software
section |
|
ISR (PCINT#_vect) (1,3) |
Performs
sensor data collection, as described in the sensor software section |
|
ISR (PCINT2_vect) |
Performs mode selector handling, as described in the mode selection
software |
|
measure_ADC |
Given a
sensor number (0,1,2,3), this will change ADMUX, the ADC multiplexer to the appropriate pin and invoke an
ADC measurement. |
|
initialize |
Initializes the sensor system, required microcontroller hardware, and
initialize internal data. |
|
main |
Initializes
the sensor system, the vibration motor system, turns on interrupts, then
idles |
|
VARIABLES/MACROS |
DESCRIPTION |
|
DELTA |
Enum for vibration pattern. This just says stay on continuously |
|
RAMP |
Enum for
vibration pattern. This just says use a ramp pattern |
|
EMERG |
Enum for
vibration pattern. This just says use an emergency pattern |
|
VIB_LVLOFF |
Power level
for the motor being off |
|
VIB_LVL# (0,1,2,3) |
Power level for the motor being on. 0 is the weakest and 3 is the
strongest. They are not linearly distributed. Instead, they are distributed
using experimental results to be noticeably different |
|
M# (0,1,2,3) |
Output compare
registers for each of the given motors. This controls the PWM output |
|
D_E_MAIN |
Duration for Emergency: Main motors |
|
D_E_ACCS |
Duration for
Emergency: Accessory motors |
|
m#p (0,1,2,3) |
Current motor pattern |
|
m#d (0,1,2,3) |
Current motor
duration left |
|
m#l (0,1,2,3) |
Current motor power level |
|
m#s (0,1,2,3) |
Motor start
flag. Setting this indicates to start the PWM for the motor in the next
vibration cycle. If not set and it was turned off, it will not start |
|
counter |
Used to keep track of pattern cycles and vibration cycles through
timer 0 |
|
vib_ramp |
Ramp table.
[power_level][index]. Precomputed for quick execution in the ISR |
|
FUNCTIONS |
DESCRIPTION |
|
ISR (TIMER0_OVF_vect) |
Performs state updates, as described in the vibration system software
section |
|
vib_on |
Using the
provided enums in the header file, can turn on a motor by providing a
pattern, duration, and power level for a given motor |
|
vib_off |
Turns off the given motor |
|
vib_emergency |
Turns on
emergency mode using bitwise numbering. This allows multiple motors to be a
main emergency motor and the rest will be accessory ones |
In order to get intuitive use, there was a lot of calibration
that went into getting the results. For example, determining the distances for
what was near and what was difficult. The
distance measurement was not linear, and the farther away the moving object
was, the less resolution I had. In addition, the signal was not perfectly a
0-5V signal, so there was added scaling that was necessary. Through testing and
measurements, as shown below, I was able to determine the levels. The closest
level was at about 2.94V or above. This was in the vicinity of 4-5 feet
radially from the user. The next level was a voltage as low as 1.96V, which
corresponded to about 7-8 feet away. The next level was as low as 0.98V, which
was up to about 15 feet away, and lower than that would be greater than 15 feet
away.
Figure
10 Raw Distance
Output. Moving towards the sensor.
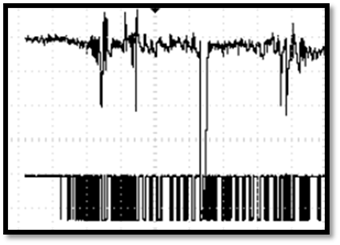
Next, the frequency needed some calibration. It was more that
the software needed to be calibrated to understand what relative speed of the
object. In this case, I took multiple instances to determine speed. One was up
and down movement of a hand, another was forwards and backwards movement of a
hand at high speeds, another was just normal classroom movement, and others. Some
of the oscilloscope screenshots are below. Using this data, I was able to
assess how fast the object was moving.
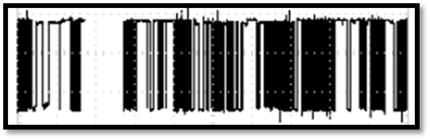
Figure
11 Frequency
outputs. (1) Up and down movement. (2) Towards and away movement. (3) Three
steps back, 1 lunge forward.
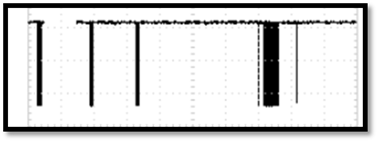
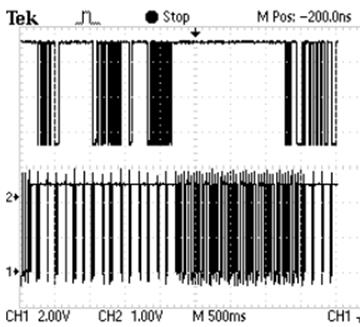
Other performance tests for the sensor included permeability.
I testing how well the sensor could not detect movement if it was being
shielded by a 3cm. piece of wood and also a 5mm piece of metal. For both instances,
the sensor was able to detect movement for over 15ft away. The scope shots are
shown below.
Figure
12 Permeability
of Sensor (1) 3cm. wood (2) 5mm metal (after the spike)
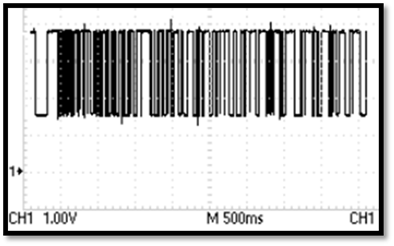
Lastly, there was also the PWM for the vibration motors. The
main measurement of the results was just to analyze the PWM output. The first
scope pic below is just the multichannel PWM outputs at different values. The
next one was to test the ramping for the PWM. Both results were as expected.
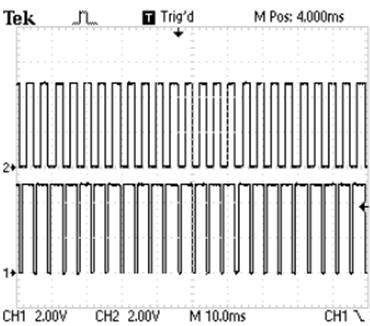
Figure
13 PWM Results
(1) Multichannel Output (2) PWM Ramping Output
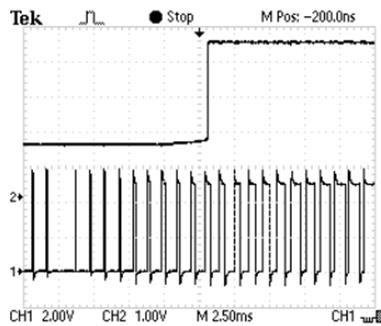
Overall, I think the system performed well for human use.
After the calibration to make it more intuitive for humans to understand the information
it is trying to portray, it was almost like having another sense. I tried out
the system by walking around with my eyes closed just see how this feels and
how I could use the information. Not only was I able to detect people moving,
but also doors and walls. Although the resolution was not fine enough for true
navigation, it was enough to know that I was getting near a wall so that I
could open my eyes and see. The system worked very quickly with little delay
between a movement and vibration. In addition, the vibration lasted long enough
for me to be able to react and determine which one was actually vibrating. One
such example is shown in the scope below where the top signal is the frequency
output and the bottom is the PWM for the corresponding vibration motor. Note
that different intensity of the PWM corresponding to the high frequency
movement it detected.
Figure
14 Top: Frequency
Output. Bottom: PWM Vibration Controller
The system was very accurate in that it never dropped a movement
detection, even if it was one, small, isolated signal. The distance was also intuitive
in that it was very much in the realm of the real world. The distances
corresponded with what most people might actually call near and far. In terms
of noise isolation, the high CMRR op amp really helped decrease interference
and there were no instances of interference in the system. In addition, since
this was at microwave frequency (10.525 GHz), this did not cause any other
people’s projects to malfunction as it was much higher than the frequency they
were concerned about, and the power was low enough that it would not create noticeable
signal noise. The sensors itself were rated safe for everyday use, so that was
not a problem. Most of the wires on the head system were insulated – certainly the
ground and Vcc lines were, so it was safe to actually put on the head.
One concern I do have is that the mode selector uses LEDs as
indicators. It is an easy fix to just use the vibration motors to indicate the
current status, in addition to the LEDs since this system is also intended to
be used for people that are visually impaired. Nevertheless, the system is very
useable overall. It does not impede other senses like hearing in order to work,
and it fulfills all of the requirements of the purpose of the project.
The results of this project met my intended results. Overall,
the project works well in that it is accurate, quick, but also provides useful
and interpretable results. I fully complied with the standards I mentioned in the
standards section, including the coding conventions. Certainly, if I was going
to do this again, I would have worried a little less about the signal
processing and more on making the software even smarter. I spent a large amount
of time trying to stabilize the circuit and to tune it, and had less time to
implement the software. The structure of the software is setup for much smarter
processing, and I was intending to have it be able to detect more scenarios
such as the user was talking to someone and be able to ignore that part. I was
also hoping to be able to have better following, so if an object was moving
from the front to the side, the system would be able to understand the scenario
and indicate it to the user in some way. However, I was not able to implement
this, and instead decided for reliability in the core system.
As for intellectual property, I wrote all of the code for
this project and other than using the previously mentioned circuit, there was
no outside work incorporated in here. In addition, as previously mentioned,
there does not seem to be any copyright, patent, or trademark issues. Another important
aspect was to conform to the IEEE Code of Ethics. Before I even started the
project, I took safety into consideration. I made sure the microwave sensor
unit I was using complied with the laws relating to it, which it did. I did not
tweak the sensor itself so that it would still be within the requirements of radiation
and spectrum allocation. As previously mentioned, the FCC allocated 10.525 GHz
for motion detection, and another law provides a limit on the radiation of the
unit. Obvious conduct like not plugging in things that I was sure was what
needed to be plugged in was also incorporated into how I conducted myself. All
of the data I got were found from measurements and testing – which is part of
the reason why I included so many scope pictures, to have at least some level
of verification. Throughout this project, I believe I also worked well with
everyone else in the lab such as helping people find things that I knew the
location of. In addition, conduct in the lab was also very important in just
simple actions like putting away the tools I used and cleaning up made a
difference for everyone in the lab. Nobody wants to have to clean up someone
else’s mess, and the mess could create safety hazards in the lab. Part of the
intention of this project was to explore using wearable technology like this on
a human level. I think this relates well to the fifth rule, which is to improve
the understanding of the technology. This project explores implementing technology
we already have, except in a different form factor. With the rise of wearable technology,
this project is pertinent to exploring how this technology could be used, if at
all, in daily life.
As for future upgrades, there are many things that can be
done. I have already listed some software features that could be implemented.
In addition, there are also hardware additions that could help such as using
many, small passive IR sensors for much greater resolution for near distance
objects. This would enable many of the software features, as well as much
better obstacle avoidance. In addition, making the package much smaller is very
important. No one wants to carry around heavy equipment, so it would be
important to put it in a form factor that would be useable.
//LAB5 -
Final Project: Collision Avoidance using Doppler Radar
//Cornell
University ECE 4760 - Thursday Afternoon Lab
//Mayur
Patel (map379)
//main.c
//Sensor
handling system.
/*
PORT SETUP*/
/*
B1:
INT9: sensor 0 F
A0:
sensor 0 D
B2:
INT10: sensor 1 F
A1:
sensor 1 D
B3:
OC0A: motor 0
B4:
OC0B: motor 1
D4:
INT28: sensor 2 F
A2:
sensor 2 D
D5:
INT29: sensor 3 F
A3:
sensor 3 D
D6:
OC2B: motor 2
D7:
OC2A: motor 3
*/
//simple
bit read function.
//
READ(variable, bit_number)
#define READ(U, N) ((U) >> (N) & 1u)
//sensor
read value macros...
// S#: Sensor# = sensor number
// _F = Digital frequency
// _D = ADC reading of distance
#define S0 PINB1
#define S0_F
(READ(PINB, 1))
#define S0_D ADCH
#define S1 PINB2
#define S1_F
(READ(PINB, 2))
#define S1_D ADCH
#define S2 PIND4
#define S2_F
(READ(PIND, 4))
#define S2_D ADCH
#define S3 PIND5
#define S3_F (READ(PIND, 5))
#define S3_D ADCH
//Mode
selection
// LEDs
#define GRN
(1<<PINC1)
#define ORG
(1<<PINC2)
#define RED
(1<<PINC3)
// States
#define STATE_NORM
0
#define STATE_NEAR
1
#define STATE_EMERG
2
//Configuration
Parameters
#define NORM_DUR 15 //
duration of normal vibration
#define NO_HISTORY 0xFF
#define EMERGENCY_CNT 8 //
req greater than threshold for emergency
#define NO_EMERGENCY 0
//distance
thresholds
#define DIST0 150 //closest
#define DIST1 100
#define DIST2 50 //anything
less is far
#define F_CPU 16000000UL //
set clock speed.
#include <inttypes.h>
#include <avr/io.h>
#include <avr/interrupt.h>
#include <avr/wdt.h>
#include <stdio.h>
#include <math.h>
#include "vib.h"
//Sensor
states
// count per sensor cycle
volatile char s0_cnt;
volatile char s1_cnt;
volatile char s2_cnt;
volatile char s3_cnt;
// distance during first measurement of a sensor
cycle
volatile char s0_fst;
volatile char s1_fst;
volatile char s2_fst;
volatile char s3_fst;
// distance during last measurement of a sensor
cycle
volatile char s0_lst;
volatile char s1_lst;
volatile char s2_lst;
volatile char s3_lst;
//State
variables
volatile char pin_history1 = NO_HISTORY;
volatile char pin_history3 = NO_HISTORY;
volatile char state;
volatile char debounce_cnt;
/**************FUNCTION
DECLARATIONS**************/
void measure_ADC(char sensor);
void initialize(void); //
initializes timers and IO, etc
/*********************ISRs************************/
//sensor
data handling/accounting
// determines what vibration sensors to activate
ISR
(TIMER1_COMPA_vect, ISR_BLOCK){ //accounting
- highest priority
char isEmergency = NO_EMERGENCY; // init the bitwise emergency flag
char lvl_fst, lvl_lst; //
first and last distance levels
//handle
debouncing if debouncer is active
if(debounce_cnt && ++debounce_cnt == 5)
debounce_cnt = 0;
if(s0_cnt){ //
if I got any sensor 0 data
//determine
distance levels
if(s0_fst > DIST0) lvl_fst = 3;
else if(s0_fst > DIST1) lvl_fst = 2;
else if(s0_fst > DIST2) lvl_fst = 1;
else
lvl_fst = 0;
if(s0_lst > DIST0) lvl_lst = 3;
else if(s0_lst > DIST1) lvl_lst = 2;
else if(s0_lst > DIST2) lvl_lst = 1;
else lvl_lst = 0;
if(s0_cnt > EMERGENCY_CNT){ //check for emergency
isEmergency |= 0x01;// set emergency bit for sensor 0
}
//check
the distances to determine the power level for vibration
if(s0_lst > DIST0 && state != STATE_EMERG){
vib_on(0, RAMP, NORM_DUR, VIB_LVL3);
}
else if(s0_lst > DIST1 && state == STATE_NORM){
vib_on(0, RAMP, NORM_DUR, VIB_LVL2);
}
else if(s0_lst > DIST1 && state == STATE_NORM){
vib_on(0, RAMP, NORM_DUR, VIB_LVL1);
}
else if(state == STATE_NORM){
vib_on(0, RAMP, NORM_DUR, VIB_LVL0);
}
}
//the
rest of these are symmetrical to the sensor0 block
if(s1_cnt){
if(s1_fst > DIST0) lvl_fst = 3;
else if(s1_fst > DIST1) lvl_fst = 2;
else if(s1_fst > DIST2) lvl_fst = 1;
else
lvl_fst = 0;
if(s1_lst > DIST0) lvl_lst = 3;
else if(s1_lst > DIST1) lvl_lst = 2;
else if(s1_lst > DIST2) lvl_lst = 1;
else
lvl_lst = 0;
if(s1_cnt > EMERGENCY_CNT){ //check for emergency
isEmergency |= 0x02;
}
if(s1_lst > DIST0 && state != STATE_EMERG){
vib_on(1, RAMP, NORM_DUR, VIB_LVL3);
}
else if(s1_lst > DIST1 && state == STATE_NORM){
vib_on(1, RAMP, NORM_DUR, VIB_LVL2);
}
else if(s1_lst > DIST1 && state == STATE_NORM){
vib_on(1, RAMP, NORM_DUR, VIB_LVL1);
}
else if(state == STATE_NORM){
vib_on(1, RAMP, NORM_DUR, VIB_LVL0);
}
}
if(s2_cnt){
if(s2_fst > DIST0) lvl_fst = 3;
else if(s2_fst > DIST1) lvl_fst = 2;
else if(s2_fst > DIST2) lvl_fst = 1;
else
lvl_fst = 0;
if(s2_lst > DIST0) lvl_lst = 3;
else if(s2_lst > DIST1) lvl_lst = 2;
else if(s2_lst > DIST2) lvl_lst = 1;
else
lvl_lst = 0;
if(s2_cnt > EMERGENCY_CNT){ //check for emergency
isEmergency |= 0x04;
}
if(s2_lst > DIST0 && state != STATE_EMERG){
vib_on(2, RAMP, NORM_DUR, VIB_LVL3);
}
else if(s2_lst > DIST1 && state == STATE_NORM){
vib_on(2, RAMP, NORM_DUR, VIB_LVL2);
}
else if(s2_lst > DIST1 && state == STATE_NORM){
vib_on(2, RAMP, NORM_DUR, VIB_LVL1);
}
else if(state == STATE_NORM){
vib_on(2, RAMP, NORM_DUR, VIB_LVL0);
}
}
if(s3_cnt){
if(s3_fst > DIST0) lvl_fst = 3;
else if(s3_fst > DIST1) lvl_fst = 2;
else if(s3_fst > DIST2) lvl_fst = 1;
else
lvl_fst = 0;
if(s3_lst > DIST0) lvl_lst = 3;
else if(s3_lst > DIST1) lvl_lst = 2;
else if(s3_lst > DIST2) lvl_lst = 1;
else
lvl_lst = 0;
if(s3_cnt > EMERGENCY_CNT){ //check for emergency
isEmergency |= 0x08;
}
if(s3_lst > DIST0 && state != STATE_EMERG){
vib_on(3, RAMP, NORM_DUR, VIB_LVL3);
}
else if(s3_lst > DIST1 && state == STATE_NORM){
vib_on(3, RAMP, NORM_DUR, VIB_LVL2);
}
else if(s3_lst > DIST1 && state == STATE_NORM){
vib_on(3, RAMP, NORM_DUR, VIB_LVL1);
}
else if(state == STATE_NORM){
vib_on(3, RAMP, NORM_DUR, VIB_LVL0);
}
}
//set
emergency mode if the flag was set above
if(isEmergency != NO_EMERGENCY){
vib_emergency(isEmergency);
}
//reset
data for new sensor cycle
s0_cnt = 0;
s0_fst = 0;
s0_lst = 0;
s1_cnt = 0;
s1_fst = 0;
s1_lst = 0;
s2_cnt = 0;
s2_fst = 0;
s2_lst = 0;
s3_cnt = 0;
s3_fst = 0;
s3_lst = 0;
pin_history1 = NO_HISTORY;
pin_history3 = NO_HISTORY;
}
//interrupt
for sensors.
//
collects data if valid interrupt
ISR
(PCINT1_vect,ISR_BLOCK){ //
sensor0,1
//check
prev pin value to find changes
char changes = PINB ^ pin_history1;
measure_ADC(0x00); /// measuren sensor0 distance
pin_history1 = PINB;
if(S0_F == 0 && (changes & 1<<S0)){ // valid sensor 0 interrupt
if(s0_cnt++ == 0){ //
if this is the first in the sensor cycle
while(ADCSRA & (1<<ADSC)); // wait unil ADC conversion complete
s0_fst = S0_D; // set the first distance
}
else{ // not
the first in sensor cycle
while(ADCSRA & (1<<ADSC));
s0_lst = S0_D; // set latest distance measurement
}
}
//symmetrical
to sensor 0 block
measure_ADC(0x01);
if(S1_F == 0 && (changes & 1<<S1)){ // valid sensor 1 interrupt
if(s1_cnt++ == 0){
while(ADCSRA & (1<<ADSC));
s1_fst = S1_D;
}
else{
while(ADCSRA & (1<<ADSC));
s1_lst = S1_D;
}
}
}
//same
as above function
ISR
(PCINT3_vect,ISR_BLOCK){ //sensor2,3
char changes = PINB ^ pin_history3;
measure_ADC(0x02);
pin_history3 = PINB;
if(S2_F == 0 && (changes & 1<<S2)){ // sensor 2 interrupt
if(s2_cnt++ == 0){
while(ADCSRA & (1<<ADSC));
s2_fst = S2_D;
}
else{
while(ADCSRA & (1<<ADSC));
s2_lst = S2_D;
}
}
measure_ADC(0x03);
if(S3_F == 0 && (changes & 1<<S3)){ // sensor 3 interrupt
if(s3_cnt++ == 0){
while(ADCSRA & (1<<ADSC));
s3_fst = S3_D;
}
else{
while(ADCSRA & (1<<ADSC));
s3_lst = S3_D;
}
}
}
//mode
selection interrupt
//states:
// 0 normal
// 1 emergency only
// 2 near distance only
ISR
(PCINT2_vect, ISR_BLOCK){ //button
if(debounce_cnt == 0){ //
if debounceing was reset
if(++state >= 3){ //
cycle through set
state = 0;
}
switch(state){
case 0: // was
red, now grn
PORTC = GRN;
break;
case 1: // was
grn, now org
PORTC = ORG;
break;
case 2: // was
org, now red
PORTC = RED;
break;
}
//reset
vibration as in new mode
vib_off(0);
vib_off(1);
vib_off(2);
vib_off(3);
debounce_cnt = 1; // start debouncer
}
}
/***INITIALIZE
SYSTEM**************************************/
void measure_ADC(char sensor){
ADMUX = (1<<REFS0) | (1<<ADLAR) |
sensor; // change multiplexer
ADCSRA |= (1<<ADSC); // write to tell it to take a measurement
}
//
inits the system by setting up timers, vars, and ports
void initialize(void){
//set up
pin change interrupts
PCICR
= (1<<PCIE1) | (1<<PCIE2) | (1<<PCIE3);
PCMSK1 = (1<<PCINT9) |
(1<<PCINT10);
PCMSK2 = (1<<PCINT16);
PCMSK3 = (1<<PCINT28) |
(1<<PCINT29);
//init
the ADC ports
ADMUX = (1<<REFS0) + (1<<ADLAR);
ADCSRA = (1<<ADEN) + 7;
DDRA = 0x00; //no
pullups
//init
timer 1
TCCR1A = (1<<WGM12); //CTC mode
TCCR1B = 3; //
64 prescalar
OCR1A = 2084; //every
8.333 ms -> 120 Hz
TIMSK1 = (1<<OCIE1A);//start timer
//init
vars
s0_cnt = 0;
s1_cnt = 0;
s2_cnt = 0;
s3_cnt = 0;
s0_fst = 0;
s1_fst = 0;
s2_fst = 0;
s3_fst = 0;
s0_lst = 0;
s1_lst = 0;
s2_lst = 0;
s3_lst = 0;
state = 0;
debounce_cnt = 0;
DDRC = 0x1E;
PORTC = GRN;
PORTD = 0x04;
}
//**********************************************************
//
main scheduler
//
first inits the system
int main(void){
initialize();
vib_init();
sei(); //
LET THERE BE INTERRUPTS!
while(1);
}
//LAB5
- Final Project: Collision Avoidance using Doppler Radar
//Cornell
University ECE 4760 - Thursday Afternoon Lab
//Mayur
Patel (map379)
//vib.h
//Vibration
Motor handling library.
#ifndef VIB_H
#define VIB_H
/***Vibration
library pinout***
B3: OC0A:
motor 0
B4: OC0B:
motor 1
D6: OC2B:
motor 2
D7: OC2A:
motor 3
*/
//Vibration
Patterns
#define DELTA 0
#define RAMP 1
#define EMERG 2
//Vibration
Pwr Lvls
#define VIB_LVLOFF 0
#define VIB_LVL0 100
#define VIB_LVL1 135
#define VIB_LVL2 185
#define VIB_LVL3 255
//init
vibration for 'motors' number of motors
void vib_init();
//given
motor index, pattern, and duration, turn on vibration
//
duration is determined as number of vibration cycles
void vib_on(char motor, char pattern, char duration, char pwr);
//turn
off motor
void vib_off(char motor);
//set
emergency mode for given motor - bitwise
// ie if bit 0 is set -> emergency on motor
0
void vib_emergency(char motor);
#endif
//LAB5
- Final Project: Collision Avoidance using Doppler Radar
//Cornell
University ECE 4760 - Thursday Afternoon Lab
//Mayur
Patel (map379)
//vib.c
//Vibration
Motor handling library.
/*
Pinout
B3: OC0A:
motor 0
B4: OC0B:
motor 1
D6: OC2B:
motor 2
D7: OC2A:
motor 3
*/
#define F_CPU 16000000UL //
set clock speed.
#include <inttypes.h>
#include <avr/io.h>
#include <avr/interrupt.h>
#include <stdio.h>
#include <math.h>
#include "vib.h"
//accessor
macros for PWM output of specified motor
#define M0 OCR0A
#define M1 OCR0B
#define M2 OCR2B
#define M3 OCR2A
#define D_E_MAIN 50 //duration
emergency main
#define D_E_ACCS 44 //duration
emergency accessory
//pattern
set
volatile char m0p;
volatile char m1p;
volatile char m2p;
volatile char m3p;
//duration
set
volatile char m0d;
volatile char m1d;
volatile char m2d;
volatile char m3d;
//power
level set
// 0 - lowest, 3 - highest
volatile char m0l;
volatile char m1l;
volatile char m2l;
volatile char m3l;
//start
flag set
volatile char m0s;
volatile char m1s;
volatile char m2s;
volatile char m3s;
volatile unsigned char counter; //timeout counter
//precomputed
ramp table fow PWM output
// [pwr_level][]
char vib_ramp[4][127];
//
runs 255 times a sec
ISR
(TIMER0_OVF_vect, ISR_BLOCK){
counter++;
//handle
duration accounting and vibration starting
if (counter%51 == 0){
//update
duration counters
if(m0d){ //
duration exists
if(!m0s)
m0d--; // subtract 1 duration if
already started
if(!m0d){ // have 0 time left
M0 = VIB_LVLOFF;
}
if(m0s){
M0 = m0l; //if need to be started, set to correct level
m0s = 0; //reset
start flag
}
}
if(m1d){ //
duration exists
if(!m1s)
m1d--; // subtract 1 duration if
already started
if(!m1d){ // have 0 time left
M1 = VIB_LVLOFF;
}
if(m1s){
M1 = m1l; //if need to be started, set to correct level
m1s = 0;
}
}
if(m2d){ //
duration exists
if(!m2s)
m2d--; // subtract 1 duration if
already started
if(!m2d){ // have 0 time left
M2 = VIB_LVLOFF;
}
if(m2s){
M2 = m2l; //if need to be started, set to correct level
m2s = 0;
}
}
if(m3d){ //
duration exists
if(!m3s)
m3d--; // subtract 1 duration if
already started
if(!m3d){ // have 0 time left
M3 = VIB_LVLOFF;
}
if(m3s){
M3 = m3l; //if need to be started, set to correct level
m3s = 0;
}
}
}
//handle
ramping
if(counter < 255){
//motor
0 is set to ramp pattern
if((m0d > 0) && (m0s == 0) && (m0p
!= DELTA)){
//ramp based on current power level
if(m0l ==
VIB_LVL0)
M0 =
vib_ramp[0][counter%127];
else if(m0l ==
VIB_LVL1)
M0 =
vib_ramp[1][counter%127];
else if(m0l ==
VIB_LVL2)
M0 =
vib_ramp[2][counter%127];
else if(m0l ==
VIB_LVL3)
M0 =
vib_ramp[3][counter%127];
}
//motor
1 ramping
if(m1d > 0 && m1s == 0 && m1p !=
DELTA){
if(m1l ==
VIB_LVL0)
M1 =
vib_ramp[0][counter%127];
else if(m1l ==
VIB_LVL1)
M1 =
vib_ramp[1][counter%127];
else if(m1l ==
VIB_LVL2)
M1 =
vib_ramp[2][counter%127];
else if(m1l ==
VIB_LVL3)
M1 =
vib_ramp[3][counter%127];
}
//motor
2 ramping
if(m2d > 0 && m2s == 0 && m2p !=
DELTA){
if(m2l ==
VIB_LVL0)
M2 =
vib_ramp[0][counter%127];
else if(m2l ==
VIB_LVL1)
M2 =
vib_ramp[1][counter%127];
else if(m2l ==
VIB_LVL2)
M2 =
vib_ramp[2][counter%127];
else if(m2l ==
VIB_LVL3)
M2 =
vib_ramp[3][counter%127];
}
//motor
3 ramping
if(m3d > 0 && m3s == 0 && m3p !=
DELTA){
if(m3l ==
VIB_LVL0)
M3 =
vib_ramp[0][counter%127];
else if(m3l ==
VIB_LVL1)
M3 =
vib_ramp[1][counter%127];
else if(m3l ==
VIB_LVL2)
M3 = vib_ramp[2][counter%127];
else if(m3l ==
VIB_LVL3)
M3 =
vib_ramp[3][counter%127];
}
}
if (counter == 255){ //
counter overflow handling
counter = 0;
PORTD
= PORTD ^ 0x04; // toggle progress LED
}
}
void vib_init(){
int i;
double curr_f = 0; //
ramp caluclator factor
//
B.3,4; D.6,7 is PWM output
// we OR
because the main could (did) set up other things in the regs
DDRB = (1<<PINB3) | (1<<PINB4);
DDRD = (1<<PIND6) | (1<<PIND7) |
(1<<PIND2);
// init
the timers & counter
TCCR0B = 3; //
64 prescalar
TCCR2B = 5; //
64 prescalar
TIMSK0 = (1<<TOIE0); // turn on timer 0 overflow ISR
// turn
on PWM
// turn
on fast PWM and OC0A output
TCCR0A
= (1<<COM0A1) | (1<<COM0B1) | (1<<WGM00) | (1<<WGM01);
TCCR2A = (1<<COM2A1) |
(1<<COM2B1) | (1<<WGM20) | (1<<WGM21);
//turn
off all motors
M0 = VIB_LVLOFF;
M1 = VIB_LVLOFF;
M2 = VIB_LVLOFF;
M3 = VIB_LVLOFF;
//init
params
m0p = RAMP;
m1p = RAMP;
m2p = RAMP;
m3p = RAMP;
m0d = 0;
m1d = 0;
m2d = 0;
m3d = 0;
m0l = VIB_LVLOFF;
m1l = VIB_LVLOFF;
m2l = VIB_LVLOFF;
m3l = VIB_LVLOFF;
m0s = 0;
m1s = 0;
m2s = 0;
m3s = 0;
counter = 0;
//init
the ramping table
for(i = 0; i < 127; i++){
if(i < 25){ //
0 - 24 is a ramp up
curr_f = ((double)i)/25.0;
}
else if(i < 102){ //
25-101 is a constant at a factor of 1
curr_f = 1.0;
}
else{//102 -
127 is a ramp down
curr_f = 1.0 - ((double)(i-101))/25.0;
}
//store
ramp values for each of the 4 power levels
vib_ramp[0][i] = (char)(curr_f
* VIB_LVL0) > 255 ? 255 : (char)(curr_f * VIB_LVL0);
vib_ramp[1][i] = (char)(curr_f
* VIB_LVL1) > 255 ? 255 : (char)(curr_f * VIB_LVL1);
vib_ramp[2][i] = (char)(curr_f
* VIB_LVL2) > 255 ? 255 : (char)(curr_f * VIB_LVL2);
vib_ramp[3][i] = (char)(curr_f
* VIB_LVL3) > 255 ? 255 : (char)(curr_f * VIB_LVL3);
}
}
//duration
is a factor of 51Hz... ie duration of 1 will be a 1/51 second duration
void vib_on(char motor, char pattern, char duration, char pwr){
duration = duration;
switch(motor){
case 0: //
motor 0 was specified
//set parameters
m0p = pattern;
m0d = duration;
m0l = pwr;
m0s = 1;
break;
//symmertric
to above
case 1:
m1p = pattern;
m1d = duration;
m1l = pwr;
m1s = 1;
break;
case 2:
m2p = pattern;
m2d = duration;
m2l = pwr;
m2s = 1;
break;
case 3:
m3p = pattern;
m3d = duration;
m3l = pwr;
m3s = 1;
break;
}
}
//turn
off specified motor
void vib_off(char motor){
switch(motor){
case 0:
//set parameters
m0d = 0;
M0 = 0;
m0s = 0;
break;
case 1:
m1d = 0;
M1 = 0;
m1s = 0;
break;
case 2:
m2d = 0;
M2 = 0;
m2s = 0;
break;
case 3:
m3d = 0;
M3 = 0;
m3s = 0;
break;
}
}
//bitwise
flag given to set emergency mode
//main
motors are on DELTA patterns, else EMERG pattern
//main
motors at max power, EMERG at lvl2
void vib_emergency(char motor){
if((motor&0x01) == 0x01){ // first bit set - motor0
m0p = DELTA;
m0d = D_E_MAIN;
m0l = VIB_LVL3;
m0s = 1;
}
else{ // not
emergency on motor 0
m0p = EMERG;
m0d = D_E_ACCS;
m0l = VIB_LVL2;
m0s = 1; // start flag
}
//reset
are symmertric
if((motor&0x02) == 0x02){
m1p = DELTA;
m1d = D_E_MAIN;
m1l = VIB_LVL3;
m1s = 1;
}
else{
m1p = EMERG;
m1d = D_E_ACCS;
m1l = VIB_LVL2;
m1s = 1;
}
if((motor&0x04) == 0x04){
m2p = DELTA;
m2d = D_E_MAIN;
m2l = VIB_LVL3;
m2s = 1;
}
else{
m2p = EMERG;
m2d = D_E_ACCS;
m2l = VIB_LVL2;
m2s = 1;
}
if((motor&0x08) == 0x08){
m3p = DELTA;
m3d = D_E_MAIN;
m3l = VIB_LVL3;
m3s = 1;
}
else{
m3p = EMERG;
m3d = D_E_ACCS;
m3l = VIB_LVL2;
m3s = 1;
}
}
Due to the complexity of the circuit, I have broken the
circuit into a higher level block style diagram, and fully detailed subsystem
diagrams. This overall circuit shows the four sensors and vibration motors, as
well as their driving circuits in block form.
|
Item |
Quantity |
Total Cost |
Vendor |
|
HB100 Sensor |
4 |
$20 |
E-Trade-Center |
|
Vibration Motor |
4 |
$12 |
Digikey/Adafruit |
|
ATmega1284P |
1 |
$5 |
- |
|
PCB |
1 |
$4 |
- |
|
Whiteboard |
1 |
$6 |
- |
|
Power Supply |
2 |
$10 |
- |
|
9V Battery |
1 |
$2 |
- |
|
DIP Socket |
1 |
$0.50 |
- |
|
Ferrite Chip |
1 |
$0.10 |
Digikey |
|
Header Socket/Plug |
79 |
$3.95 |
- |
|
TOTAL |
|
$63.55 |
|
All work was done by Mayur Patel.
ATmega1284P
Datasheet