"A lock that works using the sound of your voice"
We designed and implemented a speaker recognition device that acts as a lock triggered by the sound of your voice saying a specific passcode. The implementation uses hardware filtering from a microphone and many signal processing concepts in software. All software and matching is implemented in the ATmega1284p. The lock has two modes: training and testing. Training mode allows the lock owner to provide voice samples to set the lock, and testing mode is the standard setting in which several users attempt to unlock the lock.
The accuracy of the device is not quite appropriate for a real security system but succeeds in demonstrating functionality. The device executes in real time despite the mathematical complexity underlying the software design and provides the user with feedback on an LCD screen. Results are displayed as value distances from the original speaker’s voice sample, which are compared to a threshold to determine whether the lock is released.
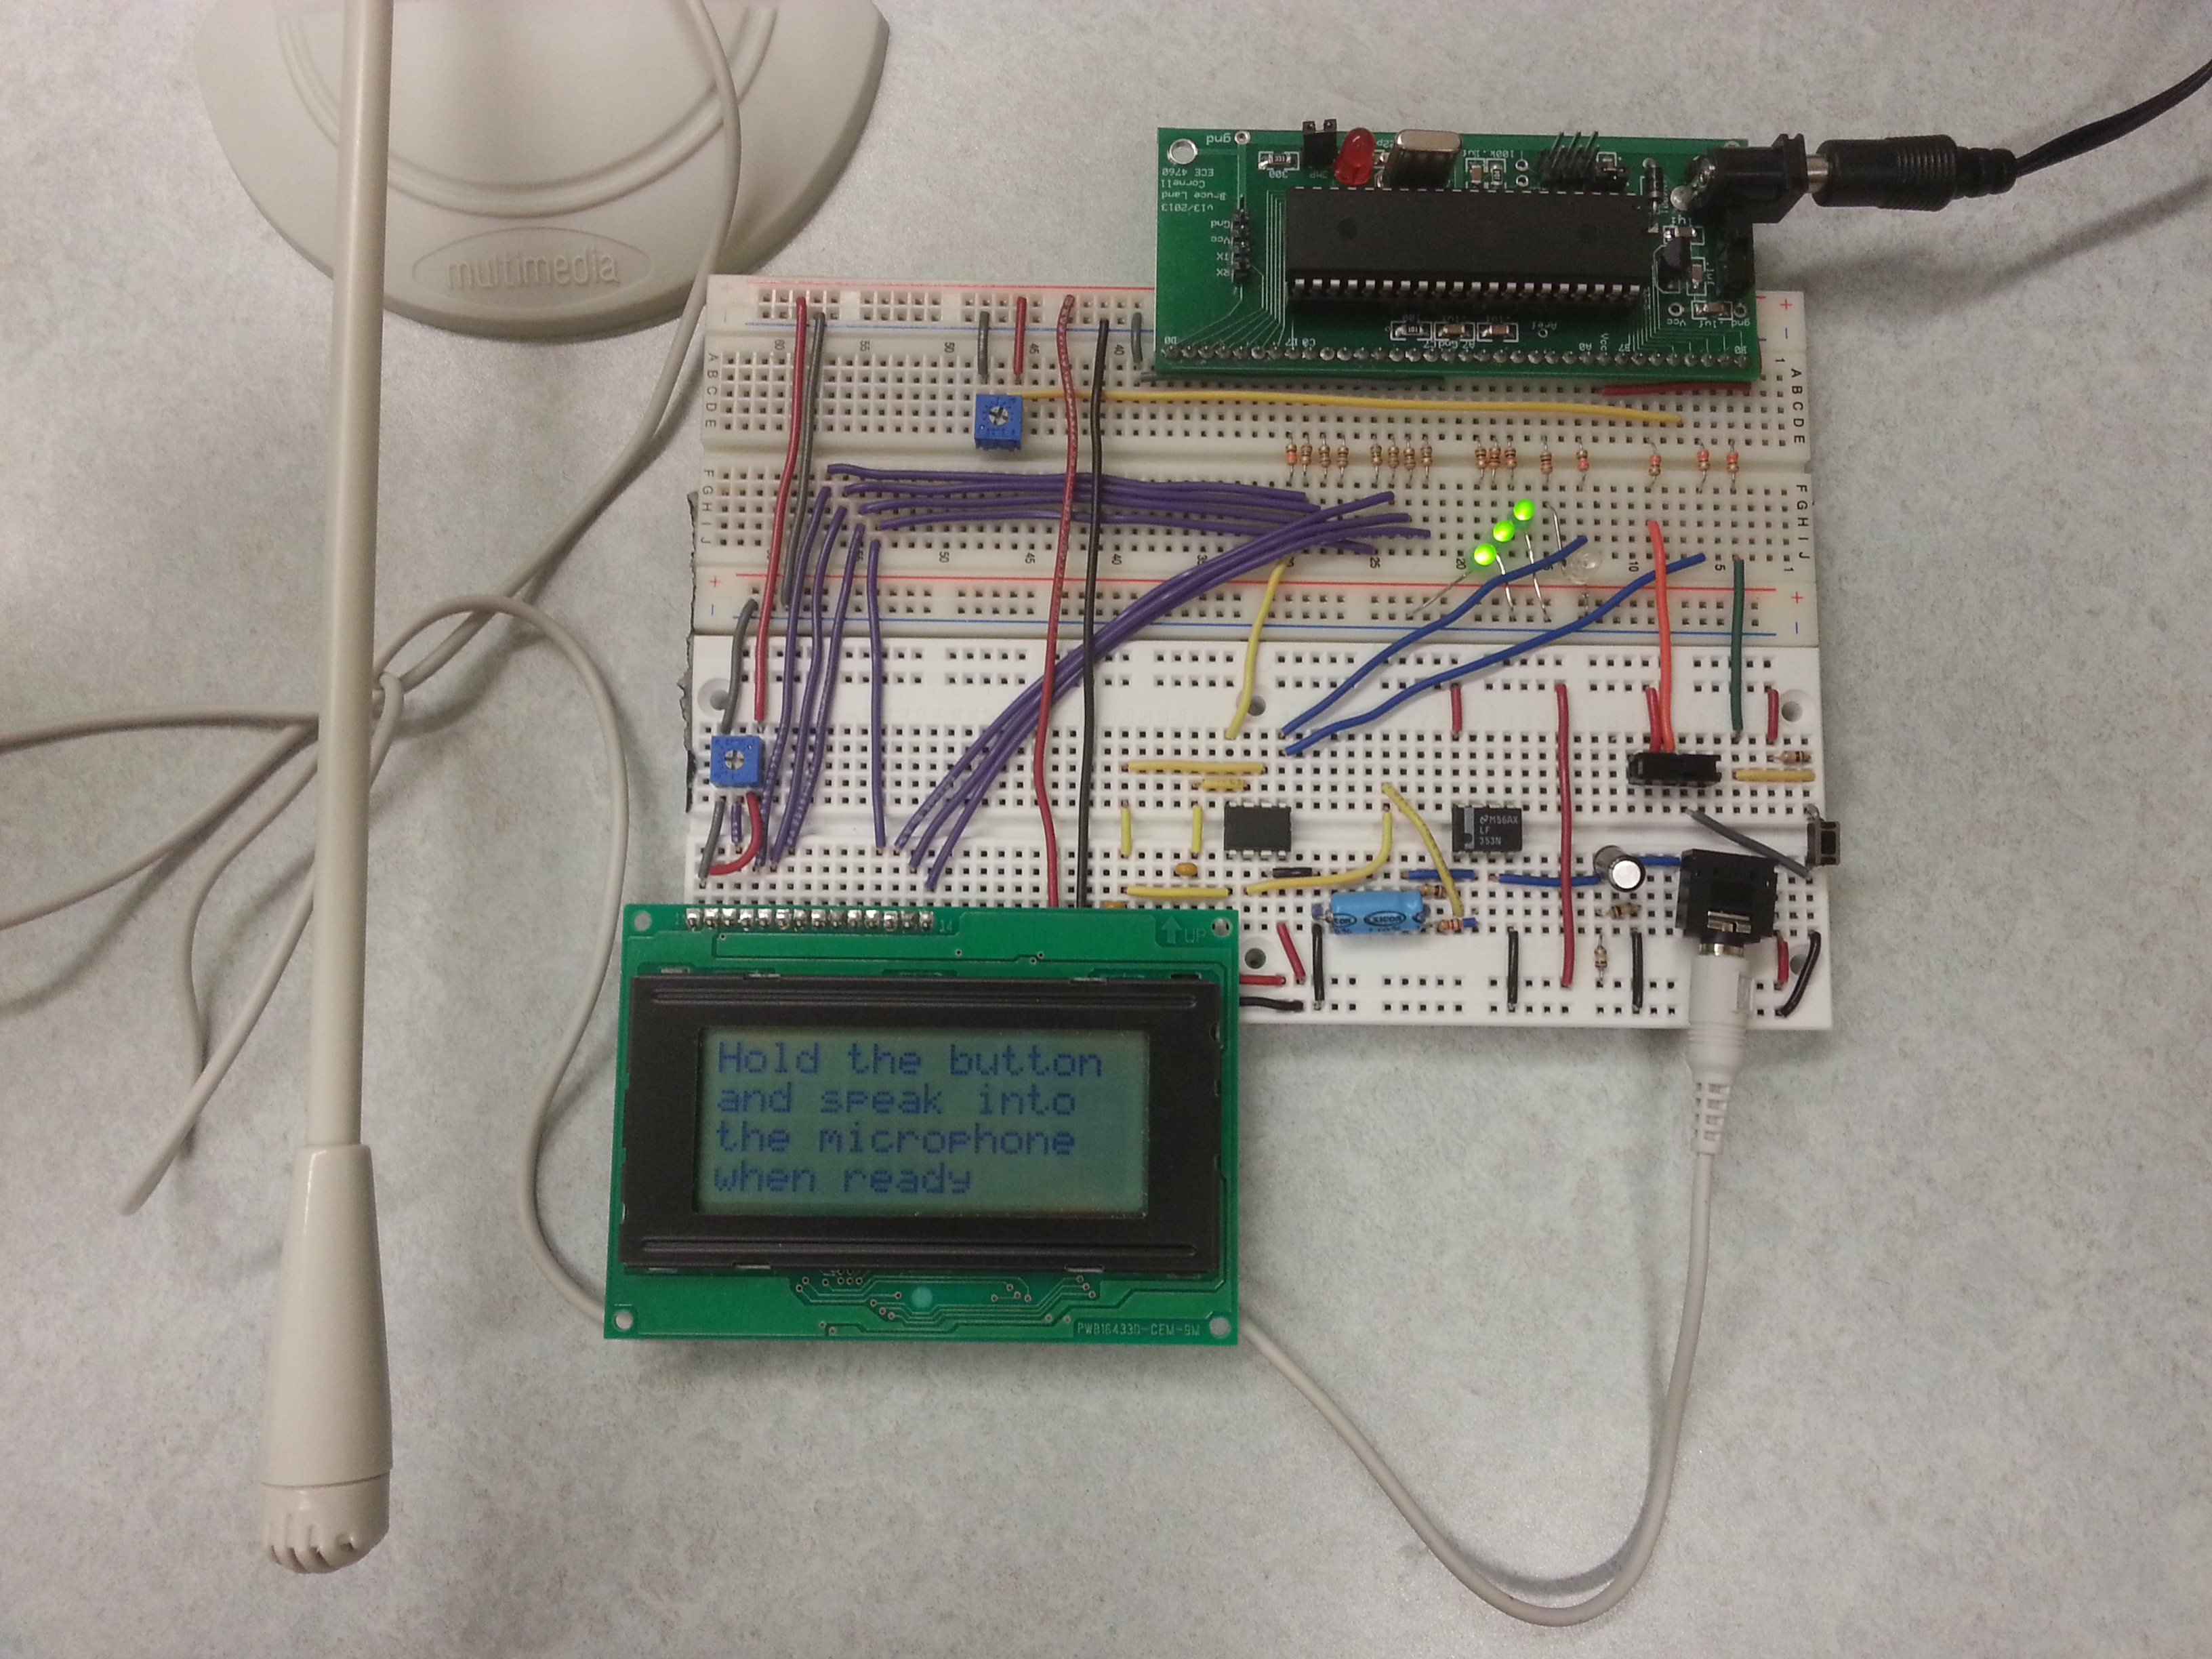
The finished product.
High Level Design top
Logical Structure
At a high abstraction our project takes in input speech, extract key features, and compare it to pre-registered signals. We then plan to be able to determine whether or not the speaker is a match with the stored speaker based on their specific speaking features. We use digital signal processing tools to extract speech features, identify common patterns per person, validate patterns based on pre-registered or machine-learned values, and then accept or reject these individuals as the input based on errors calculated in each pattern.
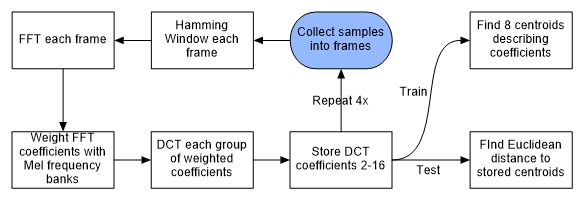
Figure 1: Block diagram of signal path in software
Rationale and Inspiration
We decided to implement this idea because the members of our group enjoy the signal processing aspect of ECE and we were able to find good online sources for a project like this. These sources used MATLab to implement the code and we thought that implementing it on an 8-bit microcontroller with only 8kB of memory would be a good final project.
Background Math
The method we used to determine the relative distance to the preset speaker was Mel cepstrum analysis. This is done using several steps:
- Take the input audio signal and divide it up into multiple frames
- For each frame, find the power spectral density
- Apply the Mel filterbank to the power spectrum
- Normalize the spectral data
- Take the DCT of the filter banks
These steps are all done to closely approximate human hearing to get the best results. The reason we frame the audio signal is to get a relatively unchanging audio signal. We want the input to be simple enough to analyze while long enough to get reliable data from. Dividing up the audio signal into 20-40 millisecond frames will get the best results. The number of samples per frame will obviously depend on sampling rate. Frames can overlap with one another but this is not necessary.
After framing the input signal, we apply a Hamming window to each frame. This window brings the ends of the signal to 0 to minimize ringing and discontinuity. This step is not strictly necessary but provides slightly better results when input signals overlap.
Once we have the frames, we need to analyze their power spectrum. This is most easily and commonly done by taking the Discrete Fourier Transform (DFT) of the frames. The power spectrum also gets the frequency content of the signal which, for audio signals, is much more easily analyzed than the original time domain signal. The DFT is taken by putting each frame into the following equation:
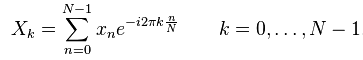
Figure 2: The DFT equation
We will only need to keep the first N/2 + 1 coefficients since the highest frequency content is contained in the middle of the FFT coefficients. The positive frequencies are in the lower indices and the negative frequencies are contained in the higher indices.
Once we have the spectral data from the DFT, we need to analyze it. The best way of doing this and getting speaker information is to mimic the human ear as closely as possible. The first step in this analysis is to section off the power at different frequencies. Because the human ear can differentiate frequencies much more closely at lower frequencies (e.g. we can differentiate 620 Hz and 600 Hz much more easily than 2020 Hz and 2000 Hz), we use a logarithmically spaced filterbank to section of these frequencies. The most commonly used filterbank is the Mel filterbank, which we also implemented. The formula for calculating Mels given frequency (in Hertz) is given as follows:
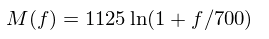
Figure 3: Mel frequency conversion equation
To separate the power densities into bins, we use triangular filter banks. To find the start and end frequencies, we convert the beginning and end frequencies (in our case, 200 and 4000 Hz) to Mels. We then decide how many bins we want (32) and find that many linearly spaced Mels between our beginning and end frequencies, excluding the two endpoints. Once we have these Mels, we convert them back into frequencies in order to parse. Each frequency will go into 2 bins using this method.
Since we have frequencies in terms of FFT coefficients, we need to figure out a way to get each frequency into the corresponding bin. Converting frequencies to coefficients can be done by plugging in the frequency into the following formula:
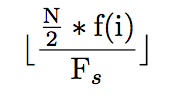
Figure 4: Frequency to coefficient conversion
Where N is the number of DFT coefficients, f(i) is the corresponding frequency we are trying to find, and Fs is the sampling frequency.
Now that we have the spectral data sectioned off into bins, we need to take the logarithm of each of these powers to again better imitate the human ear, which doesn’t hear volume on a linear scale. It also lets us use subtraction as a means of finding differences in power, rather than division.
The final step is getting the data we need from the audio input it to take the Discrete Cosine Transform (DCT) of the logarithm Mel cepstral data. This is done to decorrelate the signal since the filter banks overlap. The DCT is done by putting the log filterbank powers into the following:
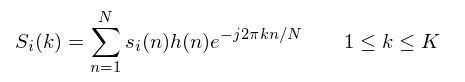
Figure 5: The DCT equation
Now we have a set of 32 coefficients for each frame, we throw away the latter half of them, which correspond to the high frequency data and help much less than the others. Once we have all the coefficients we need, we now need to match the DCT coefficients to pre-loaded voice samples.
The method we used to obtain the distances to the recorded voice samples is Vector Quantization (VQ). The first step in VQ is to find the initial centroid of the input space, effectively the average. This centroid is then updated into 2 new centroids by offsetting in every dimension by a small number. For our design, we used ±0.0625. Once we have the offset, we find the Euclidean distance from each of our coefficient vectors to each of the two new centroids. Whichever one is closer, we assign that vector to that centroid. i.e., we assign each vector to the centroid cj that satisfies the equation:
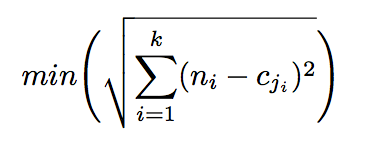
Figure 6: Minimum Euclidean distance equation
Once this step is done, we simply recursively apply this algorithm to each of the new centroids until we have the number of centroids we want.
Hardware/Software Tradeoffs
The choice between hardware or software implementation came down mostly to what we wanted to use for DSP techniques. Most of the audio filtering we used was much more easily implemented in hardware as it not only gave a more accurate reading, but also it was done with components that were readily available to us. On the other hand, the transform equations we used were easier to do in software as they involved arithmetic and were discrete rather than continuous operations.
Standards
Given that our device has relative few human-to-design interaction, there are no immediately notable IEEE Safety standards - given our time and availability to research - that it is required to adhere too. Provided with more time and need to follow these standards - for a stringent more narrowly tailored set of safety factors - we would research IEEE ISO code on human-design interactions.
Existing Patents
Our design was based on existing academic type literature for commonly accepted methods of speech recognition. Many patents exist expanding on these methods, but the general process itself is, to the best of our knowledge, unpatented. It works through a series of widely known mathematical operations such as the FFT, DCT, and vector quantization.
Software Design top

Figure 7: Block diagram of signal path in software
The flow chart above describes the process of taking samples all the way to either matching or training the lock. The process begins where the samples are collected into frames.
Almost all values used in software, including the sample values after they are obtained and move through processing, are signed 16-bit fixed point values. These may take on a range from about 128 to -128, with a step size of 1/256.
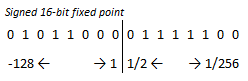
Figure 8: Number format used most widely in design
These were chosen over floating point values for mathematical efficiency.
Taking Samples
Since getting voice samples from the microphone circuit involves interfacing with the user, starting the process involves some steps to ease use. We started with only a button that, when pushed, began the cycle of taking in microphone input in the ADC. While we, the creators of the project, had full knowledge of the way this worked, other users tended to press the button and then wait up to a second before speaking. This was a big problem since taking in a second of silence is giant waste of sampling, processing power and storage. To amend this, we set the output of the microphone circuit to go not only to the ADC of the microcontroller, but also to the analog comparator. To start sampling, not only does a button need to be pressed, but the microcontroller must detect that the user is actually speaking.
Since the process necessitates placing samples into overlapping frames, for efficiency and memory saving we created an algorithm to save samples directly into frames as they are obtained. The memory efficiency comes from the fact that the same array is used to store the samples as they are scaled and transformed throughout the process flow. It would be an unnecessary waste of space to first store the samples consecutively in a one-dimensional array when they must be must to a frame matrix anyway.
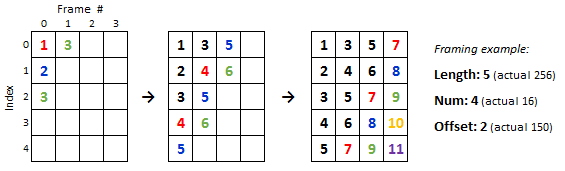
Figure 9: Example of dynamic sample framing
The samples are converted and pulled from the ADC one by one. The ADC is set to 125,000kHz. At 13 cycles of execution, this means the effective sample rate is around 9,600kHz. The cutoff of the low pass filter following the microphone input was measured to be around 3kHz. This satisfies the Nyquist-Shannon sampling condition, which states that to prevent aliasing, sampling must occur at a rate that is at least twice as frequent as the highest frequency rate existing in the signal. The samples from the ADC are shifted left by 6, or multiplied by 64, as a scaling factor. This value was chosen as a trade-off between signal accuracy and ensuring prevention of overflows.
As each sample is obtained from the ADC, it is placed into the frames in each location it belongs. The code does this by taking advantage of the pattern visible in the image above. For instance, you may notice that if a number is to be placed in a given frame at an index greater than or equal to the offset, it must also be placed in the next frame at (index – offset).
Windowing
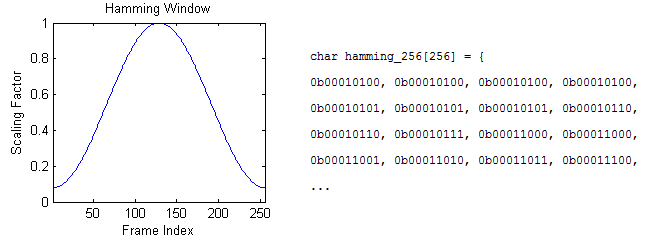
Figure 10: The Hamming window and fixed point array
Following taking the samples into frames, each frame is scaled by the Hamming window.
Using MATLAB, we created code to produce a C array with Hamming scaling factors in a fixed point array of length 256. The fixed point values were stored as chars, since they are all less than or equal to one. Each frame of the sample matrix and the hamming array are both looped through and multiplied together, with the outputs overwriting the previous values of the frame matrix.
Fast Fourier Transform
After each frame is multiplied by the Hamming, the FFT is taken. The FFT function used was code created by Tom Roberts and Malcolm Slaney and modified by Bruce Land. The function is fed each frame of the frame matrix individually. The outputs are have both real and imaginary components, which are squared and added together to get the square magnitude of the FFT. This gives us a power spectral density of the input voice samples.
Mel Frequency Band Weighting
The next step is weighting the spectral density with the Mel frequency banks. Similarly to the Hamming window, we used MATLAB to produce C arrays to use for the banks.
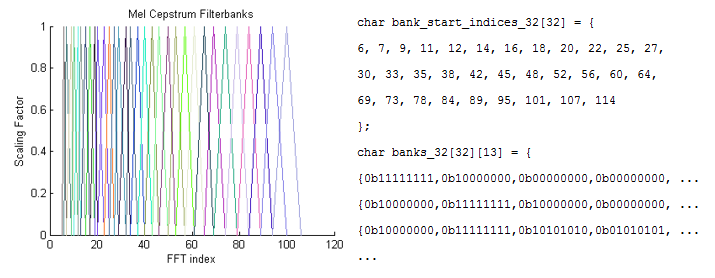
Figure 11: The Mel Cepstrum filterbanks and fixed point arrays
The banks stretch to near the halfway point of the FFT since this is where the highest frequency lies. The banks do not quite reach because of adjustments made to ignore the highest frequencies taken from sampling.
The MATLAB code produces an array and a matrix. The array contains the index at which each Mel bank weighting values begin, and the matrix contains the weighting values themselves all starting at index 0. The purpose of creating a separate array to indicate the start indices of each bank instead of starting the banks at different indices in the matrix is to save memory. Additionally, the values are stored as chars since they are all less than or equal to one.
The weighting is done by looping through each frame, then looping through each bank and saving the coefficients obtained from multiplication indexed from the beginning of the frame matrix. Therefore, after the weighting, only the first 32 values of each frame are of interest.
Discrete Cosine Transform
The DCT is a 32-point DCT of the weighted Mel frequency coefficients. The DCT code was produced by Luciano Volcan Agostini, Ivan Saraiva Silva, and Sergio Bampi and adapted to GCC by Bruce Land. I modified the code slightly to pass in input and output arguments.
From the output of the DCT, coefficients 2 through 16 are kept and added into a separate coefficient matrix. Since there are 16 frames taken by each sample, and 64 coefficient frames are stored total, this entire process repeats 4 times, each time adding more coefficients to the matrix until it is full.
When the matrix storing the 4 sets of coefficients is full, the number of zero-valued coefficients are counted. If the value is larger than a preset value, then a message is displayed on the LCD that a new sample is required. This occurs when too much of the detected input is silence.
Training - Vector Quantization
Vector quantization, as mentioned in the background mathematics section, is a form of data compression used to save information obtained from sample processing for matching later. Vector quantization works as a multi-point mean of the obtained coefficients to produce 8 values representative of the sample data as a whole. Producing a functional vector quantization algorithm in C was one of the most difficult aspects of the project to produce.
We wrote the Linde-Buzo-Gray algorithm for vector quantization, first in MATLAB and then in C to obtain these values. We used MATLAB first as it was much easier to write and debug. The results of the MATLAB code producing 8 centroids from 64 coefficients are shown below.
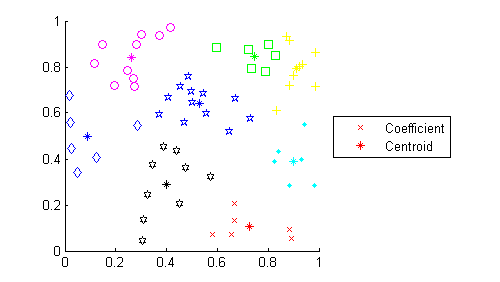
Figure 12: Simulated speech coefficients and their associated centroids
The asterisk marks represent the centroids of each set, and the other shapes represent the coefficients. Each set that is the same color and shape have the same closest centroid, and the centroid position is at the center of the set.
Once the code was written in MATLAB, it was ported to C with some necessary changes for the hardware. Since the algorithm requires division where the denominator cannot be set to a fixed value, it was necessary to use Bruce Land’s divfix algorithm for fixed point division.
It was also necessary to monitor values while looping through the algorithm to ensure no overflows occur throughout the process. To solve the problem of overflows, vector distance values could be shifted as necessary as long as the shifting was consistent to all values. The fact that many parts of the algorithm do not require accuracy of absolute magnitudes but only relative magnitudes was something that could be taken advantage of to improve efficiency. For instance, when it became necessary to find a Euclidean distance from a single point to a centroid and compare it to distances to other centroids, the square root following the sum of squares could be ignored, since the values themselves are not important, only the relative magnitudes of the values.
The UART was crucial to develop and ensure the functionality of the Linde-Buzo-Gray algorithm. The values were compared throughout the process using print statements and comparing the outputs to the functional MATLAB code.
When the function determines the centroid values, they are stored in an array in the system. The MCU is set to store up to three sets of centroids, but can be easily adjusted to store more.
Testing - Euclidean Distance Summing
When testing instead of training, the program takes a different protocol. Looping through each coefficient of the sample set (64 total), the Euclidean distance to each centroid in one of the stored sets of training centroids is determined. The minimum of these distances is added to a running distance counter between the sample and the stored training set.
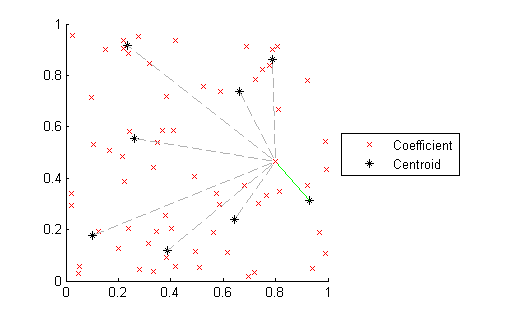
Figure 13: Matching new samples to existing centroids
The image above illustrates this idea. Only the minimum distance is used, while the other distances are ignored. This is performed for each stored set of training centroids to get the final output of total distance to each of the three stored samples.
This process requires performing the square root of fixed point values. We created our own code to perform this process based on the shifting nth root algorithm optimized for base two. The algorithm is similar to the way long division is performed by hand in elementary school, and uses no fixed point multiplications or divisions, only addition, subtraction, and bit shifts.
When the distances are determined, they are printed to the LCD and the process is complete.
Hardware Design top
Our project was not very hardware intensive and most of the physical components we used were primarily to amplify or filter our audio input signal.
Microphone Circuit
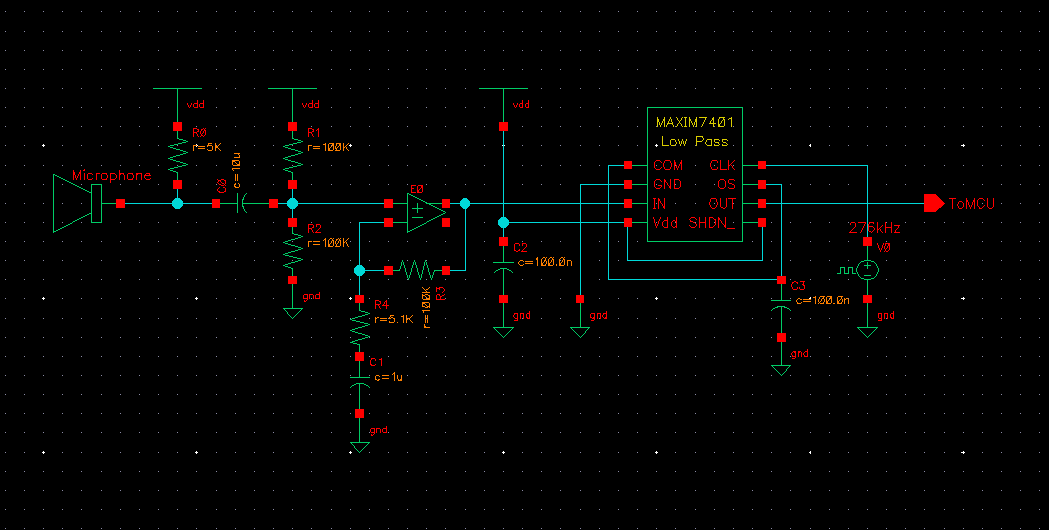
Figure 14: Microphone circuit schematic
This schematic consists of 4 parts: An initial, passive high pass filter, a voltage divider, an active high pass filter, a MAX7401 commercial low pass filter.
The initial high pass filter is a simple RC circuit to filter out the DC component of the input signal as it contains no speaker specific information. We used a cutoff of 1/(2πRC) = 3.18Hz.
After low passing the signal, we put it into a voltage divider to bring the DC offset to 2.5 volts.
The next step was to amplify the signal to a magnitude where we could reliably extract information. We used a simple op-amp with negative feedback for a predictable gain and cutoff frequency. The transfer function for this amplifier is (1,051s + 10,000)/(51s + 10,000) and the magnitude vs. frequency is shown below.
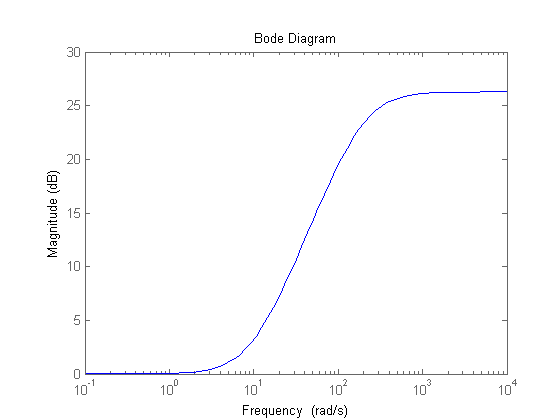
Figure 15: Bode plot of Op Amp Gain
The final part of our microphone circuit is a commercial MAX7401, 8th order low pass filter. The pinout and typical operating circuit are as follows:
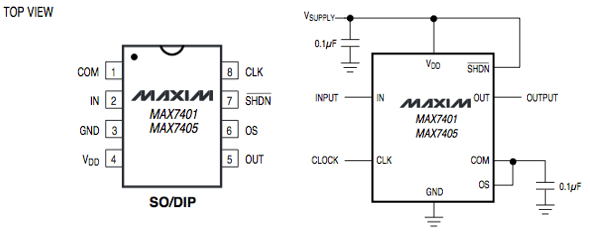
Figure 16: MAX7401 pinout and typical usage schematic
We set the cutoff of this filter to 2.76 kHz according to the part specifications in our circuit. We wanted a cutoff that was near 3kHz to be certain that no aliasing would occur sampling frequencies of 4kHz. We used the oscilloscope and tuned the input to get the actual cutoff at about 3kHz.
Additional Hardware
Other hardware that we implemented but were not part of this filtering stage were a potentiometer to control the sound threshold of the microphone, switches that were used to change the mode of operation, and various LEDs that made use easier.
The potentiometer is used in a voltage divider to be compared to port B2, the output of the MAX7401 mentioned above. If the output is higher than the preset threshold, we keep the samples.
We use three green LEDs to show that previous data has been stored to match to. When the device is restarted and set to Training mode, these will turn off and the user can set their recordings. After these three initial recordings are done, any additional recordings will overwrite previous data in a FIFO order.
One red LED is used to alert the user that the device has collected enough samples and it is okay to stop speaking. There is one last LED on the microcontroller itself that turns on when the device is taking in, but not necessarily recording, speech data to further ease use.
Results top
In order to test our device we developed a “locked-door scenario” with three different speakers. In total there are 4 different main tests, each varying initial conditions. These conditions are the two primary areas of interest: 1) speaker identity (male, female, identity as a whole: e.g. Rishi or Robert?) and 2) sampled input (which word is placed in). Varying these testing scenarios provided insight in the challenges of recognizing human speech across varied human speakers, as well as across varied words. Additionally our last test recognizes the inherent difficult in transforming human voice in general – which can vary largely in output - by taking samples from a tone generator – i.e. a consistent, and closer to “ideal”, source of audio.
Throughout the testing procedure we maintained the following definitions, each are with reference to a “locked door” scenario:
- Speaker – places the initial sample, and will be the point of reference for entry. For the speaker we expect to have multiple matches – unlocking the door.
- Intruder – relays the initial sample and will try to break into the system. For this speaker we expect to have multiple mis-matches – keeping the door locked.
- Threshold – distinguishes between a match and mismatch. It utilized the computed 32-dimensional difference between samples and each computed centroid to separate between matches (a smaller distance) to mis-matches (a larger distance). The threshold value set by the program is 7500.
- Unlock Ratio – Ratio between number of unlocked entries and total entries. In the case of the speaker, a high unlock ratio is desirable.
- Lock Ratio – Successful locking ration, between the number of locked entries and total entries. This is geared towards the intruder, whom in this case we do not want to unlock the door.
After testing it was interesting to note that throughout each testing there existed threshold values which varied according to the scenario. Furthermore, it can be noted that in each scenario there exist optimal threshold values that will best separate the speakers and intruders. This is an interesting characteristic for potential improvements to the device – being able to predict thresholds per scenario can improve UL and L success ratios.
Test 1 - "Unlock"
The first test uses the word “unlock”, with male speaker Jake Streb and male intruders Robert Lopez and Rishi Sharan. Success ratio for this test for both unlocking and locking metrics is relatively high with respect to later tests. We attribute the greater success in this test to the lower frequency of “unlock”, when compared to “bubble” – a higher frequency word. Across a set of male users, with the same low-frequency word it is likely that there were different undertones which provided little distortion in distinguishing between speakers and intruders.
| Jake Speaking "Unlock" | Threshold: 7500 | |||||||||
| Jake Matching | 1 | 2 | 3 | 4 | 5 | 6 | 7 | 8 | 9 | 10 |
| Sample 1 | 5554 | 5422 | 3458 | 5476 | 8159 | 7623 | 5659 | 3064 | 4297 | 3306 |
| Sample 2 | 6579 | 6417 | 3523 | 6081 | 12931 | 11663 | 6224 | 2548 | 8157 | 3362 |
| Sample 3 | 5234 | 4976 | 4186 | 5342 | 11138 | 10753 | 5644 | 2910 | 5055 | 3144 |
| Unlock Ratio: 76.67% | ||||||||||
| Robert Matching | 1 | 2 | 3 | 4 | 5 | 6 | 7 | 8 | 9 | 10 |
| Sample 1 | 6233 | 12231 | 7379 | 6312 | 9369 | 10765 | 7332 | 16490 | 9833 | 5951 |
| Sample 2 | 6818 | 12364 | 8067 | 7122 | 9512 | 11689 | 7448 | 16008 | 12936 | 6909 |
| Sample 3 | 6149 | 12119 | 7527 | 6672 | 9015 | 11031 | 7139 | 16587 | 11321 | 6267 |
| Lock Ratio: 57.66% | ||||||||||
| Rishi Matching | 1 | 2 | 3 | 4 | 5 | 6 | 7 | 8 | 9 | 10 |
| Sample 1 | 22000 | 12066 | 15616 | 16568 | 31624 | 12561 | 18250 | 12692 | 16816 | 2944 |
| Sample 2 | 15048 | 14945 | 13516 | 11920 | 23276 | 8703 | 10920 | 13761 | 11460 | 3645 |
| Sample 3 | 22577 | 13522 | 15563 | 17257 | 31810 | 12345 | 17880 | 15006 | 15583 | 3441 |
| Lock Ratio: 90.00% | ||||||||||
Test 2 - "Bowl"
The second test uses the word “bowl”, with female speaker Gulnar Mirza and male intruders Jake Streb and Rishi Sharan. The second test again performed relatively well when compared to “bubble”. Lock success ratios performed slightly less than Test 1, but still provided a higher-speaker matching unlocking ratio. We attribute similarity in success to the low frequency phrase “bowl”. We can also attribute higher distinguishing success for the speaker to the change in gender. It is possible that in using the higher frequency speaker – high frequency correlating with female speech, it is easier for our device to confirm that speaker. Additionally, the lower frequency undertones might have passed into the initial speaker sampling and matched with intruders, reducing the efficacy of locking.
| Gulnar Speaking "Bowl" | Threshold: 7500 | |||||||||
| Gulnar Matching | 1 | 2 | 3 | 4 | 5 | 6 | 7 | 8 | 9 | 10 |
| Sample 1 | 5848 | 6434 | 6708 | 9841 | 14145 | 1274 | 1750 | 6961 | 966 | 2964 |
| Sample 2 | 4147 | 6231 | 3816 | 6041 | 8989 | 2558 | 2865 | 7487 | 1987 | 3335 |
| Sample 3 | 3750 | 6698 | 3546 | 5282 | 8633 | 2196 | 2835 | 7553 | 1447 | 3919 |
| Unlock Ratio: 83.33% | ||||||||||
| Jake Matching | 1 | 2 | 3 | 4 | 5 | 6 | 7 | 8 | 9 | 10 |
| Sample 1 | 14620 | 38300 | 3101 | 6450 | 14309 | 26275 | 13533 | 19649 | 33554 | 18617 |
| Sample 2 | 12035 | 34853 | 3246 | 7891 | 12679 | 23754 | 12075 | 18198 | 30458 | 11985 |
| Sample 3 | 13397 | 38890 | 3489 | 6832 | 12954 | 25306 | 11574 | 18453 | 34113 | 19954 |
| Lock Ratio: 83.33% | ||||||||||
| Rishi Matching | 1 | 2 | 3 | 4 | 5 | 6 | 7 | 8 | 9 | 10 |
| Sample 1 | 6886 | 17827 | 19554 | 4659 | 9190 | 8110 | 30528 | 21075 | 62803 | 30941 |
| Sample 2 | 7971 | 19939 | 18632 | 6139 | 5860 | 6265 | 25979 | 21435 | 61796 | 26864 |
| Sample 3 | 5670 | 18084 | 18967 | 3625 | 8961 | 7689 | 29531 | 20666 | 61865 | 29809 |
| Lock Ratio: 76.67% | ||||||||||
Test 3 - "Bubble"
The third test uses the word “bubble”, with female speaker Christine and male intruders Samir Borle and Peter Li. The third test has the least success throughout the tests. Unlocking is still similar to the first two tests. At the very least we can indicate that roughly 80% of the time a speaker will not be able to enter through the door if they are intruding. Additionally, it should be noted that the threshold for these results is much higher than the previous tests. With an optimal threshold around 15000, about 2x the second and slight more for the first. We can attribute this change to a higher frequency word “bubble”. The higher frequency poses the potential for greater variations in centroid distances, and is possibly the reason for the threshold increase. Lastly, if we compare the “bubble” test to the “unlock” test then again we see lowered unlocking success ratios. We again attribute this to the change in gender – with the female frequency undertones matching male, leading to a greater number of intruders passing through.
| Christine Speaking "Bubble" | Threshold: 7500 | |||||||||
| Christine Matching | 1 | 2 | 3 | 4 | 5 | 6 | 7 | 8 | 9 | 10 |
| Sample 1 | 33396 | 36896 | 46796 | 44344 | 50165 | 41999 | 53286 | 919 | 46540 | 47141 |
| Sample 2 | 5329 | 14196 | 6275 | 3864 | 12017 | 10291 | 10670 | 39221 | 5954 | 2101 |
| Sample 3 | 38540 | 13817 | 6029 | 2177 | 12519 | 8206 | 10670 | 42181 | 6040 | 2101 |
| Unlock Ratio: 33.33% | ||||||||||
| Samir Matching | 1 | 2 | 3 | 4 | 5 | 6 | 7 | 8 | 9 | 10 |
| Sample 1 | 44083 | 55897 | 51485 | 45147 | 35618 | 38016 | 46911 | 44636 | 55633 | 12966 |
| Sample 2 | 12496 | 14559 | 17993 | 20893 | 27538 | 21899 | 20389 | 13557 | 19429 | 52064 |
| Sample 3 | 10028 | 14113 | 17359 | 19405 | 22758 | 27783 | 24348 | 17829 | 18770 | 15829 |
| Lock Ratio: 100.0% | ||||||||||
| Peter Matching | 1 | 2 | 3 | 4 | 5 | 6 | 7 | 8 | 9 | 10 |
| Sample 1 | 52505 | 46649 | 44125 | 51711 | 16599 | 4761 | 49807 | 24181 | 57405 | 11094 |
| Sample 2 | 24247 | 18667 | 25801 | 23703 | 40834 | 61043 | 46351 | 46756 | 44338 | 51645 |
| Sample 3 | 23357 | 18042 | 27665 | 26545 | 1313 | 20401 | 65067 | 34123 | 32360 | 6453 |
| Lock Ratio: 90.00% | ||||||||||
Speed of Execution
Execution is in real-time - providing an answer to a match of a speaker within a period that is near one second between placing the sample and receiving a result. We were very satisfied with this result as we knew starting that the limited processing power of the ATmega1284p would be a challenge when implementing complex signal processing and mathematical algorithms. We attribute the relatively fast execution time to the use of fixed point values instead of floating point, as well as the careful implementation of the code. The speed of input is largely the greatest constraint, requiring a user to spend a few seconds re-uttering phrases, e.g. bubble, before receiving a match. To remedy this, the design could be modified to take in only one utterance at a time, and stopping when the user is done speaking. This would make this delay only as long as when the user is speaking, ensuring they do not have to wait extra time.
Accuracy
Detailed results showing the accuracy of a few phrases is shown above. When we tested it, the person who trained the device typically matched significantly more than users who did not. We seemed to have more false negatives than false positives, which is appropriate for a security measure. Still, if the device were to be used as a serious security measure its accuracy would need to be greatly improved.
Safety
With no harmful currents – e.g. power supplied only for the LED, OpAmp and MCU – or emission of electromagnetic waves from our system we believe that there is little to no harm in using this setup. Furthermore, our system is primarily mathematically-heavy coding which is based in the MCU. There is little room for harm, or hurt to any-user. We have made our design choice with these factors in mind, understanding our responsibility towards providing safe and effective devices for the public and environment.
Interference with Other Designs
When testing our circuit, we initially had some interference from ambient noise. We used the analog comparator to determine when an appropriate volume signal was entering the microphone so that it would not be triggered by background noise. Otherwise, our project has few interference considerations.
Usability
Device usability does face constraints if used on on a commercial scale. As mentioned, there are several instances where intruders are incorrectly let through the locking scheme, or speakers are locked out. In addition the procedure for placing samples is not entirely effective for the purpose of a locking scheme. While our speed of execution is excellent - functioning in real time - the requirement to repeat a phrase for a few seconds would not hold in a practical application. However given the constraints of the mcu functionality and memory space, these are somewhat expected concerns. The challenge of getting the mcu to function as it does for speaker recognition is a great feat in itself, and when measuring usability to this standard it functions nicely. We knowingly chose a project that requires a very large amount of mathematical knowledge and software design and analysis to perform properly, and with additional work we believe it could eventually become viable for use as a low level security system.
Conclusions top
Future Work
There are several improvements to the design that could be made in the future. One aspect of the underlying mathematical design that was forgone was taking the log of the power spectral data post DFT in order to make our computation faster and to lower memory requirements. This would have better approximated the human ear and likely would have improved our accuracy.
Furthermore, we did not test different microphones which could have had an impact on the accuracy of the results.
Another design improvement we conceived too late was to create a dynamic threshold for unlocking. Currently it is based on a static value. Based on testing, some locking phrases are more complex than others and tend to give worse results for all users, whether they trained the lock themselves or not. A dynamic threshold could adjust for this phenomenon.
Finally, much more analysis in general could be done on all of the processes. The implementation of complex mathematical concepts in C required many design decisions to be made that could have impacted the accuracy in ways that are difficult to predict. Ideally, even more analysis would be leant to the processing to try to achieve as much accuracy as possible.
Intellectual Property Considerations
All work in building this project – taken from outside sources – is properly credited.
Some of the code we used was created by others and some was released in the public domain.
We are not seeking a patent for our device and our code is shared on this website.
- The FFT function used was code created by Tom Roberts and Malcolm Slaney and modified by Bruce Land.
- The DCT code was produced by Luciano Volcan Agostini, Ivan Saraiva Silva, and Sergio Bampi and adapted to GCC by Bruce Land.
- Bruce Land’s code for fixed point multiplication and division.
- UART usage code produced by Joerg Wunsch.
- LCD library code distributed under the GNU Public License.
Ethical Considerations
We have considered our project in accordance with the IEEE code of ethics, and find no conflict of interest, events of bribery, disparaging impacts on a particular race, class or member of society (other than perhaps the speech-impaired – however this was not intentionally discriminatory, nor implicitly so – rather by definition of the device this is an understandable constraint.) implicated in our project’s outcome or throughout its development.
We make no claims to content that we did not create ourselves. All code which was created by others and all sources are cited near the bottom of the page. We are grateful for the ability to include work provided by others to help put our project together.
As part of our dedication towards serving the public, we will maintain the consistency of these claims and ensure that these factors do not change from where we have maintained them. In testing our product, we will – to the best of our ability – fully disclose all data that is correct and accurate. Lastly, we will do our best to keep our work fair and consistent, effectively considering any advice or input for our design, treating all input with respect, and making all further changes or considerations to our design and testing in compliance with our commitment to the IEEE Code of Ethics.
Legal Considerations
This project does not have any significant or reasonably viable legal concerns. All of the code is openly credited to users. Our hardware, which is minimal (e.g. a microphone, typical resistors, capacitors, wire, MCU LCD, and op amp) is not patented technology, and quite accessible to the public. All referenced sources are provided below.
Appendices top
A. Schematics
Microphone circuit

LCD connection table
B. Cost & Parts List
| Part Number | Vendor | Quantity | Price | Total Cost |
| ATMega1284 | Lab stock | 1 | $5.00 | $5.00 |
| LCD Screen (16x4) | Lab stock | 1 | $8.00 | $8.00 |
| Microphone | Lab stock | 1 | $5.00 | $5.00 |
| Microphone Plug-In Adapter | Lab stock | 1 | $0.25 | $0.25 |
| LM358 OpAmp | Lab stock | 1 | $0.00 | $0.00 |
| MAX7401 CPA+ Low Pass | Maxim Semiconductor | 1 | $0.00 | $0.00 |
| Push-Button | Lab stock | 1 | $0.00 | $0.00 |
| Switch | Lab stock | 1 | $0.00 | $0.00 |
| LED | Lab stock | 4 | $0.00 | $0.00 |
| Potentiometer | Lab stock | 2 | $0.00 | $0.00 |
| Resistor | Lab stock | 22 | $0.00 | $0.00 |
| Capacitors | Lab stock | 4 | $0.00 | $0.00 |
| Wire (Units in feet) | Lab stock | 5 | $0.00 | $0.00 |
| Total: | $18.25 | |||
C. Distribution of Work
| Jake Streb | Rishi Sharan | Robert Lopez |
|---|---|---|
| Software Design & Implementation | Assistance with Underlying Mathematics | Hardware Design & Implementation |
| Investigation of Process Methods | Investigation of Process Methods | Research and Purchase of LPF |
| Testing | Testing | Testing |
| Website | Website | Website |
D. Code Listing
Main code:
speech_lock.c
UART code (used for debugging):
uart.c Created by Joerg Wunsch
uart.h Created by Joerg Wunsch
LCD code:
lcd_lib.c Distributed under the GNU Public License
lcd_lib.h Distributed under the GNU Public License
Acknowledgements top
Many thanks to Bruce, and the ECE 4760 TAs. In particular we would like to thank – Yuanyuan and Eileen for their attention and support to our projects, and final design. We would also like to thank Bruce for all of his support code – which not only integral in completing our design, but teaching us throughout.