
ECE 4760 Final Project
Matt Hagen - mrh53
Grant Tarsi - gmt24
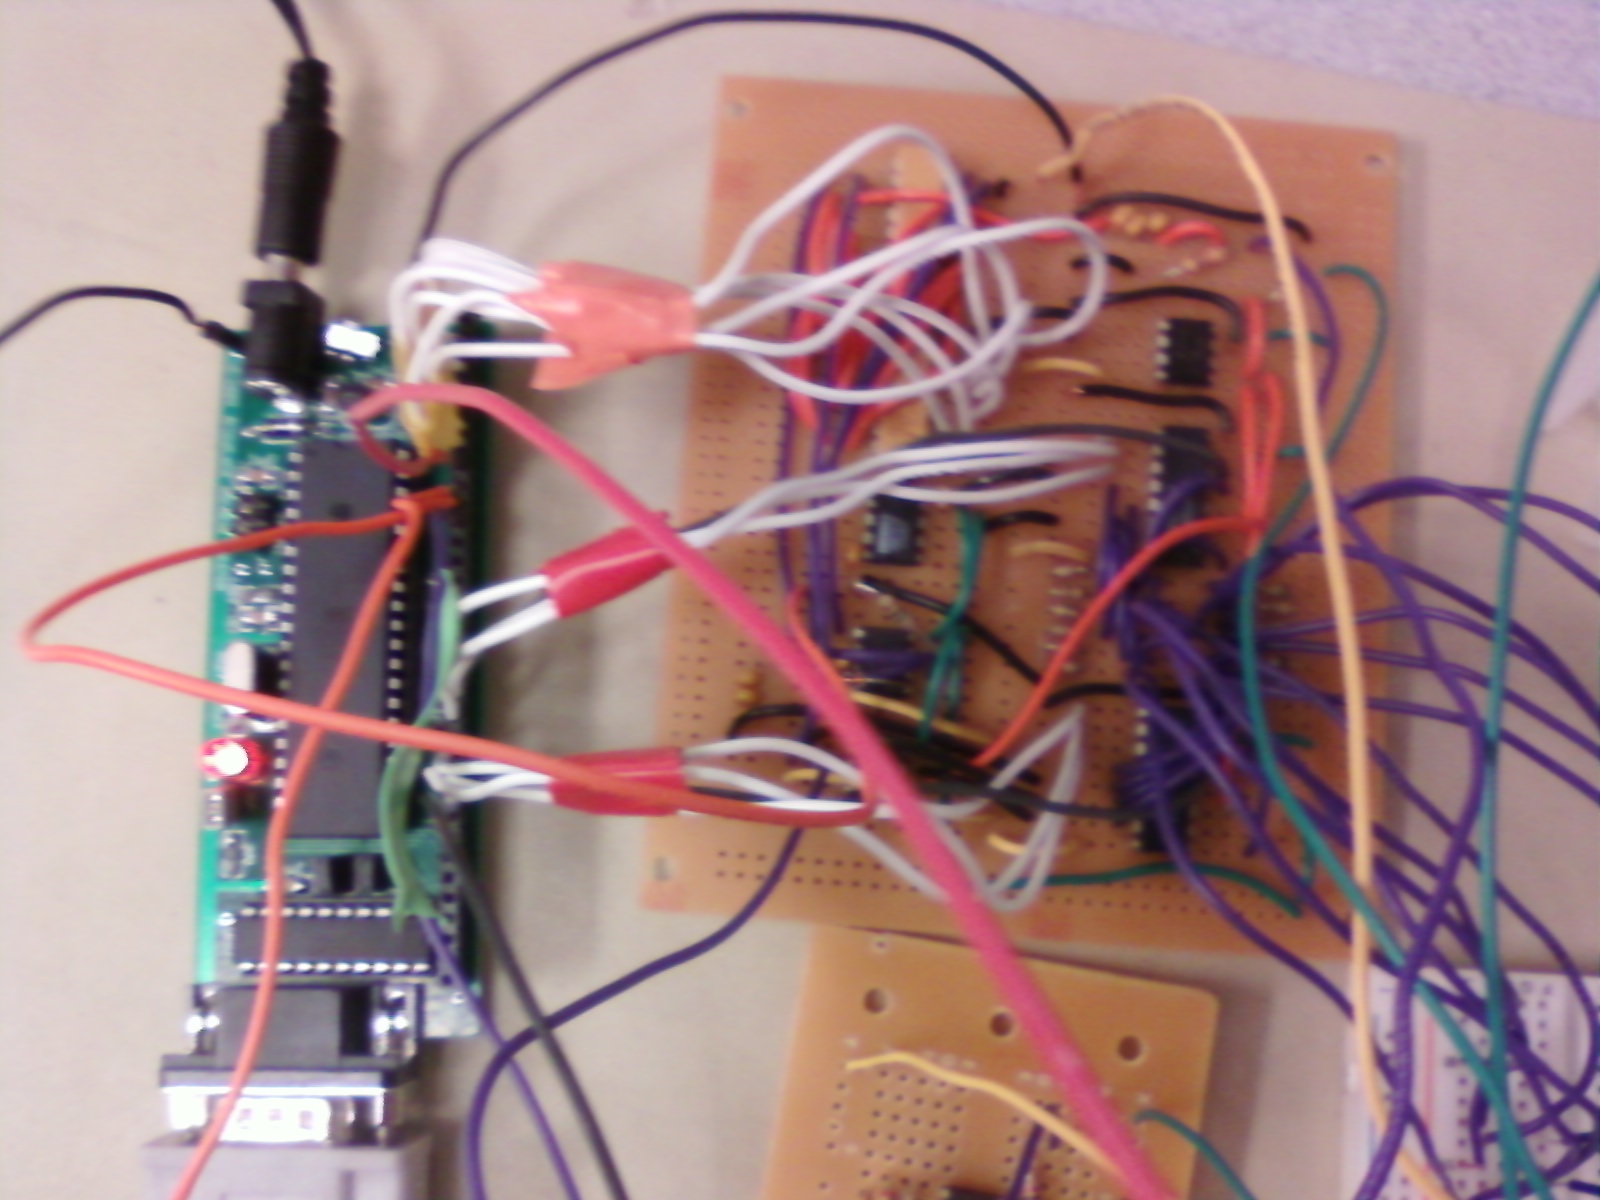
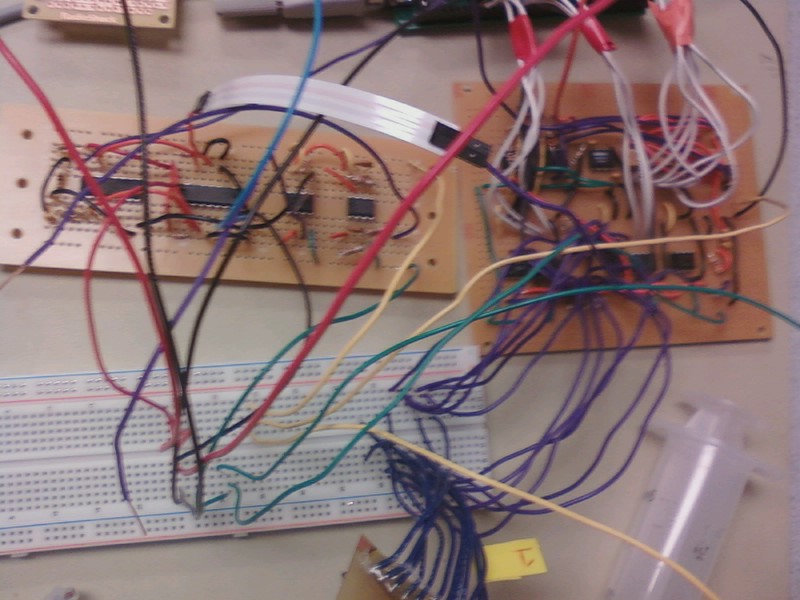
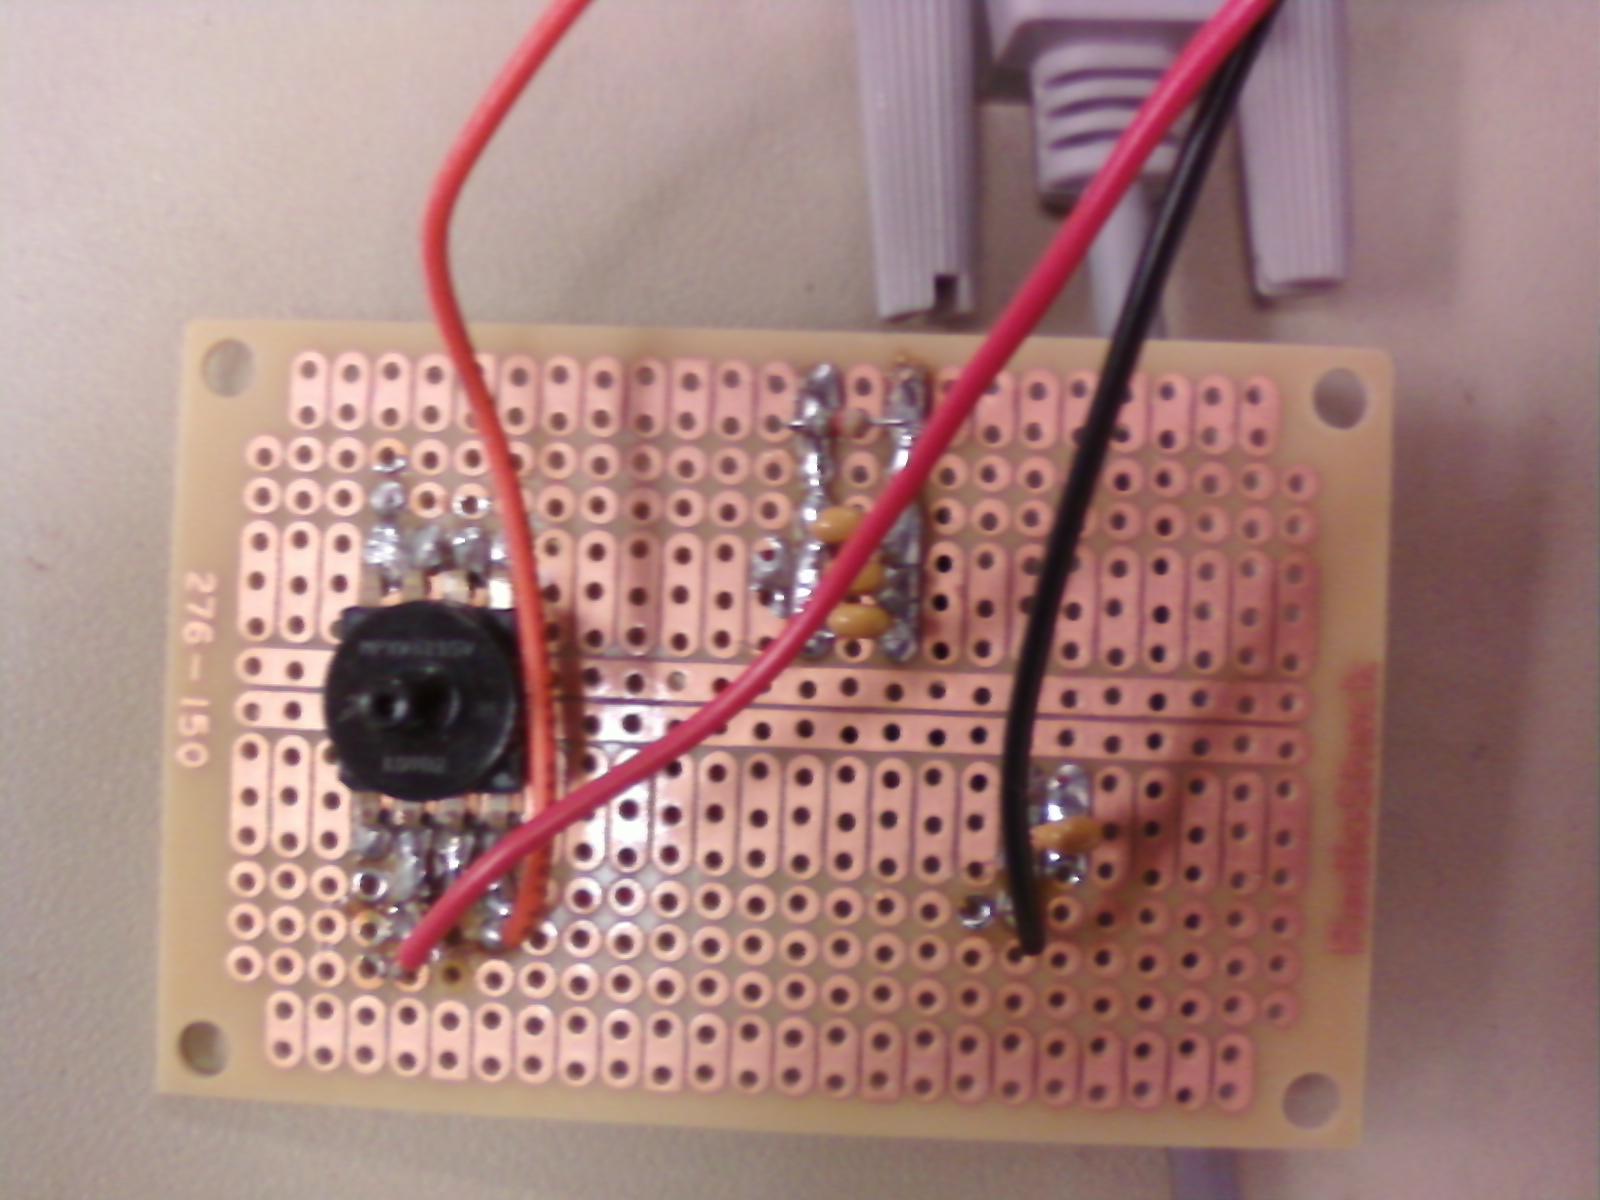
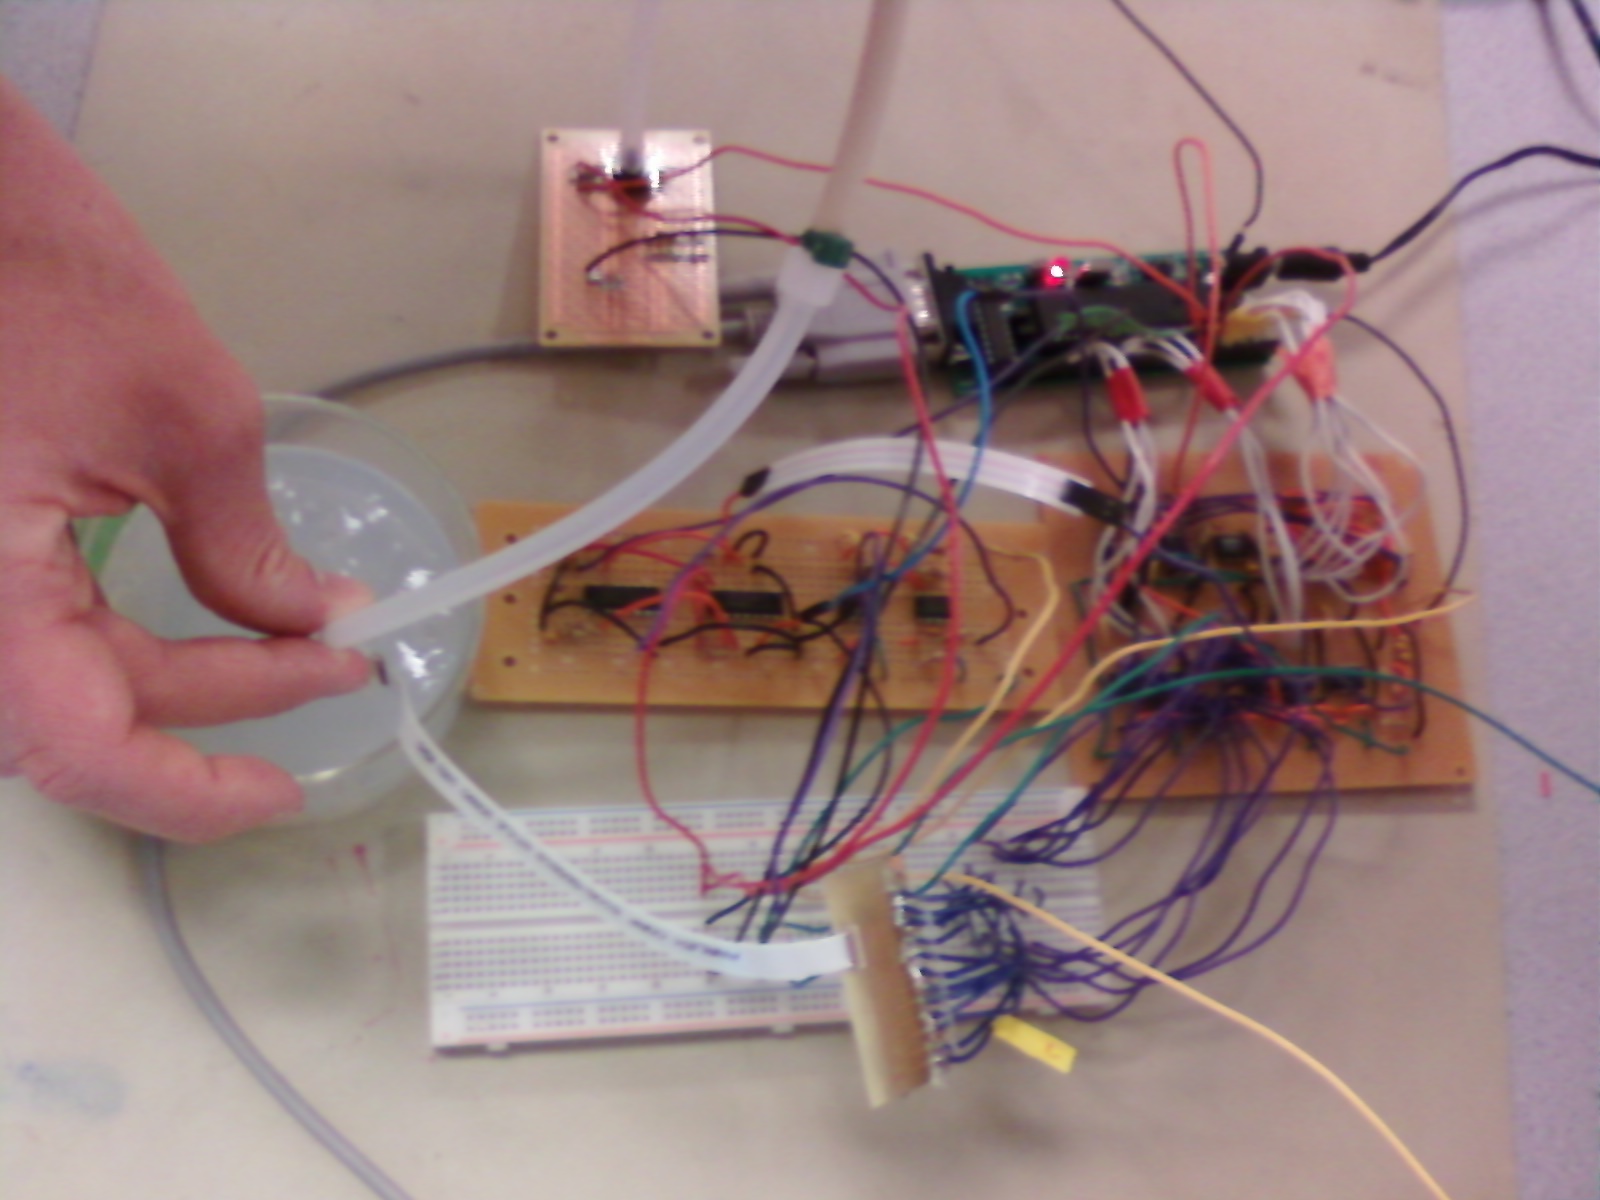
Pictures


Introduction
Our project measures and analyzes the electromechanical properties of tissue using a probe containing a microarray of electrodes, to aid as a tool in predicting the health of the tissue sample.
“Despite significant efforts to develop early detection strategies for breast cancer, the diagnostic efficiency remains poor. Approximately 1 million breast biopsies are performed annually as directed by mass screenings, but 70-80% of these are negative for cancer at an expense of $2.6 Billion. The locally destructive nature of these biopsies incurs a 60% risk of serious morbidity including lymphedema and nerve damage. The spectrum of new devices and methods that have or will reach the market are marginal improvements to the same basic approaches. Our objective is to create a device to diagnose tissue health nondestructively with sensitivity comparable to excisional biopsies.” – Dr. Jonathan Butcher, research advisor
The foundation of our device is a complex impedance analyzer that is tailored to operate in the desired region of normal tissue impedance. An RC circuit similar to the following can approximate the impedance of biological tissue:
Figure 1:
Circuit Model of Biological Tissue
The hardware of our project is responsible for producing signals that accurately reflect the resistance between electrodes and the phase shift caused by capacitive elements of the tissue. Our Atmega644 generates varying sinusoidal voltage waves that are stimulated through the tissue, and converts the analog signals from our circuitry into digital representations of the acquired data. The data is serially sent to a remote PC, and is utilized by Matlab for analysis.
High Level Design
Our project was inspired by current research of one of the team members, Grant, in the Biomedical Engineering Department at Cornell. He is investigating how mechanical stresses to tissue can provide information on the tissue’s health. Electrical tomography devices currently exist in the medical community, however, they focus just on analyzing electrical signals through the body to spot abnormalities. No major projects currently utilize a system that manipulates both electrical and mechanical properties of tissue at once in attempts to characterize its health, and thus a potentially attractive, yet nondestructive device lends itself to our ECE 476 project. Grant’s previous work in the research group had been to develop a simple two-electrode probe that could apply a suction pressure to tissue, and monitor the electrical resistance between the electrodes in hopes to find a correlation between elongation and resistance. Currently, a more sophisticated probe was developed with a microarray of 6 pairs of electrodes, and a more elaborate method of testing could now be used.
Figure 2: Acquired Data from Single Electrode Probe
First, the electrode array provides increased sensitivity for measurements, because it can collect impedance data from 6 distinct points along the tissue sample. Also, it provides a way to measure the elongation into the pipette non-optically, and can generate a stress-strain curve for the tissue sample. A set of known distances within the pipette can be established since the electrodes are spaced equally throughout the array at 250um apart, with a width of 250um. When tissue first crosses an electrode pair, the resistance between the two nodes drops from an extremely high value (since it is equivalent to an open circuit), to a real valued resistance. This initial drop in resistance can be equated to the tissue just reaching the electrode, and therefore correlated to the distance the electrode is into the pipette. By monitoring the pressure before each impedance reading, we can quickly establish a stress-strain point from this information. Further, when tissue completely covers an electrode, the resistance saturates to a fairly constant value, allowing us to establish another pressure vs. length data point. We can then generate a stress-strain curve with 12 data points; while the resolution and accuracy of this method could be increased with more electrodes for future models, our current electrode array provides enough data for initial research and testing.
Impedance is a complex number that represents the resistance as its real part and reactance as its imaginary part. The phase angle of impedance gives the phase difference between the voltage and current in the system. Resistors have entirely real impedances, and capacitors are entirely imaginary. By measuring the voltage across an unknown load for a given current, we are able to calculate the magnitude of the impedance using the formula Z = V / I. Then, if we know the phase angle, we can find the resistance and reactance of the load.
This is the basis of our impedance circuitry. A constant current source generates a consistent current, which is driven across a load, in our case a tissue between a given set of electrodes. By building circuitry that captures the resulting voltage drop between the pair of electrodes, we have the necessary data to form the relationship between current, voltage and impedance. Our circuitry also utilizes a phase comparator that detects the resulting shift between the input sine wave, and the sine wave that results from stimulation across the tissue.
We used a hardware resistor ladder combined with a sinusoidally varying 8 bit variable to generate our sine wave. We started by creating a sine look up table with 256 values spaced evenly throughout the period of a sine wave. We would assign one of these values to the output based on a memory look up. The index of the memory input was an 8-bit char that was actually the highest 8 bits of a 32 bit phase accumulator. The accumulator is updated at 125 kHz by adding a predetermined increment to it. The increment is determined by what frequency output is desired. A small increment may cause the 8 most significant bits to remain unchanged for many accumulator updates. One of the early trade offs we were forced to make was how fast to have these updates occur. Higher frequency updates allow greater resolution of the sine wave, while lower frequency improves the performance of the rest of the program by minimizing the number of hardware interrupts that pause execution to allow the ISR to execute.
We only used the 7 most significant bits of the MCU output to drive our resistor ladder. Adding the 8th bit would not have increased the peak voltage much and would not have had any effect on the resolution of the wave. These bits enter the voltage ladder, which acts as a voltage summer, with each bit weighted differently.
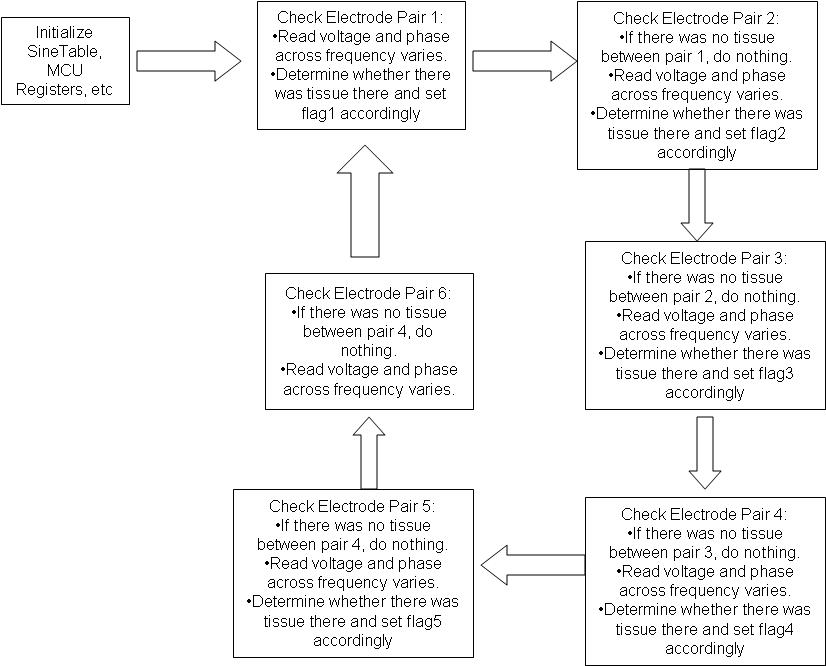
Figure 3: Flowchart of C Program
The major hardware/software tradeoff we encountered entailed the generation of our input voltage sinewaves. We chose to utilize a resistive ladder for digital to analog conversion, and this limited our ability to produce smooth input waves above 10kHz. This was not too much of a concern for us, however, since most biological tissue testing uses frequencies ranging only up to 100kHz. We realized the higher order of magnitude would be very difficult to generate and is often less important in analysis, and decided only to pursue frequencies below 10kHz.
Another tradeoff occurred in the implementation of syncing Matlab with the MCU. In order to ensure the first values that Matlab received were from the first data points taken, we had to first run the Matlab script files, followed by turning on the MCU afterwards. Given more time for project implementation, we could have implemented this feature, but it was not a priority for us during development.
Medical devices require attention to the details of IEEE standards, such as isolation of the user/patient from 120V sources. Since our device is currently only going to be used on hydrogels and excised animal tissue samples, this isolation is not necessary. Also, IEEE Standard 1073 regulates medical device communication, and although it did not impact our project directly, it might be a Standard to abide by for long-term implementation of a device similar to ours.
Program Details
Our software is made up of two parts: the C program that controls the MCU and the Matlab script that receives data from the MCU and analyses it. The primary task of the MCU is to control the electrodes, collect data from the probe and pressure sensor, and transmit that data to the computer. The Matlab script first receives this data and then performs some calculations on it, eventually graphing the impedance measure by each set of probes against the pressure on the tissue at that point.
C Program
The C program consists of a single ISR that handles basic timing and sine wave generation, a main function that schedules the probe readings and 6 nearly identical functions that each takes readings from a pair of electrodes. The ISR is set up so that it executes on the timer0 compare match at 127. This means the routine is executed at 125kHz. It’s primary purpose is to generate the sine wave. In software, this is done similarly to the DDS from lab 2, where a 32 bit accumulator is incremented by a different amount depending on the desired frequency and the top 8 bits are used to generate a sine wave via lookup table. However, unlike lab 2, we don’t output this wave through the PWM. Instead, we take the result of the sine table look up and output it through a resistor ladder as a manual digital to analog converter. The second function of the ISR is to decrement the function timers every millisecond to establish the time base.
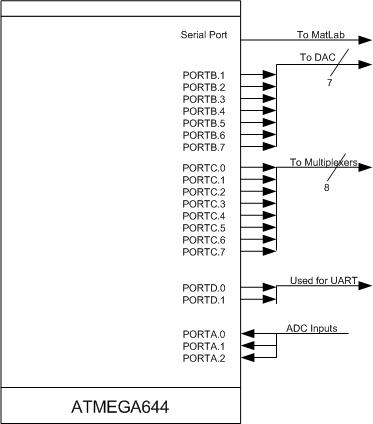
The main function performs a couple basic actions. First, it initializes the sine table that is used for the sine wave generation. Next it calls the initialize function which performs the standard MCU set up. It sets up the uart so we can use the serial connection to communicate with the PC, sets up timer0 as was already described, sets up PORTA as an input and PORTB, C and D as outputs, initializes the time counters and various flags, sets up the ADC for its first input and turns on the interrupts. Finally, the main function enters a timing loop that executes forever and calls the various tasks whenever they are due.
Each task is designed to perform the same functions, just to a different set of electrodes in the probe. First each task outputs the number of the probe that is about to take the readings. This is so the Matlab script can organize the data by probe to develop an elongation distance estimate. After this, the MCU measures the pressure in the tube. This requires setting the ADC to read PORTA.0 and then taking a reading. While the conversion is happening, the program simply waits idly for it to finish before outputting the pressure to the serial port. Next, it will measure the resistance (IMPEDANCE???) and phase shift of the sine wave through the tissue at 100Hz, 500Hz and 1000Hz. To do this, we change the input to the ADC to PORTA.1 for the resistance (IMPEDANCE???) and PORTA.2 for the phase shift and start a conversion. The increment is changed before every different frequency measurement and the sine wave is given a short period of time to settle into a steady state before measurements are taken. To minimize the disturbance from system noise, we actually perform 20 conversions (10???) for each reading and average the values together. These values are output to the serial port.
At the start, only the first electrode (on the tip) is tested in this way. When it encounters a non-infinte impedance (indicating the presence of tissue), it triggers a flag, which allows the second electrode to start taking measurements as well. When the second electrode starts to encounter tissue, the third electrode is activated, and on down the line. This scheme is more efficient than scanning all six electrode in series every time because if the second electrode hasn’t encountered tissue, then the third or fourth obviously would not have encountered any either.
Matlab Script
The Matlab script sets up a serial port object to read data from the MCU serial connection, and then enters a loop. In this loop, it reads raw data from the MCU in a certain order (discussed later) and then processes that data into real electrical values. We decided to do this on a PC instead of on the MCU both because of the PC’s better capacity to handle large numbers and complex calculations and because Matlab is far simpler to use for the calculations than C programming.
The data retrieval loop uses fscanf to get data from the serial port and performs calculations and sorting operations after it has gathered each piece of data from a given run of electrodes. At first we were concerned with the timing of performing these calculations between scans of the serial port, but doing so after all the data was collected was especially tedious. We decided to move it into the data retrieval loop after we reaized that the PC runs more than 100x faster than the MCU, and that it would be able to perform these extra with plenty of spare run time.
After all the data has been collected, the script writes it to a Excel file and outputs some plots of the data. It plots the impedance against the pressure for each of the six electrode pairs. These curves are interesting individually, and plotting them all on the same axis also allows us to infer some information about the elongation of the tissue into the pipette, which can also be useful in future diagnostics run on the device.
C-Matlab Interface
To minimize programming complexity, we decided not to worry about error checking the input to the Matlab script. We didn’t do anything in software to allow the PC and MCU to sync up on their own. Instead, we rely on a very specific data output from the microcontroller. Data is always output in the following order: electrode number, pressure, voltage at 100Hz, phase difference at 100Hz, voltage at 500Hz, phase difference at 500Hz, voltage at 1kHz and phase difference at 1kHz. If the Matlab script is activated when the microcontroller is in the middle of a continuous output, there is no guarantee that the correct data sets get stored in the correct variables in Matlab. To handle this, we always begin running the Matlab script while the MCU is powered off, and only activate it when Matlab is ready to receive input. One way we could have handled this is a simple activate button on the MCU that would allow the MCU to start taking measurements after a restart. Another more complicated method, if we had more time, would be to output a syncing character at the beginning of every function, just before the electrode number. The Matlab script could enter a while loop that waits for this character to show up, and once it does, it then procedes to read next values to their respective variables.
Software Hurdles and Solutions
For the most part, the software for this project came together fairly easily. The MCU’s primary function is to read an analog data signal and relay that data to the computer. Development of the Matlab software was fairly straightforward as well, taking data from a serial port, scaling it the appropriate amount and graphing it. One snag we did encounter was related to the length of time it took for our probe to take the impedance measurements. We were planning on running testing every pair of electrodes each time through the main loop to determine both the impedance and the elongation. Because it takes longer for us to take the measurement than we had anticipated, we had to come up with a more efficient way to do this and still produce the desired curves. We ended up with the scheme we have now, where electrodes are activated one by one, starting at the tip, only after the previous electrode has encountered tissue.
Another example of a problem we overcame was with our sine wave generator. Originally, our plan was to implement this sinewave using the PWM, similar to how we implemented the DTMF dialer in lab 2. However, after some preliminary testing, we discovered that this method did not produce smooth sine waves for frequencies greater than 3 kHz. At this point, we were planning on measuring impedances at10 kHz, so we changed our plan and implemented the DAC with resistor ladder that we currently have. While this was an improvement over the PWM, it was also unable to produce sufficiently smooth curves at 10 kHz, so we were forced to scale back our project.
Hardware
We generated our input signals through the 7 MSB of PORT B, using a digital to analog resistive ladder to interface the software and create a sinewave of controllable frequency. The resistors in the ladder were 1% DIPs of 10kW and 20kW. The resulting signal was fed through a passive high pass filter to center the wave on zero volts.
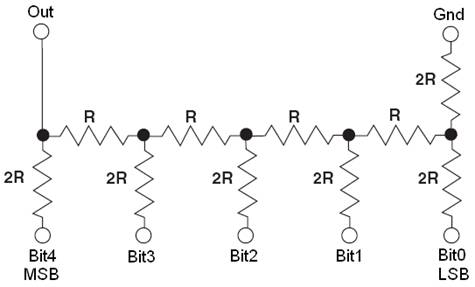
Figure 4: 5-bit resistor ladder, digital to analog converter
To generate a constant current, our design utilized a LM358 op amp configuration that input the initial sinewave over a resistor into the inverting input, while the non-inverting input was tied to ground. From the golden rules of op amps, this created a virtual ground at the inverting input as well. The output from the op amp was fedback to the inverting input through the load, in our case the tissue between two electrodes. This scheme was a basic implementation of an inverting op amp, and established a constant current over the resistive load in the feedback loop, since the current across Rin must be equal to the current through the resistive loop, since no current can flow into the inputs of the op amp.
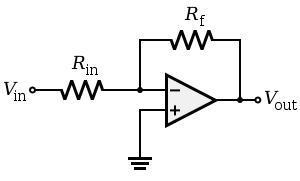
Figure 5: Inverting op amp constant current source
This setup allowed us to establish the following relationship for resistance of the tissue as the load:
ZTissue = Vout * Zin/Vin
For each frequency used, the input voltage slightly varied, but was always around 1.25V in amplitude (2.5V peak-to-peak). Since for a given frequency the input voltage was always the same, regardless of the load, we recorded these values for use in our calculations.
The input resistance was selected as 1MW. This resistance value generated a constant voltage of around 2.5mA. We desired such a small current so as not to overload the maximum current and voltage thresholds of our electrodes, which are around 100mV and 100mA. Based on previous testing and research, normal tissue resistances were observed around 5 – 20kW, which would be small enough to not overload the electrodes with a high voltage.
In order to select the desired electrode pair on the microarray, multiplexors were inserted on either side of the inputs to the electrodes. These multiplexors have 8-channels that propagate analog signals between the desired ports. They are also bi-directional, meaning a single input can be fed to one of eight outputs, or one output can be selected from eight different inputs. PORT C was used to control the channel selection and enable bits. When we first implemented the multiplexors in our circuit, we noticed significant cross-talk between channels. To alleviate this problem, we realized we had to tie all of the outputs through a large resistor to ground, in order for them not to float.
One of the most important features of our hardware was its ability to detect and represent the peak voltage of the sinusoidal voltage wave resulting from the load (tissue) being driven with a constant current. The first step in this process was to dig out the small signal caused by a low current amplitude. We utilized a INA121 differential amplifier to compare the difference between the output of the current source op amp and ground. The difference was amplified 50 times by placing a 1kW resistor across the gain pins of the INA121, based on the gain equation, G = 1 + 50kW / RG. Since the A/D convertors on the 644 accept a voltage range from 0 to 5 volts, a gain of 50 from the diff amp sets a theoretical upper limit for measurable resistance at 80kW; though our theoretical minimum would be 0W (i.e. a short circuit), this is not realistic. In order to produce an accurate, differentiable result, a practical minimum resistance would be around 1kW, since this would result in a voltage amplitude of .0625V, which could be represented by a digital 3, since the A/D assigns one bit for every .0196 volts input.
The amplified signal from the differential amplifier is fed into the non-inverting port of another LM358 op amp combined with a diode connected across the negative feedback loop. This creates an ideal diode that does not cause voltage loss between Vin and Vout. This serves to pass only the half of the sine wave (calues above 0V) from the differnential amplifier. By connecting a capacitor across the output to ground, we have created a peak voltage detector that stores the maximum voltage incident on it, in our case the peak of the sinewave. The diode does not allow the negative half of the sinewave to propagate and cause the peak voltage to oscillate between peaks of the sinewave. This capacitor holds the peak voltage until making PIN A.1 an output of 0V grounds the connection and discharges the capacitor. During voltage detection, PIN A.1 acts as an input to the A/D converter, and the ADMUX is set to 1. After each read at a stimulating frequency, A.1 is grounded to discharge the capacitor, and then reset to an input before the next read. A resistor is tied between Vout and A.1 in order to avoid floating values for voltage.
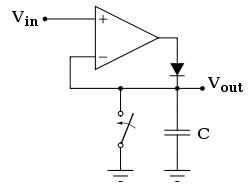
Figure 6: Ideal diode connection with peak voltage detector capacitor
A phase detector is implemented to determine the shift between input and output voltages. The input voltage wave is directed through an inverter and high-pass filter voltage follower, before being fed into a LM339 comparator. The signal, which is centered around zero, is compared against ground, in order to produce a square wave representing its 50% duty cycle. The square wave runs from a high of 5V to a low of 0V. The output of the differential amplifier is also fed through a high-pass voltage follower to ensure that it is still centered around zero, and is also fed to an input of the LM339. It is also compared against ground, and a similar square wave is produced. The resulting square waves are input into an XOR IC to produce a final square wave that represents the phase difference between the two. If the signals are perfectly in phase, a signal of zero volts is produced do to the exclusive or condition. When the signals are 90o out of phase, due to a phase shift by a capacitor, the signal is has a 50% duty cycle. By low pas filtering this, we extract the average DC value of the comparison, and this can be linearly correlated to the phase shift, as mentioned.
Though we had already thought of comparing the phase difference using square waves, we would like to attribute some of our success to a previous ECE 476 final project done by Vincent Lee and Jeffrey Wu. When we started our project, we had not previously noticed their project, and the similarity it had to ours. However, as we were working on our phase comparator, we saw they had implemented theirs in a similar way to what we were thinking. Their report helped us pick the appropriate comparators and XOR IC, and also gave us the idea of low pass filtering the output from the XOR to create a linearly correlated voltage that corresponded to phase difference.
Finally, our last piece of circuitry in our design was a pressure sensor used to determine the pressure being applied to our tissue sample inside of our probe. We used a MPXV6115 produced by Freescale Semiconductors, which was a differential pressure system capable of determining suction pressures from -16 psi to 0 (-110 to 0 kPa), which were typical pressures observed in initial testing. The sensor took rails of 5 and 0V, and output .045V/kPa .
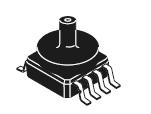
Figure 7: MPXV6115 Pressure Sensor
Some of the main difficulties we had with the hardware was correctly establishing the right rails to use for our comparators and XOR phase IC. We tried a few rail combinations that did not adjust the desired output to the 0-5V range, which was needed for A/D conversion.
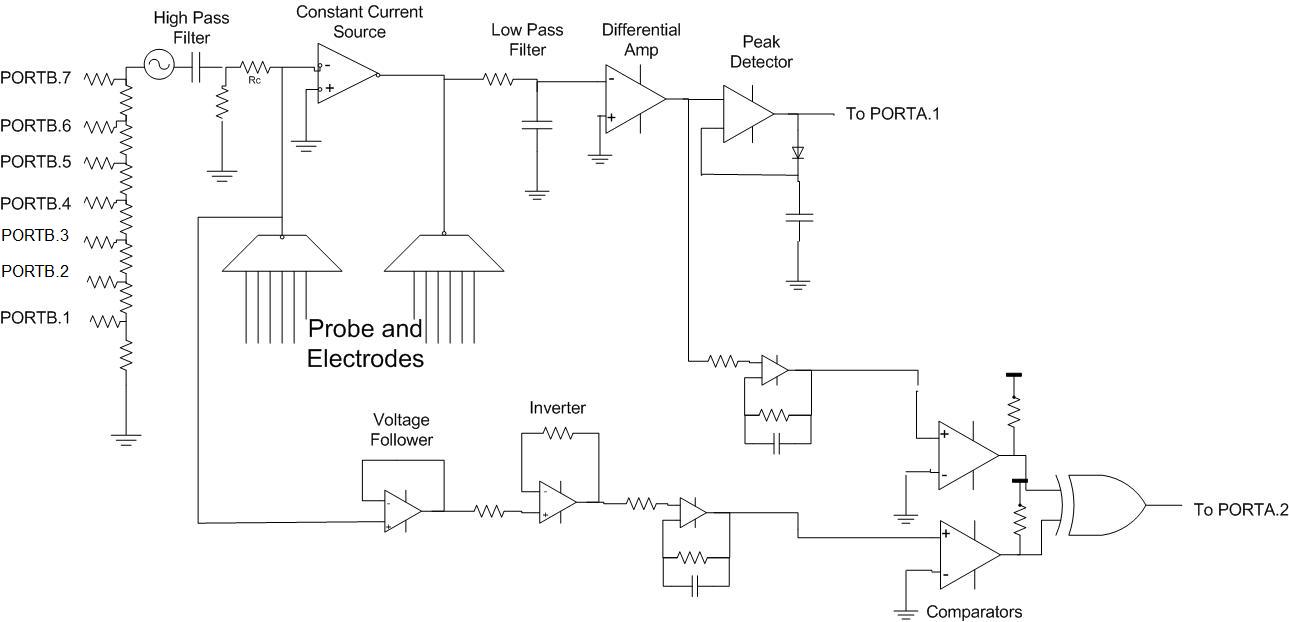
Circuit Schematic:
Mega644 Connection Diagram:
Results
One of the main limitations of our device is the speed of execution. Our fundamental concept relied on reading multiple sources for A/D conversion, and we figured our system would be only as slow as the time it took to switch the ADMUX and for new frequency signals to establish and propagate through the circuit. However, one of the limiting factors of the execution was the time necessary to allow the peak voltage detector capacitor to discharge and readjust to the new voltage. This took a considerable amount of time, and slowed down the speed at which the overall device could operate. We can overcome this by simply applying negative pressure to a sample at a slower rate, however, this significantly increases the amount of time needed to do a test, and reduces the feasibility of the project as an actual medical device or product until further refinements are made. The pressure sensor and phase comparator operate efficiently, and the output to Matlab also happens in a timely fashion.
The accuracy of our system is fairly good at around 5% for resistance and phase measurements, while the pressure sensor is very accurate; all sinewaves produced remained within 1% of the expected frequency, both at the input and across the load and through the diff amp. Though the accuracy of our impedance measurements could be improved, this was a tradeoff for speed. Since this is only a first generation prototype meant for research purposes, we were more concerned with ease of use. 5% accuracy allows us to observe general trends in data, and upon testing and research, we could tailor a circuit to have the most accuracy in operating regions of greatest sensitivity and importance.
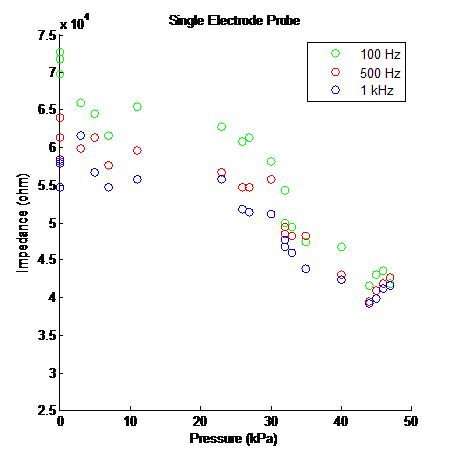
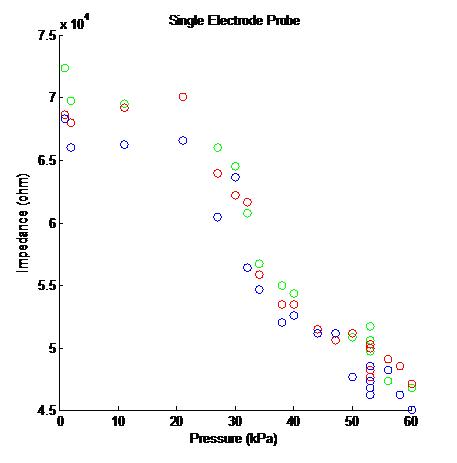
Figure 8: A pair of Impedance vs. Pressure graphs generated by a single electrode probe attached to our MCU
Our device can be easily used by almost anybody, however it is currently tailored to people doing research of biological tissues, since it mainly functions to output data for analysis. If this were to be implemented for clinical use by physicians to use in diagnosis of real patients, both safety and usability issues would need to be considered. A major safety concern would to be to isolate the patient from the any type of 120V power supply, so that no malfunction gets propagated to the tissue between electrodes. Otherwise, the small current and voltage required by the electrodes would not be large enough to significantly hurt the tissue. Also, the system applying pressure would require regulation, so large fluxes or absolute values of pressure were not applied to the patient. Currently, we believe the pressure ranges we are operating at are not destructive to the tissue, besides the mild side effects resulting from an applied pressure. Also, doctors would not be concerned with the exact impedance and pressure data from the device, so to increase usability, efficient software should be implemented that can analyze the recorded data and make a recommendation to the doctor about the tissue’s health, such as outputting a score representing the perceived health of the tissue.
Conclusion
Overall, our design met our basic expectations, however, we were not able to achieve everything that we wanted due to time constraints. We were abe to successfully measure the agar gel with a single electrode probe, but we were unable to interface the MCU with our 6-electrode probe. The research group delivered the 6-electrode to us later in the development cycle than we were expecting. On first testing, the probe did not work with the gels. This could be the result of a manufacturing error related to the small size of the micro-array or exceeding the probe's threshold voltages, despite our best efforts to remain within the constraints. On the other hand, our MCU could accurately calculate impedance values and pressure values, and communicate with Matlab through serial communication in order for data analysis. If we had more time, we would have liked to implement a smart algorithm in the MCU to interpret some of the basic results with the help of Matlab, and to hone in its testing on specific electrodes of interest in order to provide more accurate data. For example, if allowed to test this system and generate some data sets, we could have programmed the microcontroller to pick up on differences from the expected data ranges, and tailor its testing to specific electrodes and frequencies where abnormalities occurred.
No major standard currently applied to our project, however, we began to look into Standard 1073 that details how medical devices in clinical use must have ease of use similar to Plug-and-Play, where a device can be hooked up to a data terminal and easily be connected with the software. Also, it states that the data must be easily transferable and compatible between such layers as the front-end diagnostic system to the hospital’s database and patient records.
Upon starting this project, we were building our circuitry and software from the ground up with little help from external resources, other than from input from Bruce. About halfway through the design, we discovered a similar project to ours had been done in the Spring of 2007, by Vincent Lee and Jeffrey Wu, where they implemented a complex impedance analyzer. At this point we already had the peak voltage detector working, and were in the process of implementing the phase comparator. Though our initial design plans were to utilize comparators to determine phase shift, Vincent and Jeffrey’s project pointed us in the right direction as far as parts to use, and more importantly gave us the idea to implement a low pass filter to convert the duty cycles to a constant DC representation. We developed most of our code ourselves, except for a Matlab communication file supplied to us by Bruce.
We did not reverse engineer any parts of our project, and did not have to sign non-disclosures for sample parts.
Patent opportunities may exist for the a device similar to this in the long run. However, a more powerful and sophisticated device than our current project would need to be developed, and extensive testing on tissue would need to be done in order characterize exact implementation standards and to determine software schemes to be used. As noted before, our device is not as fast as we had hoped, and has a somewhat limited range of impedance measuring capabilities, meaning more professional hardware will have to be used for upcoming testing.
Once again, publishing opportunities are not apparent for our current device. Once the research side of the project progresses, publishing may become an option.
As engineers progress in their studies and begin applying learned skills to actual projects, following the IEEE Code of Ethics becomes very important. During the development of our project, we abided by the Code of Ethics, and our behavior can be highlighted by some of the actions we took. Abiding by Code 2, we avoided conflicts of interest by actively sharing the resources of the lab, whether it was tools, soldering stations, or lab benches. According to Code 7, we actively sought out input and critiques about our project from the TA’s and from Bruce while working on it in lab. We recognize the contributions made to our project by the previous work of former 476 students, and also credit Bruce with supplying us with some sample code to get our MCU communicating with Matlab. Acting by Code 9, we avoided harming others’ property and projects by using care when working around others, and being observant and respectful when others were demonstrating or showing us their work. Also, according to Code 10, we often collaborated with other colleagues by actively discussing different parts of our various projects, whether it was to give advice on hardware, offer input for software implementation, or provide feedback on design choices. And most importantly, this lab allowed us to improve our technical competency by embedding ourselves in a complex project design that consisted of extensive hardware and software implementation, thus complying with Code 6.
Since no wireless signals are generated, the only legal considerations applicable to our project may include medical device malpractice documentation; however, since our specific project is not intended for clinical use, no legal considerations are relevant to our project.
Appendix
Program Code:
Mega644 C Code: final.c
Matlab Code: ReadMCU.m
Datasheets:
References
Past Project:
Complex Impedance Analyzer - Spring 2007
Vendor Websites
Parts and Costs
As part of Grant's research group, our budget was waived.
| Part, Description | Qty | Cost/Part | Total |
|---|---|---|---|
| Total | $47.33 | ||
| Mega644 | 1 | $8 | $8 |
| MAX233 | 1 | Sampled | $0 |
| Custom PCB | 1 | $4 | $4 |
| RS232 Connector | 1 | $1 | $1 |
| Solder Board 6'' | 1 | $2.50 | $5 |
| Solder Board 2'' | 1 | $1 | $1 |
| DIP Socket | 2 | $.50 | $1 |
| LM358 | 4 | Lab Stock | $0 |
| INA121 | 1 | $5 | $5 |
| LM339 | 1 | $.51 | $.51 |
| MPXV6115VC6U-ND | 1 | $11.22 | $11.22 |
| MM74HC4045N-ND | 1 | $.60 | $.60 |
| CD4051BC | 2 | Lab Stock | $0 |
| Resistors | Lab Stock | $0 | |
| Capacitors | Lab Stock | $0 | |
| Diodes | Lab Stocks | $0 | |
| White Board | 1 | $6 | $6 |
| MicroElectrode Array | 1 | Provided by Reseach Department | $0 |
| Tubing | $0 | $0 | |
| Syringe | 1 | $0 | $0 |
| Jumpers | 4 | $1 | $4 |
Tasks
| Task | Completed By |
|---|---|
| Hardware | Grant and Matt |
| Ordering Parts | Grant |
| Soldering | Grant |
| C Software | Matt |
| Matlab Software | Matt |
| Testing | Grant and Matt |
| Report | Grant and Matt |
| Schematics | Matt |
| Website | Matt |