
Introduction
Top
"A composite personal health monitor solution bridges the gaps between patients and doctors."
---Engineering Goodwill
This project creates a portable device implementing wireless technology and taking full advantage of the wide-spreading Internet to provide a convenient solution to monitor human health. The health information acquired on the portable side transmits to the server wirelessly and can be accessed all over the Internet in real-time. The end product turned out to be very portable and the wireless connection is responsive and solid. A significant number of possible further implementations can be developed with minor effort based on this project. Eventually, this project provides a low-price, easy-access human health monitor solution bridging the gaps between patients and doctors.

Project Under Use
The following video shows a short in-lab final demonstration. Another complete walkthrough demonstration video can be found HERE.
High Level Design
TopRationale
"Heart disease and stroke count up to 25% of all death in the world."
"Every 33 seconds, a person dies of heart disease in the U.S."
"90% of the death can be prevented if timely medical actions can be taken."
Human health is an increasingly popular public concern. People spend tons of money on it because once get sick or dead, anything else becomes meaningless. Unfortunately, people always find that it is too late to receive serious medical care when things are already noninvertible. Lots of patients can be cured if early actions can be taken. However, the access to the medical equipment is inconvenient and expensive. Among the most important indexes of the human health, heart rate and body temperature are the most vital ones and they have the advantage of easy access. In addition, unlike the X-ray, the measurement of heart rate and temperature is extremely easy conduct and does no harm to human health itself.
In the current market, there are some personal medical devices which patients can use to do some basic measurement themselves. However, on one hand, since patients generally have little medical background, they have a hard time interpreting the medical measurement into meaningful diagnosis. On the other hand, delivering the raw medical measurement data to the doctors is time-costing and troublesome. Time can never be wasted when emergencies happen, it is critical if information can be shared on large scale coverage within a short of time. Most of the products in the market have these major drawbacks with limitation in flexibility and portability.
"So, why not make a portable device enables people to do the measurements themselves and share it to whoever it may concern automatically?" - Said the following people.
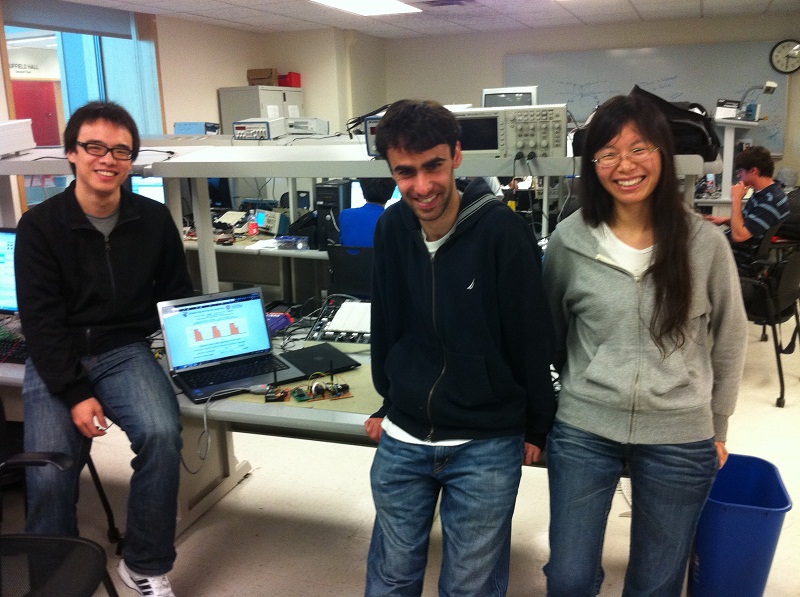
Project Team Members
Functional Structure
Since this is a portable device for the patient to monitor their daily health, it provides the most convenient method to examine human health by measuring the heart rate and the temperature. All those information can be captured and uploaded wirelessly to the server on regular basis. The doctors who can view the data online can send notifications to the portable terminal by lighting LEDs in different colors and combinations in addition of vibrating the device to bring patients' attention in serious situation. The patients can also sent SOS message to emergency contacts by just clicking a pushbutton when encountered emergent circumstances. The SOS message includes an Email and a text message which provides the best attempts to notify the emergency contacts.
Overview Structure
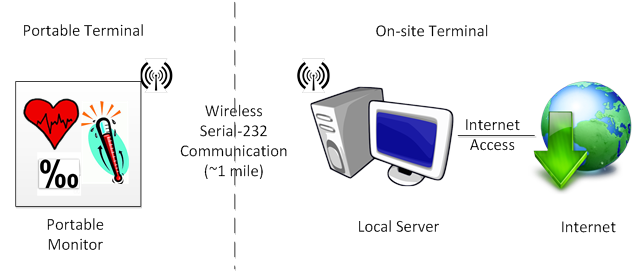
Overview Structure (Portable Terminal)
The picture above shows the the portable termal which stayes with the patients.
Overview Structure(Receiver)
Solution can be implemented on multi-platforms.
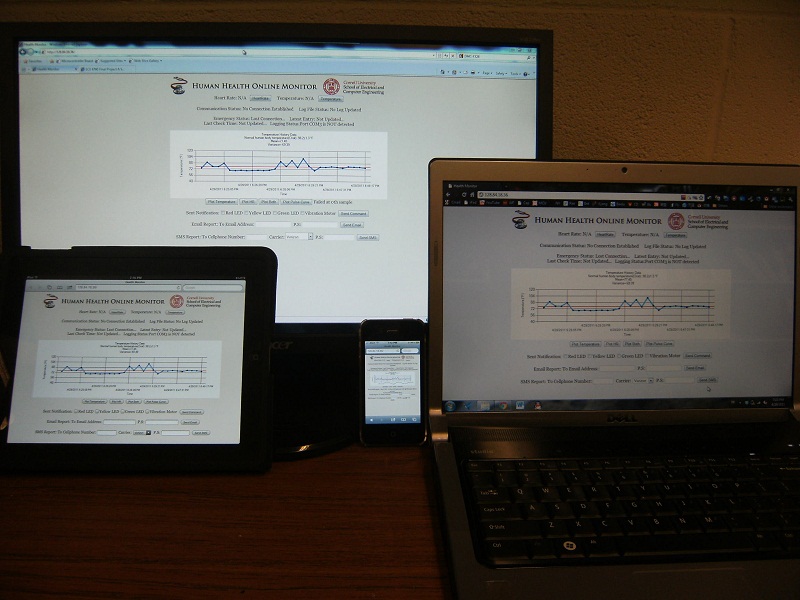
Multi-platform Implementation
Hardware/Software Tradeoffs
Wireless Communication
The project was started with an initial idea of utilizing a Wi-Fi module which can connect to the on-campus Wi-Fi network. In this way, the project can take full advantage of the super-large scale of the campus Wi-Fi network. This looks like a perfect wireless solution which should be utilized for this project. However, the Wi-Fi module turned out to be very expensive which already surpass the budget limit just for itself. Thus, holding a belief of building a portable device which anyone can afford, the decision has to be made to use an alternative method.
The alternative method which eventually implemented in the project is the wireless serial-232 communication. The cost the wireless transceiver is extremely low comparing with the Wi-Fi module with a price of 10 dollar each. However, as the old Chinese saying stated:" 便宜没好货,好货不便宜" pronouced as"pian yi mei hao huo, hao huo bu pian yi" and meaning "Cheap is with bad quality, good is with expensive price." This cheap wireless solution provides an extremely low data rate up to 115.2Kbps. Fortunately, the slow rate is far more enough for the project which involved low intensity of data exchange. In addition, this module provides an easy-to-use USART interface which can take good advantage of the USART interface in the microcontroller.
Communication
The initial idea is to construct a prompt bi-direction communication between the user and the local server. However, as things progressed, it is found that under the current communications structure, the MCU has to either continuously monitor the USART interface or sending data on regular basis and ignore any incoming data. The choice has to be made very carefully because it determines the way to construct the communication in the web server. The follow-up explanation in the server section provides more details on this.
Heart Rate & Breath Rate
One future implementation of the project imagined at the beginning of the project is to detect patient’s breath rate. The measurement signal has extremely subtle fluctuation due to patient’s breath. However, the change can be well-filtered but it does affect the quality of heart rate signal. Further explanation can be found on the hardware section HERE.
Standards
UART
The UART interface is implemented twice both on the receiver side and the transmitter side. It has a full name of universal synchronous receiver/transmitter. UARTs are commonly used in conjunction with communication standards such as EIA RS-232, RS-422 or RS-485. The universal designation indicates that the data format and transmission speeds are configurable and that the actual electric signaling levels and methods (such as differential signaling etc.) typically are handled by a special driver circuit external to the UART (Universal asynchronous receiver/transmitter).
Software
TopHeart Rate Deteection Algorithmn
Cardiovascular Physiology Concept
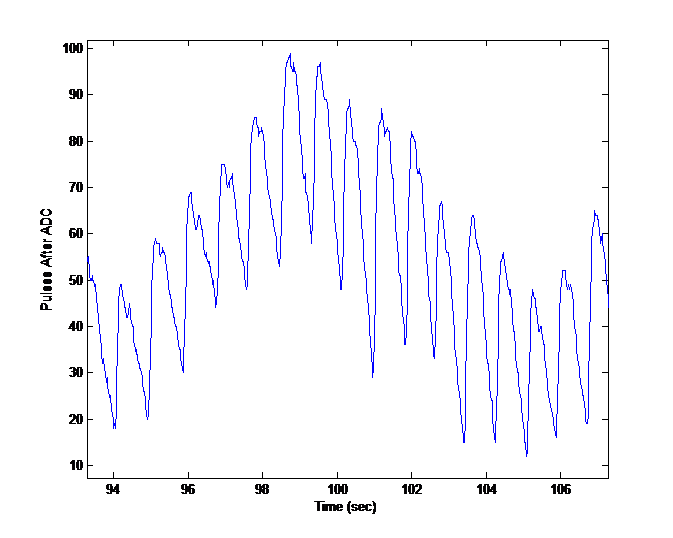
In order to get better understanding of the algorithm, it is necessary to get familiar with some essential cardiovascular physiology concepts first. The algorithm is specifically developed to detect the heart rate out of arterial and aortic pressure change signal. People should be not strange to this signal because it is the same one which people use every day to measure their pulse pressure by measuring the amplitude. The only difference for this time is that we use it to detect the heart rate information by measuring the period for the signal. The signal is shown as following.
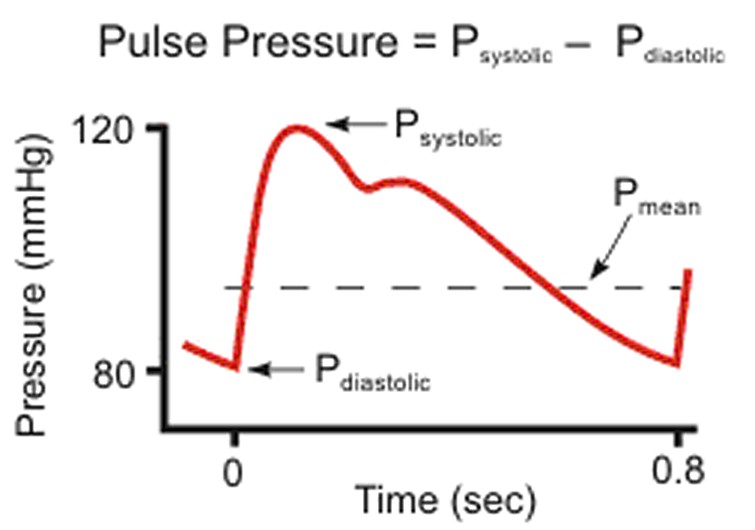
Pulse Pressure Signal
The signal is cause by the cardiac cycle (See picture below). The following paragraph is excepted from www.cvphysiology.com which focuses on various cardiac diseases.
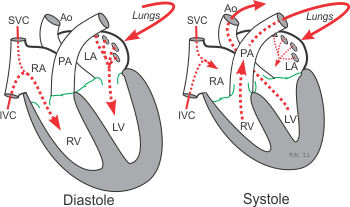
Cardic Cycle
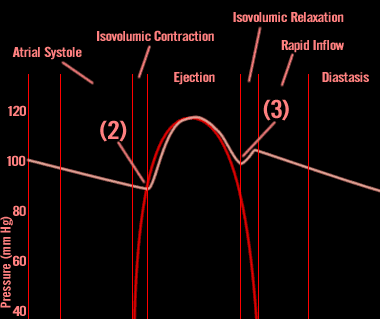
"As the left ventricle ejects blood into the aorta, the aortic pressure increases. The greater the stroke volume, the greater the change in aortic pressure during ejection. The maximal change in aortic pressure during systole (from the time the aortic valve opens until the peak aortic pressure is attained represents the aortic pulse pressure, which is defined as the systolic pressure minus the diastolic pressure. As the aorta expands, the increase in pressure is determined by the compliance of the aorta at that particular range of volumes. The more compliant the aorta, the smaller the pressure change during ventricular ejection (the Second small pulse (3)) shown in the following."
Pulse Pressure Signal
First Version
To detect heart rate, the simplest thought would be using the output of the detection circuit as the input of a comparator and use a trimpot to set up the reference voltage of the comparator. The drawback of this approach is that the reference voltage has to be adjusted for each user because the signal from each user is different. Even for the same user, the signal could also have big variations. To make the detection smarter, the signal is sampled using an ADC and processed in the microcontroller.
Basic measurement method
As the first attempt, the signal is sampled at 50Hz. In order to judge whether this is a valid pulse, a threshold is needed and this threshold needs to be automatically adjusted according to the signal. Here, the algorithm of last year's project "Heart Rate Display LED T-Shirt" is referred to. The average value of the previous 250 data points are used as the threshold. Two states are used: state low which means that the current state is below the threshold and state high which means that the current state is above the threshold. After a new ADC point is ready, the first thing to do is to check whether it is in the low state or high state. If the current state is high and the current data is smaller than the threshold, then it is a falling edge. A LED is turned off and the state changes to low. If the current state is low and the current data point is bigger than the threshold, then it is a rising edge. The LED will be turned on and the state changes to high. The time is recorded at this point. The time recorded for two consecutive valid pulses are to calculate the heart rate.
System status control
The pulse period for a healthy adult is 0.6 seconds to 1 second. If the tested period is not in this range, then it is regarded as noise. Otherwise, this is regarded as true signal. To measure the correct heart rate, the signal needs to be in a stable state. The criterion for stable state is defined as: if there are three consecutive pulses whose periods are within the predefined range, then the system enters stable state. Once the period of a pulse is not within the valid period range, then the system exits the stable state. In the stable state, the average of three consecutive periods, N (in points), is used to calculate the new heart rate. The range of period for valid pulses is then updated as N-10 to N+10 in points. In order to tell the user that the signal is stable and valid, another LED is lit up when the system enters stable state.
Drawbacks
RawHeart Pressure WaveSignal
This method works well if the signal does not have DC level fluctuation and there is no noise. But the signal is not that ideal due to various kinds of noise sources, like the shaking of user's hands, ambient light and so on. Also, the user's breath could cause dc level shift of the signal. The signal given by the detection circuit is shown in the above figure. The DC shift of the signal will make the threshold prediction invalid. The noise on the rising and falling edge will also make the pulse detection method inappropriate, as shown in the figure below.
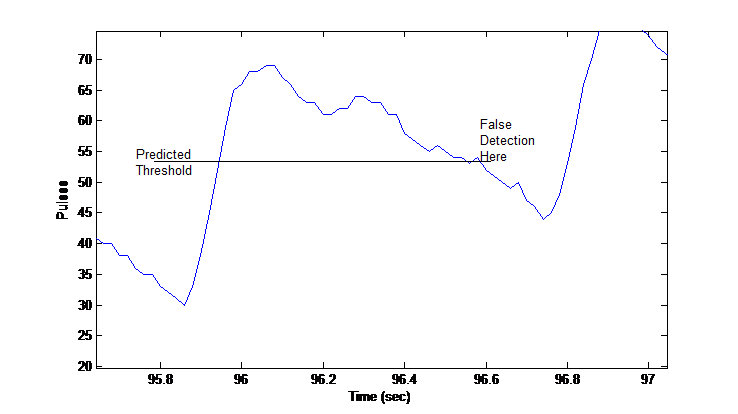
Detection Failure Example
Second Version
Improvement 1: Moving sum to further reduce noise
To further reduce the noise, a moving average which is also a low pass filter should be a good way. In order to avoid divide operation which is very slow, a moving sum is done instead. The moving window is selected to be 7 points. This operation could induce a little delay to the signal but this doesn't influence the final measurement. The signal after the moving sum is shown in the following figure. The filtering is successful and a lot of the noise peaks are removed.
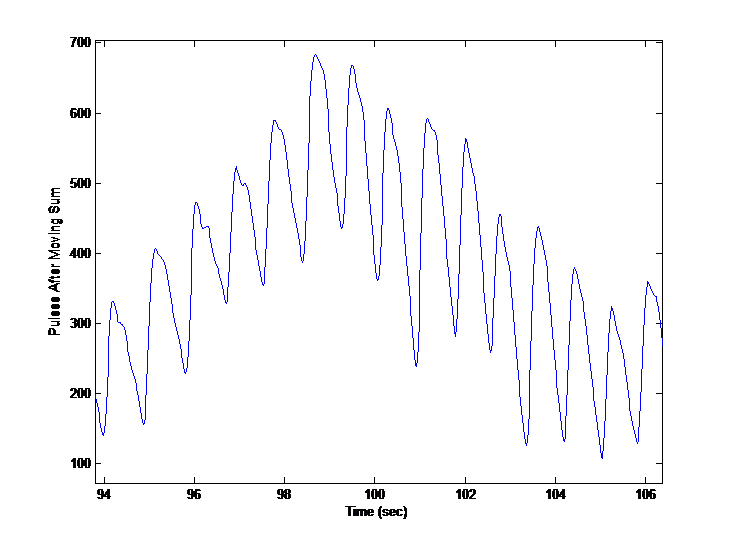
Noise Cancelled Signal
Improvement 2: Make the measurement immune to DC shift
To make the measurement immune to DC level shift (very low frequency noise or breath influence), local maximum and local minimum are used to measure the period of the pulse. Two criteria are used to identify true pressure wave pulses.
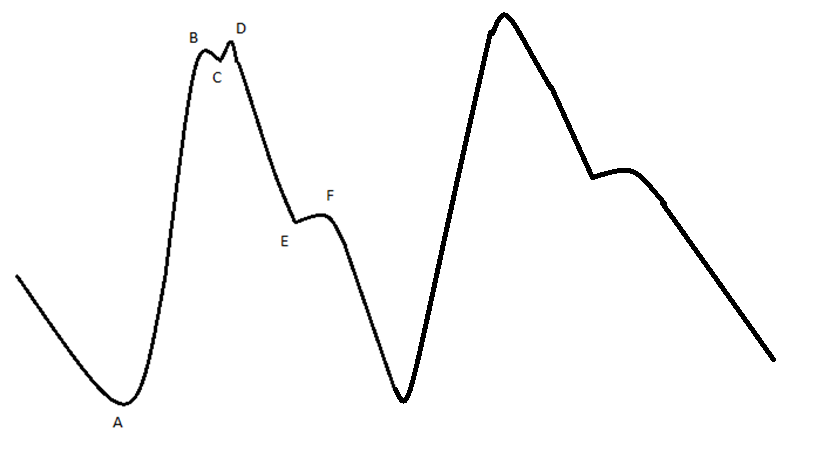
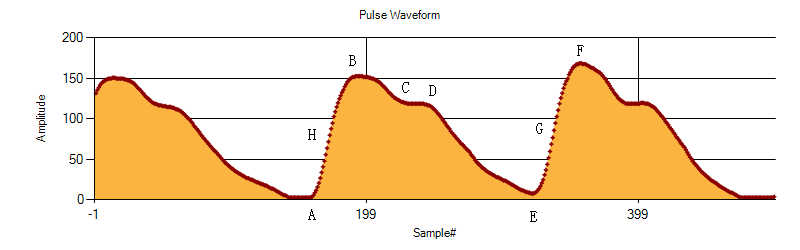
Criterion 1-- valid pulse in amplitude: After the moving sum, the noise peaks on the rising and falling edges are removed. According to the experiment result, there might be some noise peaks at the local maximum of a pulse. The noise peaks should be ignored for correct detection. The most important thing is that the second signal peak in a pulse period (point F in following figure) should not be identified as a separate pulse. The solution is: every local maximum point and minimum point is detected. Once a local maximum is detected, it is compared with the most recent local minimum in the past. In the following figure, point B is compared with point A, point D is compared with point C, and point F is compared with point E. If the amplitude difference between the local maximum and minimum is bigger than the threshold TH1, then this is identified as a valid pulse in amplitude. By choosing proper TH1, C-D and E-F will be identified as noise and ignored.
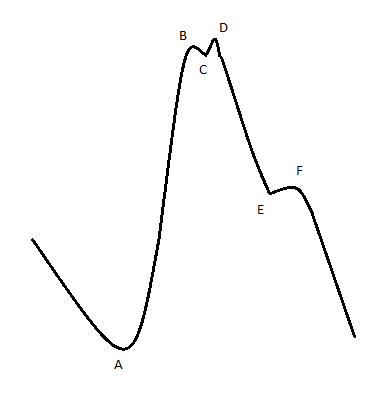
Criterion for valid pulse in amplitude
Criteria 2 -- stable pulse in time: After a pulse is identified as valid, then the time of its local maximum is recorded. The difference between this time and the time recorded for last valid pulse is calculated as the period of this pulse. If the calculated period is within the predefined range, T1-T2, then this pulse is identified as a true pressure wave pulse. If five pressure wave pulses are detected in a row, then the system enters stable state. A status LED will light up to indict the user that the device is working properly. Once a pulse with an abnormal period is detected, the system will exit stable state and the status LED is turned off.
Improvement 3: Dynamically adjusted TH1 and T1, T2
After the system enters stable state, TH1 is updated to one third of the average amplitude of previous five pressure wave pulses and T1 and T2 are updated to the average period of previous five pressure wave pulses -10 points and +10 points, respectively. Once the period of a valid pulse in amplitude is not within T1 to T2, then all of the thresholds, T1, T2 and TH1 are reset to original values and the system exits stable state.
Advantages and drawbacks
This approach successfully solved the problem of DC level shift caused by low-frequency noise because the amplitude difference between adjacent local minimum and local maximum is independent of the DC level. But another problem arises: when there is a flat top or bottom, the method could not identify local maximum and minimum correctly, thus giving wrong results. Flat top is very common because for some users, the signal is so strong that the output gets saturated. To solve this problem, when a local maximum or minimum is detected, the following 5 points are ignored. But this is not a good method because the width of the flat region is different depending on the signal and this also results in inaccuracy of detection because the first point of the flat region is regarded as the local minimum or maximum point. Since the location of local maximum point is used to calculate pulse period, this is not a very accurate algorithm.
Final Version
Improvement 1: Higher sampling frequency to improve accuracy
First, the sampling frequency is changed from 50Hz to 200Hz. This further improves detection accuracy and makes the pressure wave signal smoother when this curve is plotted on the connected webpage. The moving sum is kept and the window is changed to 18 points because the sampling frequency is higher.
Improvement 2: Combination of version 1 and version 2
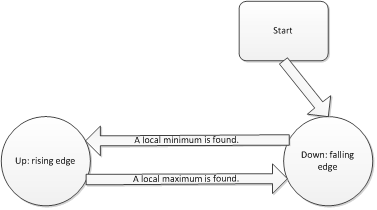
To solve the problem of flat top or bottom and further improve detection accuracy, the first two versions are combined together to form the final solution. The basic idea is that on the rising edge, once a data point minus the previous local minimum is bigger than the threshold TH1, the pulse can be identified as a valid pulse in amplitude. Therefore, the point on this rising edge can be used to calculate the period and this is more accurate because the rising edge is sharp. The dynamic adjustment of TH1 is still controlled by valid local maximum and minimum. To combine these two methods together, two states are introduced: state up which means the rising edge and state down which means the falling edge.The state machine is shown below:
State Diagram
In the down state, if the value of the previous local maximum minus the current ADC value is bigger than a predefined threshold, TH1, and this is the first time that this condition is satisfied since last local maximum is detected, a LED is turned off. If a local minimum is found, the value of this local minimum is recorded and then the state machine enters up state.
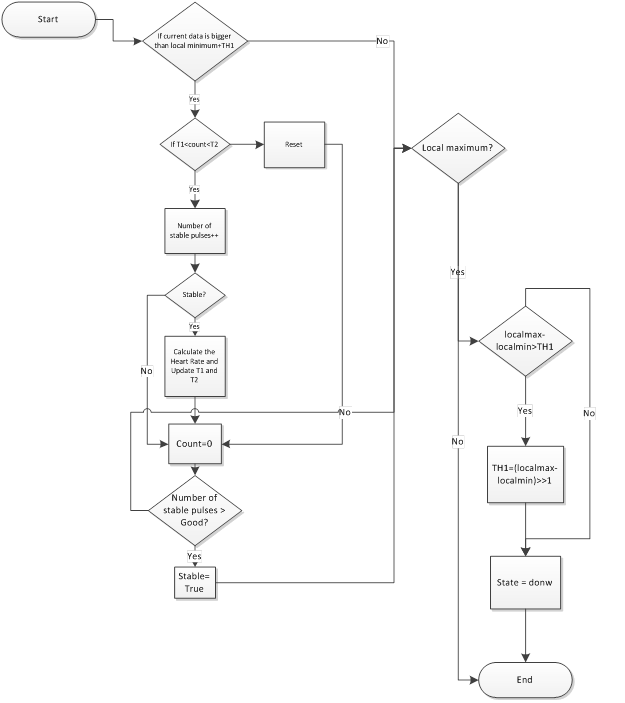
The up state is more complicated and the process is shown in the following figure. First, if the value of the current ADC value minus the value of the previous local minimum is bigger than the predefined threshold, TH1, and this is the first time that this condition is satisfied since last local minimum is detected, then the LED is turned on and the time since last similar situation is calculated as the period of the pulse. If the period is within a predefined range, T1-T2, this pulse is considered as a true pressure wave pulse. Otherwise it is considered as bad signal and system is in an unstable state. If three (definition of Good) consecutive pressure wave pulses are detected, then the system enters stable state and a status LED is lit up to inform the user that the system is working well. In the stable state, the average period of most recent 20 pulses is used to calculate the heart rate (if number of stable pulses is less than 20, then only these stable pulses are used to calculate). The average period of these 20 pulses is also used to update T1 and T2: T1 is updated as N-30 in points and T2 is updated as N+30 in points. N is the average period in points. In this way, the standard for true pressure wave pulses is automatically adjusted. Once the system exits stable state, everything is reset so that the system can quickly switch to new conditions. In the up state, only local maximum is searched for. Once a local maximum is detected, the state machine will go to down state and the value of this local maximum is record. If the difference between this local maximum and the previous local minimum is bigger than TH1, then this is considered as a valid pulse in amplitude and TH1 is updated to half of this amplitude.
Flow Diagram of Heart Rate Detection int he UP State
Improvement 3: Fast adjustment of TH1
In this algorithm, once a valid pulse in amplitude in detected, TH1 is immediately updated to one half of this amplitude. There is a tradeoff here: this method can make quick adjustment and adapt to new environment very fast. This also prevents false measurement, as shown in the following figure: even if the second maximum, like F, is identified as a valid pulse in amplitude at the beginning, the next valid pulse is still identified and the threshold quickly rises to one half of this true valid pulse. Then the second maximum of the second pulse is blocked. The drawback of this method is that TH1 is easily influenced by large-amplitude noises. The good thing observed during experiment is that large-amplitude noise is rare after the system enters stable state, before the user takes the device off. Therefore, this method is doable.
Detection Analysis
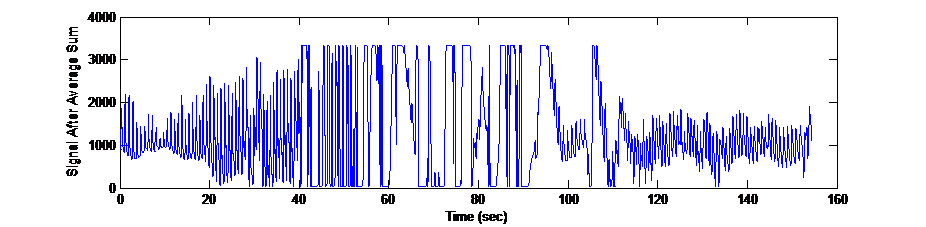
To make the device workable for every user, the initial value of TH1 is very small to accommodate users who have very small signals. Then TH1 is updated to half of the amplitude once a valid pulse in amplitude is detected. If no valid pulse is detected in the next 1.5 seconds after a valid pulse in amplitude is detected, then TH1 is decreased by delta TH1 every 5 ms until a valid pulse is found or TH1 has reached the initial value which is very small. In this way, the system is applicable to every user and could quickly respond to changes. For the signal shown and the change of TH1 are shown in the following two figures. These two figures prove that TH1 changes very fast and appropriately.
Signal After Moving Sum
Again, in the stable state, the average period of 20 stable pulses are used to calculate the final output.
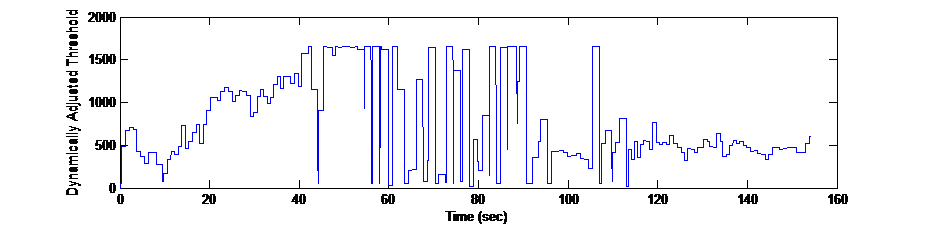
Dynamically Adjusted Threshold
Actual Signal Example Analysis
In this section, the detailed data processing is analyzed using the waveforms measured from the experiment. The moving sum will be ignored here because it doesn't influence the nature of this algorithm.
Actual Pulse Example 1
The above figure shows three typical pulses. Using the algorithm described above, the local minimum at point A and the local maximum at B point will be detected. Because the amplitude difference between A and B is big enough, this pulse will be identified as a valid pulse in amplitude. The threshold for identifying valid pulses, TH1, will be immediately updated to half of the amplitude difference between A and B. Therefore, TH1 is approximately 75 after B is detected. Then C and D will be identified as the local minimum and maximum, but the amplitude difference between C and D is smaller than TH1, so they will be ignored. Next, E is identified as the local minimum and the state machine is in the state of rising edge. At point G, the amplitude difference between G and E is bigger than TH1, and then the time at point G is recorded. This time is then used to calculate the period of the pulse: T=TG-TH, where point H is similarly identified as point G.
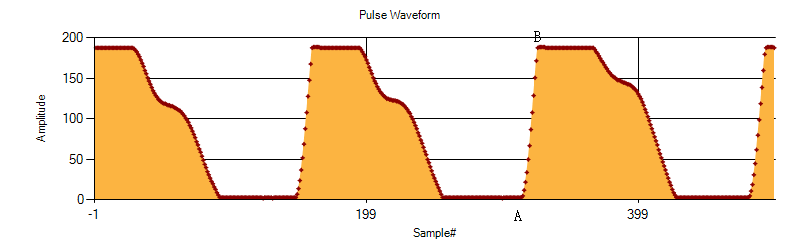
Saturated Pulse Signal
Sometimes, the signal is so big that it gets saturated, as shown in the above figure. In the flat region, the algorithm will detect local minimum and local maximum alternatively and amplitude difference between the local maximum and local minimum is 0. Therefore, these local maximums and local minimums will be automatically ignored. Take the third pulse in the above figure as an example, only point A and point B will be identified as the valid local minimum and local maximum.
Saturated Pulse Signal
Another extreme case is that the amplitude of the effective signal is very small, as shown in the above figure. In this scenario, because the initial value of TH1 is even smaller, these pulses can still be identified as valid and stable pulses. Due to the adjustment mechanism of TH1, TH1 will automatically be small for small-amplitude signal and quickly arises to large value for large signals. When changes back to small signals, TH1 will also quickly drop to small value.
Conclusion
From the above analysis, it can be seen that this algorithm very robust. It successfully deals with noise problem and the amplitude issue of different signals. The final version of algorithm works well even in noisy environment. The detection accuracy is high and the details are in the result session.
Real-Time Operating System
System Overview
On the system level, two sensing tasks, heart rate sensing and temperature sensing, needs to be done. Another task is needed for communication between the MCU and webserver. The temperature sensing task just needs ADC conversion so this can be done in interrupt handlers. The other two tasks need separate functions to perform. The behavior of the system should be predictable and the time when the measurements are performed needs to be recorded. In this scenario, a real time system is used to schedule the tasks.
Real-Time OS Configuration
A customized real-time OS UART library trtUart.c is used in the program with an creation of two semaphores, SEM_RX_ISR_SIGNAL and SEM_STRING_DONE. The variable of heart rate is a shared variable between and the task of communication (task 1) and the task of heart rate measurement (task 2). The semaphore HEART_OUTPUT is created to protect this variable. Also, the task of measuring heart rate is only allowed to run after a new data point is ready. Therefore, another semaphore, DATA_READY is created to control the execution of task2. Semaphore HEART_OUTPUT is initialized as unblocked and all the others are initialized as unblocked.
Tasks Description
Task 1 communicates with the webserver and it is desirable to guarantee that the information is received or transmitted. Therefore, task 1 is assigned higher priority over task 2. The priority is assigned by giving task 1 an earlier deadline than task 2 when the two tasks are created and their deadlines are kept fixed.
In the communication between the MCU and the webserver, all the communications are initiated by the webserver. Therefore, task 1 keeps receiving instruction from the server and it is blocked until a "\r\n" is received. Once task 1 receives a "\r\n", it will perform different things according to the instructions received. The details about these instructions and reactions can be found in chart 1.
Task 2 is the heart rate detection algorithm and it is executed after a data point of the heart pressure wave is ready and it must be done before the next data point of the heart pressure wave is ready. So at the end of the task 2, the process waits for the next data point to be ready. And when the next data point is ready in the ISR, the ISR will signal task 2 to go. Task 2 is also in charge of saving data for the most recent 5 stable pulses. Two buffers are used to do this task. Once one buffer successfully records the data for 5 successive stable pulses, this buffer becomes the ready buffer and the other buffer will be in charge of recording data for the next 5 stable pulses. This guarantees that 5 successive stable pulses are recorded and the recorded data are up to date.
The data sampling of the heart wave needs to be accurate. Data points must be sampled at 5ms intervals to ensure correct calculation. Since interrupts have highest priority in a real time system, the sampling of data is controlled by the ISR. Timer 0 is used for the interrupt and the ISR is called every 1ms. In the 5ms interval, 2 milliseconds are assigned to the ADC conversion of the heart wave and the rest 3 milliseconds are assigned to the ADC conversion of the temperature. So at the end of the first two milliseconds, the ADC result is taken as a data point for the heart wave and the ISR signals task 2 to run. Then the ADC channel is switched and the conversion of temperature starts. At the end of the last 3 milliseconds, the ADC result is taken as a data point for the temperature. Then ADC channel is switched back and another conversion of the heart wave starts. In this way, both heart rate sensing and temperature sensing go well and the data points for the heart wave are sampled at 5ms intervals accurately.
Two external interrupts are set up to communicate with the server. One interrupt is triggered by button 1 push and the corresponding ISR resets the LEDs and vibration motor which might be set by the notification message from the server. Another interrupt is triggered by button 2 push and the correspond ISR set the emergency flag. As the server checks the emergency flag every 15 seconds, emergency emails and text messages will be sent out 15 seconds later after the user presses the emergency button in the worst case.
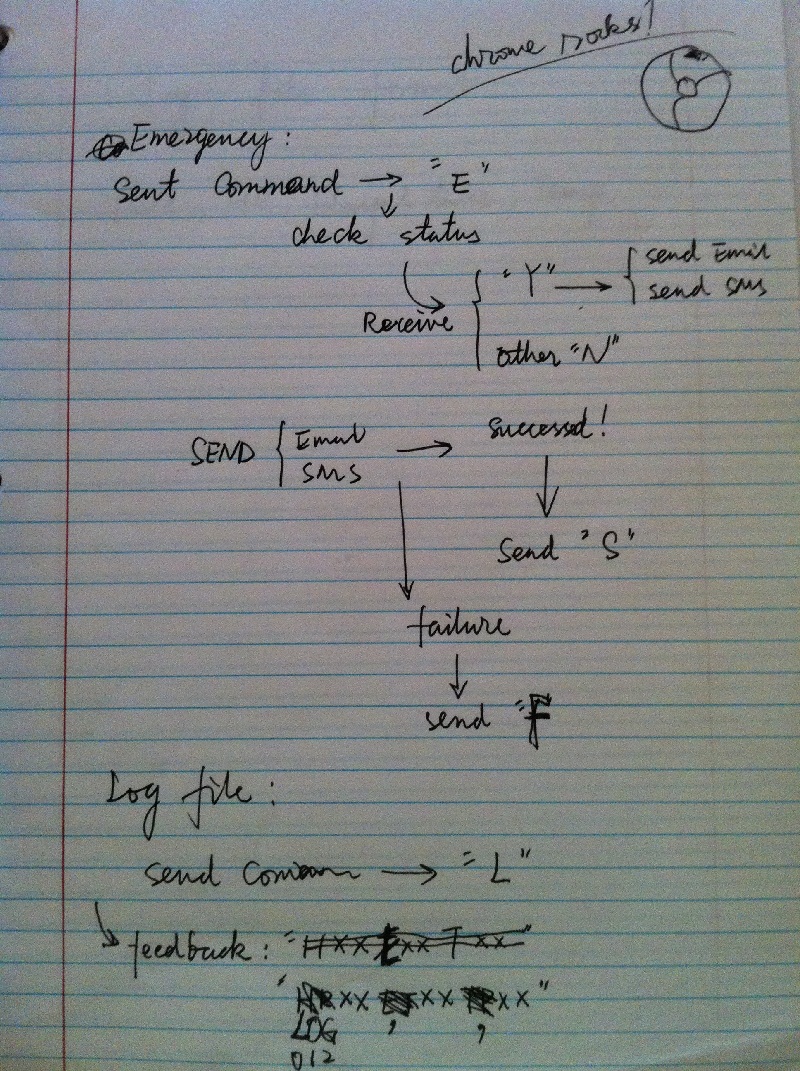
Communication Command Set
All the communications are originated from the web server side. As stated in the section above, the MCU respond according to the receiving command. A specific formatted string is sent out from the MCU to the server and being parsed on the web server.
| Event | Request Command Sent from Server | Reply sent by the MCU | Explaination |
|---|---|---|---|
| Emegency Checking | "E\r\n" | "Re0\r\n" or "Re1\r\n" | 0-Normal,1-Emergency |
| Autologging | "L\r\n" | "En%d,%ld,%d\r\n",Heartrate,Elapsed time,Temperature | Data is complied in one entry |
| Temperature Checking | "T\r\n" | "wen%d\r\n",Temperature | Raw ADC sample data |
| Heart Rate Checking | "H\r\n" | "xin%d\t%ld\r\n",Heartrate | Direct readinging unit of bpm |
| Pulse Curving | "P\r\n" | "sample1\r\n,sample2\r\n,…,sample500\r\n,END\r\n" | 500 samples are sent out |
Data Logger Software
As stated in the previous section, a data logger program was created to attempt to log the data periodically. However, due to the limitation that COM port can be accessed by one at one time, this approach was abandoned. Nevertherless, the software is created and the following explains how it has been created and the design theory behind it.
Program Overview
The date-logger is shown in the figure below. The data-logger has several fields. Both the temperature and the heart rate have to be saved in different files. In the text box where it says heart Rate File Name, one has to enter the appropriate location of the heart rate file. The same is true of the temperature file name. The Com port field allows one to choose from 9 COM ports. And the baud rate field allows one to choose from the following baud rates: 9600, 2400, 4800, 9600, 19200, 38400. For our projects purposes, we decided to stick with 9600. Once one has selected the baud rates, the com port and the file locations and names, one has to click communicate in order to activate the communication.
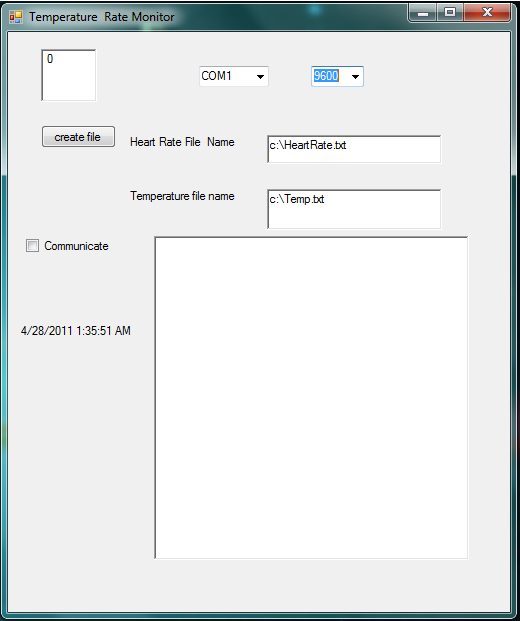
Date Logger Program
Code Description
A quick description about how windows operating system works is necessary in order to explain how the code was written. Windows operating system is very much based on the idea of an interrupt event driven operating system. It has these things called event handlers. For example when you click, the communicate check box, windows will call the following event handler in your visual basic code
Private Sub cbCommunicate_CheckedChanged(ByVal sender As System.Object, ByVal e As System.EventArgs) Handles cbCommunicate.CheckedChanged
So when the status of the check box changes ( which happens whenever the user clicks on the checkbox), the event handler will get called. Once this event handler gets called, the code will check to see if the box is checked or not. If the box is checked, it will disable the com port bbox, the baud rate box and the file name boxes, since we felt it unfeasable for the user to change the com port to which the receiver is connected to, or the baud rate while he or she was taking measurements. The code also enables the timer if the box is cchecked. However, if the box is unchecked,all of this is undone.
Once the timer is enabled, the event
Private Sub Timer1_Tick1(ByVal sender As Object, ByVal e As System.EventArgs) Handles Timer1.Tick
Dim heartRate As String
is called once every 15 milliseconds. Basically what happens in this events is that the Serial Port is opened. Next by using the write( String message) function in the serial port object that comes as one of the VB.NET libraries, we send the MCU a request for the heart rate using the string "H\r\n" or a request for the temperature using the string "T\r\n". When such a request is sent out, the program then waits until the a byte is received in the serial port buffer. Whenever this happens, another event called
Private Sub serialPort_DataReceived(ByVal sender As Object, ByVal e As System.IO.Ports.SerialDataReceivedEventArgs) Handles serialPort.DataReceived
is called. Whenver this gets called, we use the ReadExisting() function in the serial Port library, to store both the current heart rate and the current temperature in two global variables. Since we are expecting the heart rate and the temperature to be received from the datalogger, this event Handler also ends up closing the serial port after the temperature is received in order to allow the WebServer to access the com port whenever it needs to. In order to differentiate between the tempterature and the heart rate, the event handler has a static variable that keeps track of the number of times the event is called. Every even number of times the event is called, the software assumes that the heart rate is received from the MCU. Every odd number of times this evnet gets called, the data that is received will be the termperatrue. The reason why we can make this assumption is because the data logger is always sending out both rquests for the heart rate and the termperature one right after the other, and when the MCU sends the data, this event gets called once for the termperatrue and once for the heart rate. Next, this event handler will store the termparute and the heart rate in their corresponding files. But before it can do this, it will of course have to open it. Please note that since two programs cannot access the same file at once, the program will wait until the files are accessable in order to access them. Once the data has been written to the appropiate files, the data logger will then close the files so as to give access to the web-server.
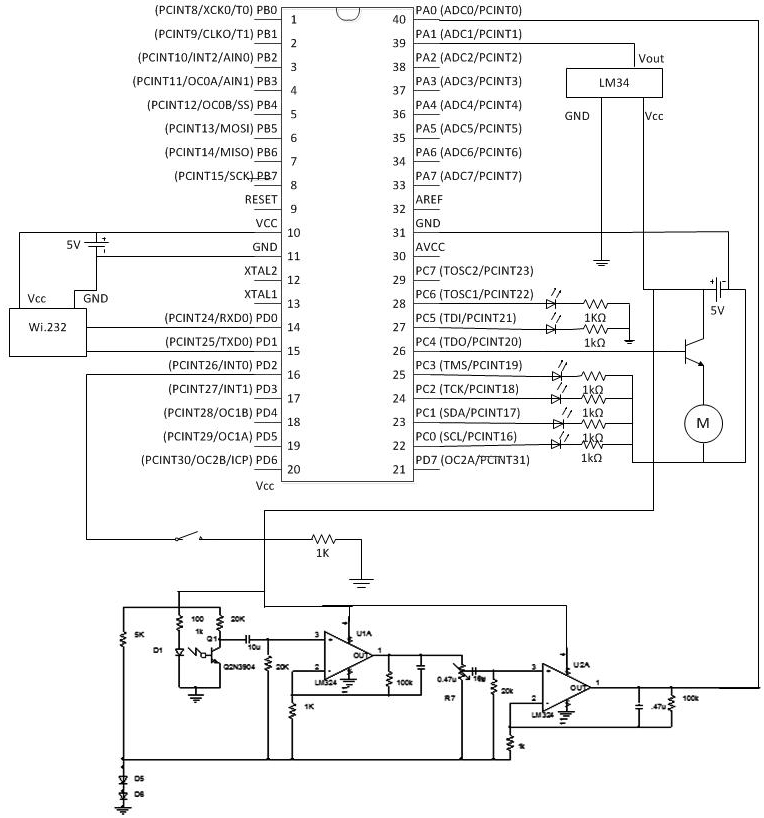
Hardware
TopOverview | Measurement Module | Measurement Circuit | Processing Component | Receiving End | Wireless Communication | Additional Information
Overview
The hardware of the project can be primarily divided into two major terminals as stated in the previous sections. One is the portable terminal and the other one is the server terminal. As far as the hardware goes, the portable terminal can be further divided into the measurement circuit and the processing component. The server terminal's hardware is very simple with only the wireless receiver. The following sections give a better understanding of the hardware for the project.
Measurement Module
In order to use the infared LED and the phototransistor, we had to have perfect isolation between the LED and the Phototransistor in order to keep the phototransistor from being saturated. Realizing that our colleges in the department of mechanical engineering had access to a laser cutter, we decided to make use of opaque dark plastic in order to achieve this perfect isolation. Unfortunately the laser cutter was limited to being only able to cut plastics up to 6 cm, forcing us to cut out two different plates for the IR module and glue the plates together. The bottom plate only has four holes, two were needed for the anode and the cathode of the LED and two were needed for the emitter and the collector of the phototransistor. The other plate only consists of two bigger holes which has just enough space to allow the epoxy lens of the LED and the phototransistor. Of course, the two holes in the first plate are perfectly aligned with the four holes in the second plate in order to allow the LED and the phototransistor to fit into their appropriate locations when the plates are stacked on top of each other. In order to make use of the laser printer, we were required to draw them out on solid works. My friend then took our solidworks model, and feed the data to another program that was specifically designed for the laser cutter. As mentioned before the material that was used was opaque, hard plastic.

Module Down Layer

Module Up Layer
Measurement Circuit
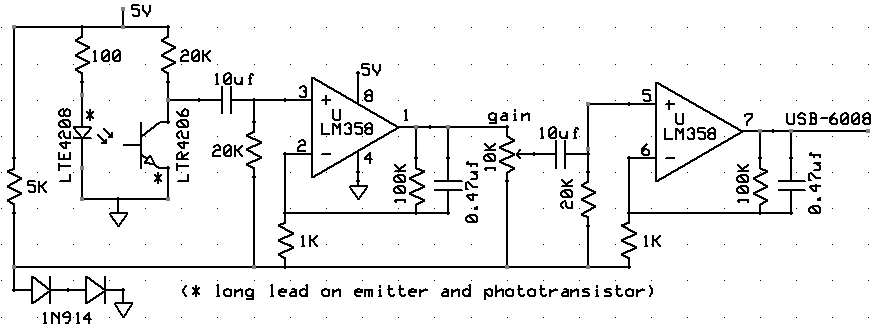
Measurement Circuit Schematics
This circuit is initially provided by Professor Bruce Land and it originally comes from the ECE 5030 Electronic Bioinstrumentation class. It has been modified a little to fit the design.
Measurement Circuit
The schematic of the heart rate detection circuit is shown above. The IR diode emits infrared light which is then reflected off the finger. Due to blood flow, the density of the reflected IR light will have small changes which can be detected by the IR phototransistor. The output signal of the phototransistor is very small and noisy, so it is sent to a two-stage circuit to be processed. Each stage has a high pass filter which consists of one 10uf capacitor and one 20k resistor, an amplifier with DC gain of 101 and a low pass filter which consists of a 1k resistor, a 100k resistor and a 0.47uf capacitor. The high pass filters and low pass filters are used to filter out undesired noises. The trimpot connecting the two stages can be used to adjust the total gain of this circuit.
For the high pass filter, the cut off frequency is
f=1/2πRC≈0.8Hz
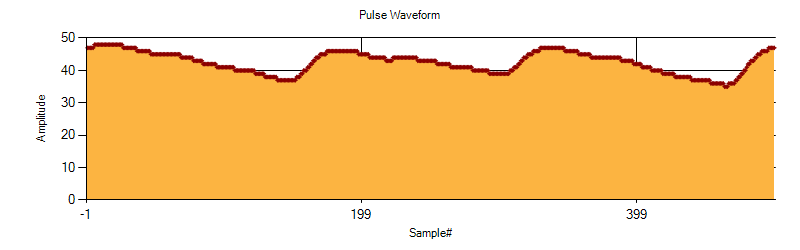
For a healthy adult, the breath rate is 12–20 breaths per minute. The current high pass filter will filter out the breath signal. Therefore, in order to extract breath rate from the signal, the cut off frequency of the high pass filter should be below 0.2Hz. If the 20k resistor in the high pass filter is changed to 100k, then the cut off frequency is approximately 0.16Hz. The breath rate can be seen after the 20k resistors are replaced by 100k resistors in the high pass filters, as shown in the following figure. But the tradeoff here is that the circuit is more sensitive to low-frequency noise and it is observed that it takes a much longer time to get stable heart rate signal. After comparing the benefits and drawbacks, 20k resistors are adopted in the final circuit because the quality of heart rate detection is more important in this design.
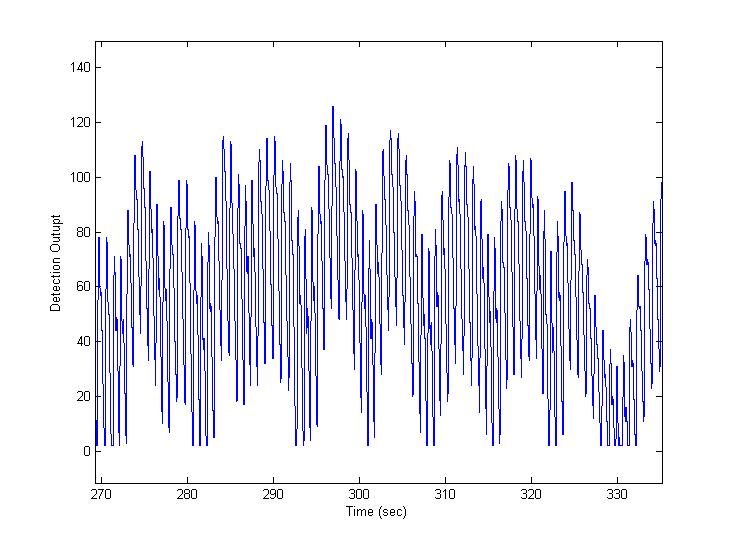
Signal Showing Breath Info.
MicroController Target Board
The microcontroller target board hold the brain of the project - Atmel Mega644. The circuit board is specifically designed for this class. The original design has a USB port which interfaces with MCU via UART and recognized as COM port by PC. Since the all the data communication is done wirelessly, it is left empty to save cost and effort.
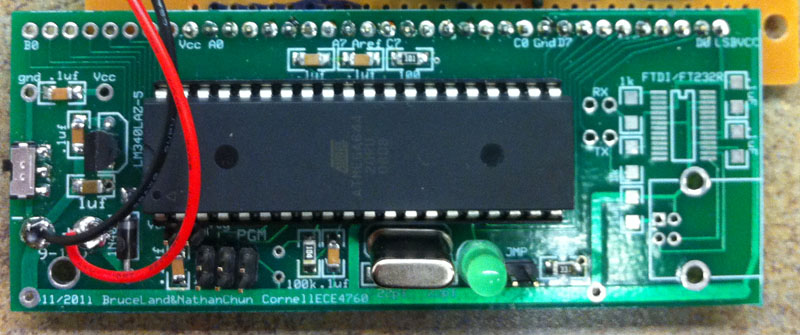
Microcontroller Target Board
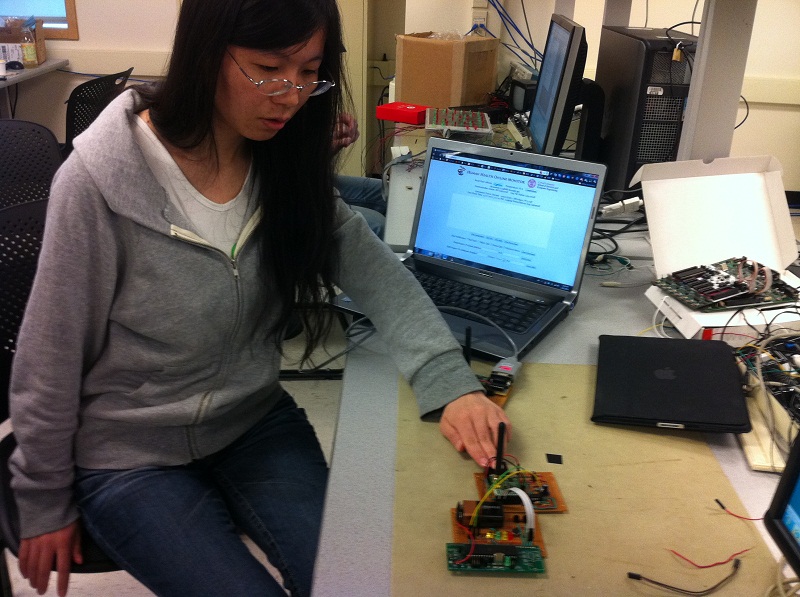
Processing Component
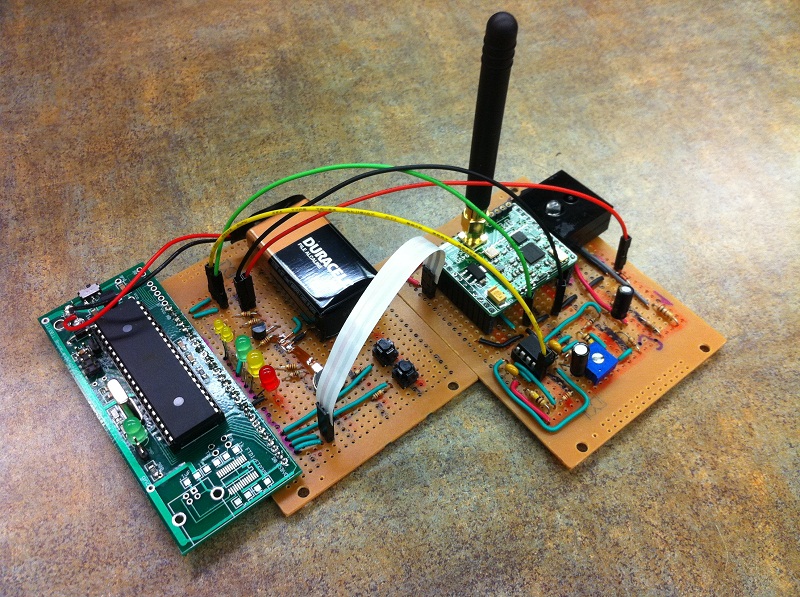
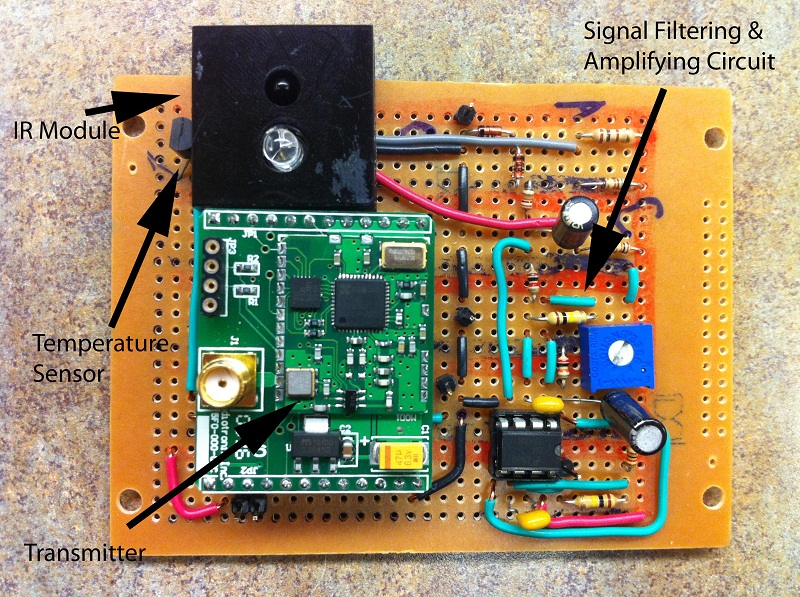
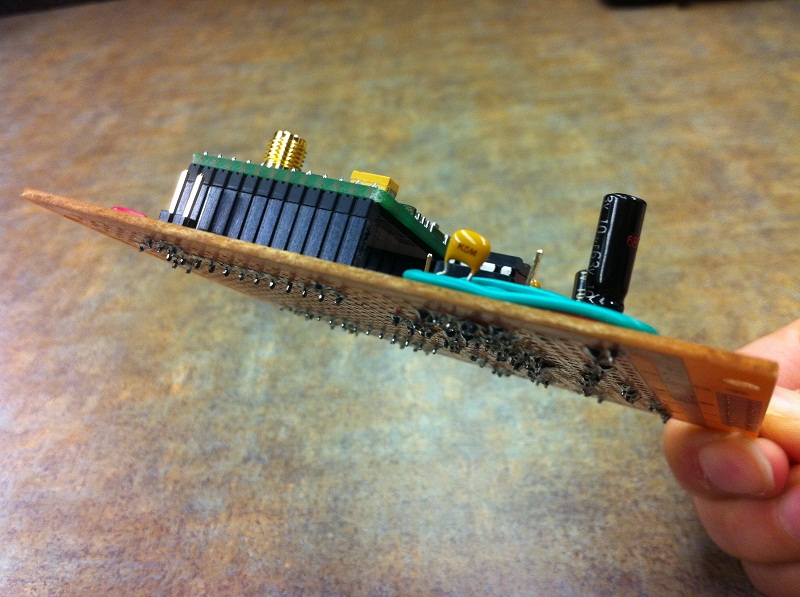
After the signal has been measured, filtered and amplified, the signal needs to be processed to interpret the heart rate. The output signal from the measurement circuit feeds into the channel 0 of the ADC on the MCU. The processing component is essentially to be the target board with MCU on it. An additional wireless transmitter is communicating with the MCU via UART interface.The following two pictures show how the portable side is constructed and how wireless module is connected to the target MCU board.
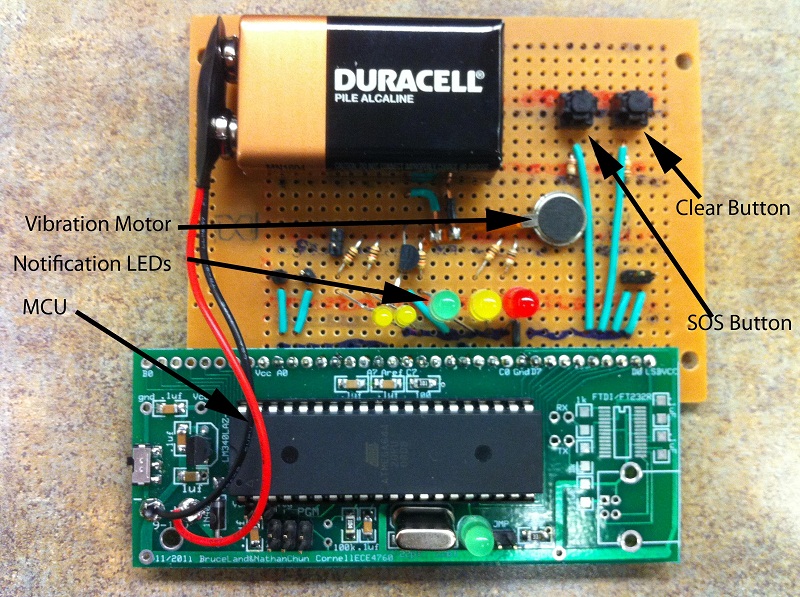
Processing Component
As shown in the picture above, all the circuit is compacted onto two solder boards. The Temperature sensor and the IR module is located closely for patient's convenience to take measurements.
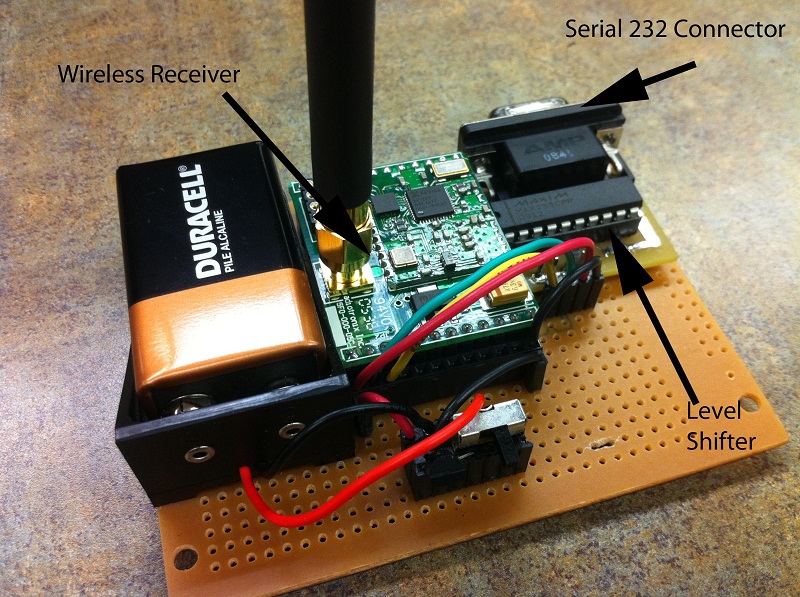
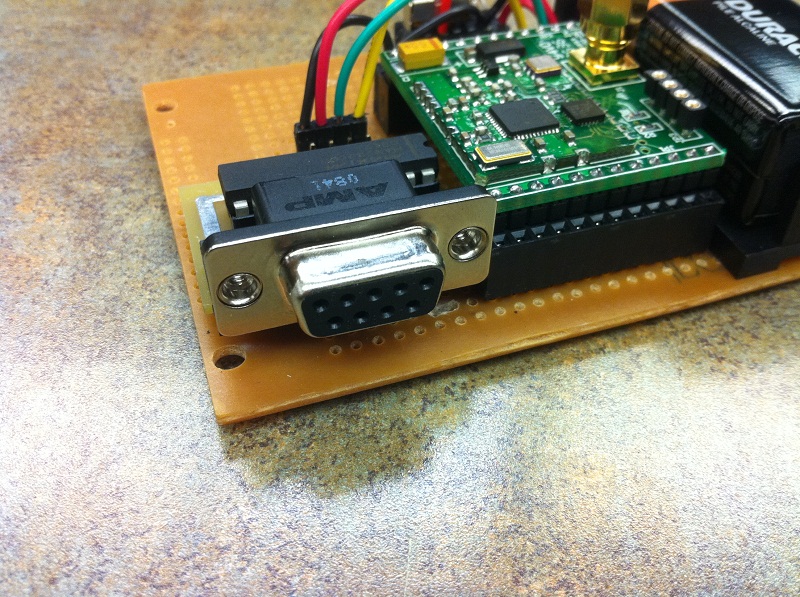
Receiving End
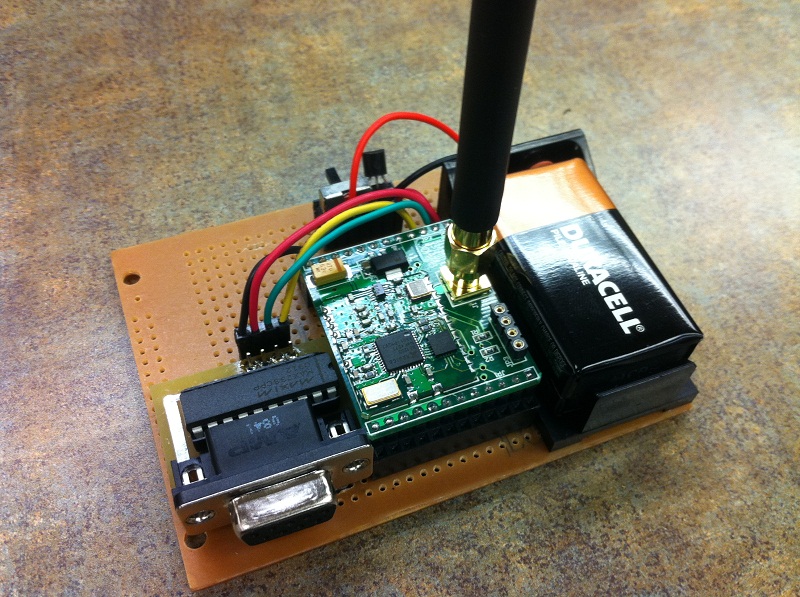
The receiving end is obviously connected to the web server to provide data connectivity to the portable terminal. The wireless module is connected to the RS 232 connecter through a Max 233 level shifter. The connection eventually goes to the web server and recognized as a COM port. The following picture shows the hardware.
Receiving End
Wireless Communication
The Wi.232 serial wireless module provides a wonderful tool for a cheap wireless communication solution. The wireless signal is running at 900MHz. The data rate it provides is far more enough and the interface is extremely easy. Only four pins need to be connected to make it run. Each module is a transceiver which can send and receive data wirelessly. The extended board shown in the following picture under the small board provides convenience to the designer without worry about converting the power source. It also provides a firmware program port which allows the designer to update the latest version of the firmware. The antenna looks cool and extends the communication range to about 1 mile.
To use this wireless module, some initial configurations need to be done to provide better performance and avoid interferences. The most critical settings are changing the wireless signal channel and the UART data baud rate. During the early stage of the development, some random signals were received. It turned to be some other group was using the same wireless module and sending data on the default channel which ours is on. To avoid further interference, the wireless signal channel must be changed. Since this device is running on DTS mode and it has 31 channels, it eventually stays on Channel 21. In addition, since the baud rate is fast enough for the project, we did not bother to change it.
It is very easy to change the radio channel. The first step is to pull the CMD line low and send the following data packed to the wireless module.
"0xFF 0x02 0x4B 0x15" changes the transmission channel to channel 21
"0xFF 0x02 0x4C 0x15" changes the receiving channel to channel 21
A sample code can be found here in the appendix section which has been used to change the configuration.
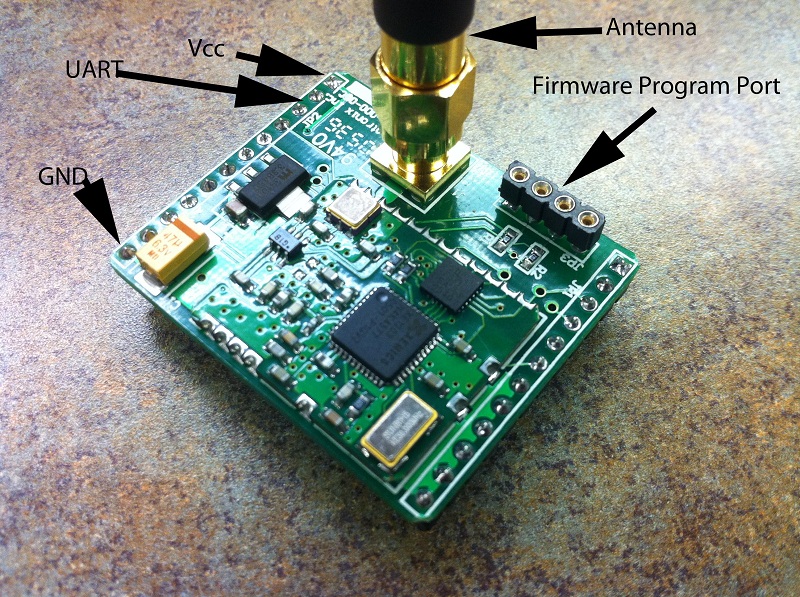
Wireless Communication Module
Additional Information
Power Source
To make it portable, one critical requirement is to have the independent power source. A 9 volt battery is used to play the role of providing energy for each terminal. A regulator is utilized to convert the 9 volt voltage to 5 volt for MCU and wireless module's use.
Soldering Work
"Man, this is decent!"
--Xun, said after soldering
Since it is an end-use product, it has to be very delicate and compact. Thus, when soldering, we paid out best efforts to avoid nasty "flying-wire" connection. The outcome turned out to be very satisfying. The following picture shows the decent soldering has been done.
Detail of the Soldering Work
Compact Circuit Layout
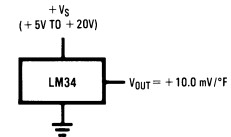
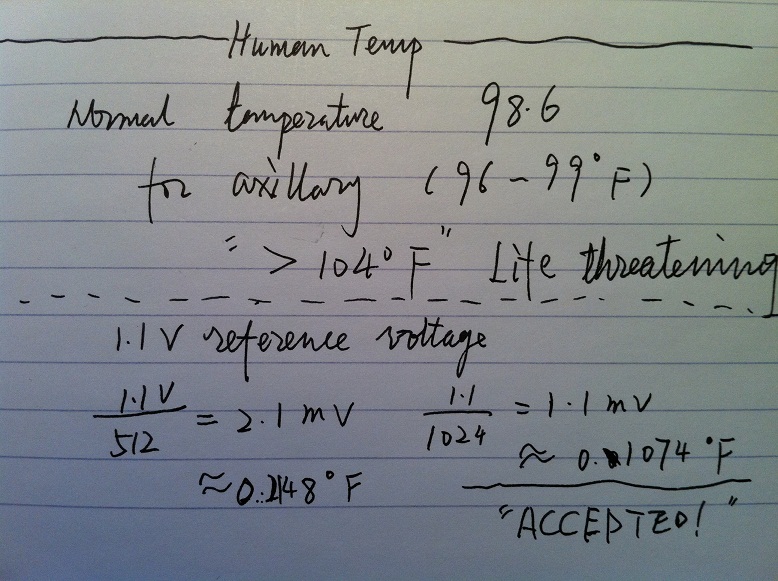
Temperature Measurement
The project uses LM34 temperature sensor to detect the temperature. The reason to choose it is because it provides a nice accurary and the output voltage is formatted along with the Fahrenheit degree change. The output voltage from the sensor is feeded into Channel 1 of the ADC on the MCU. Raw data is rendered to the web server and manipulated there before displaying. The reference voltage is chosen to be the internal one of 1.1V.
The output voltage of the temperaure sensor is:
Vout = 10.0mv/F. Shown in the picture.
Temperature Sensor Output
Web Server
TopOverview
An IIS server along with the ASP.NET framework is created to serve as a data processing and logging center. The server can communicate with MCU with a range of 1 mile. The website is written in C#.net. The server is eventually connected to the whole Internet and enable all users on the Internet have access to the website. In this way, the web server brings the online network and the off-line portable device together which ultimately makes the portable device viewable and controllable by the online world, dramatically extend the coverage.
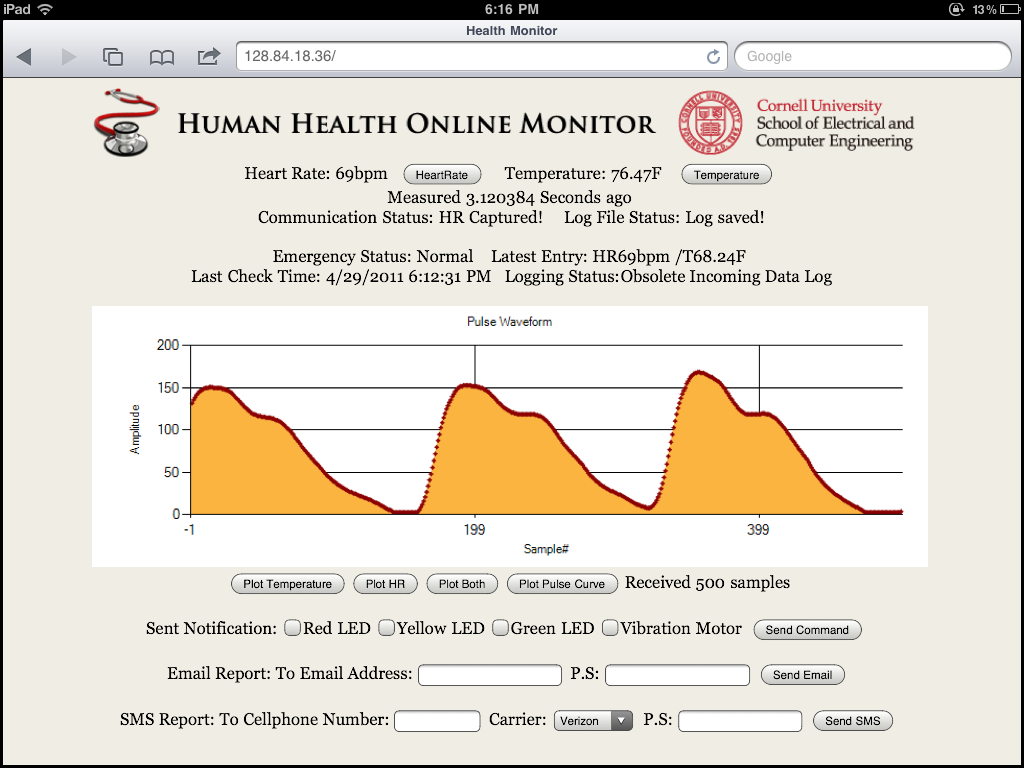
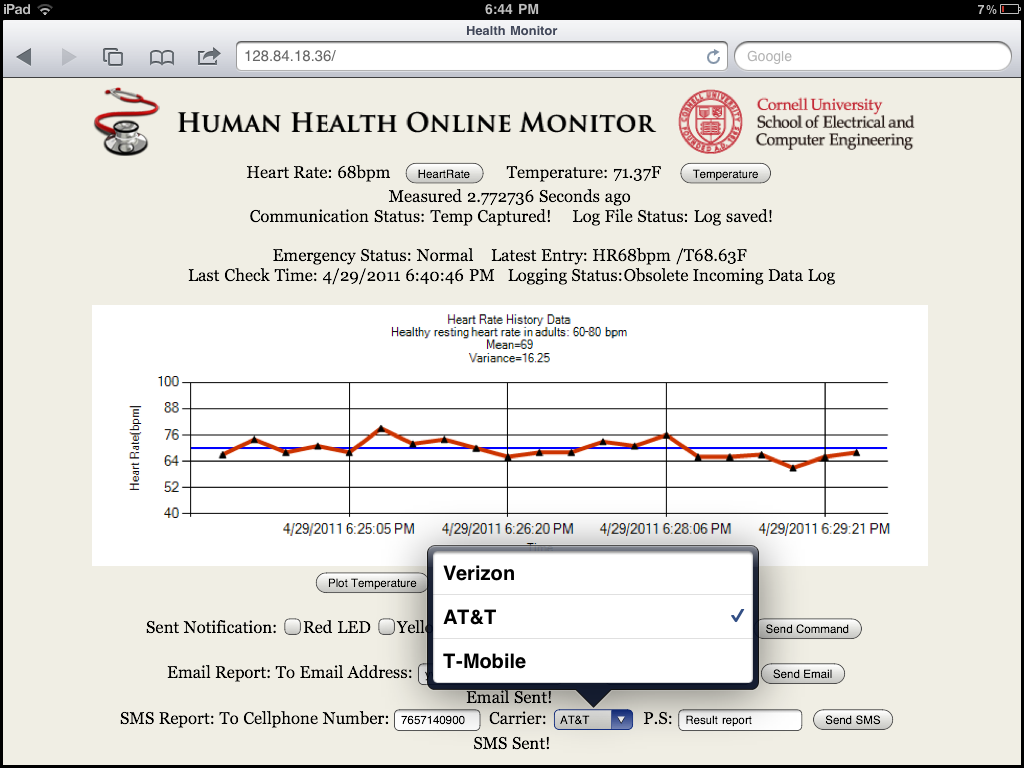
Due to the lack of background knowledge of building a website, tons of efforts were put in to learn and construct a web server and deploy a website. It receives data from the MCU on regular basis and logs any valid data in the log file located on the web server's local disk. The following sections elaborate what the web server do in the project. Sections are divided according to the major functions the server performs. The following picture gives a clear view of the website when the web page is initially loaded.
Website Main Page
Feature Set
Real-time reporting
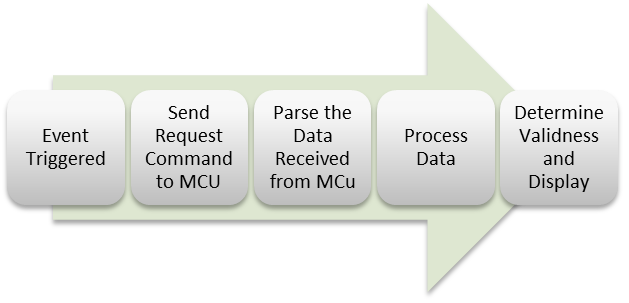
On the top section of the webpage, there are two buttons which can update the heart rate and temperature reading with the latest data coming from the portable terminal respectively. When the web user clicks the button, the server sends a request command to the MCU wirelessly and the MCU replies with specific content according to the request. In this way, the data is reported in real-time. The data stream received from the MCU is parsed on the server end and displays in the unit of beats per minute (bpm) for the heart rate and fahrenheit (F) for the temperature. One thing which is worthy to pay attention to is the data type. An initial design comes up with an idea of transmitting the actual heart rate and the temperature. However, further consideration implies that if using the raw ADC data for the temperature can save some computing resource for the MCU to process the heart rate measurement data. In addition, timing information is also added to enable the user to understand when the measurement is taken. The timing information is encoded in ticks by the TRT operating system on the MCU and it is processed by the server to obtain the actual reading in seconds. The heart rate reading is directly obtained from the MCU because the algorithm outputs the actual reading of the heart beats.
RealTime Reporting Processes
Regular Logging
The section underneath the real-time reporting area displays the status and entry of the regular logging. One significant feature of the project is provides a tool to log the patient's information on regular basis without any manual operation, even without patient's notice (of course, under patient's permission). The goal is provide a friendly user experience of not bothering to know meaningless raw data going through on the background. A timer is set up with an interval of 15 seconds on the server which triggers to send command to the MCU to request the latest data. Along with timing information stored in the memory, the server is able to know whether the new coming log entry is updated or obsolete which finally determine if it is necessary to store in the log file. As shown in this display area, the emergency status, last entry, last checking time and the logging status are displayed respectively. The processes involved when acquiring regular log are shown as below.
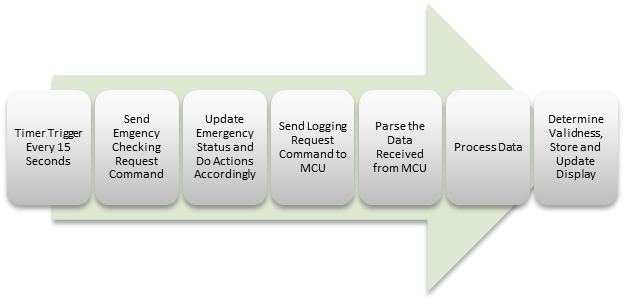
Regular Logging Processes
Historical Reporting
In the middle part of the page, a huge chart viewer dominates the space. There are four buttons under the chart give the ability to view different historical sources. The chart enable the web users to view heart rate historical data, temperature historical data, historical data for both and the last valid pulses waveform along with some basic data analysis.
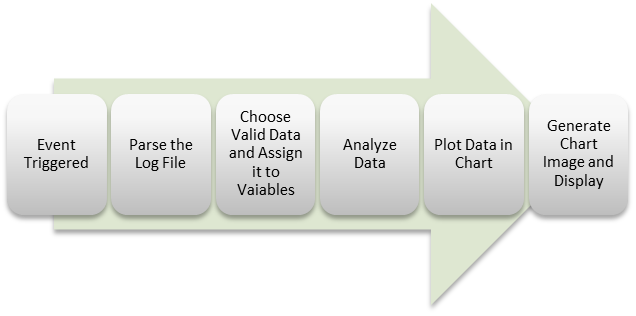
Historical Reporting Processes
Notification sub-system
In the middle part of the page, a huge chart viewer dominates the space. There are four buttons under the chart give the ability to view different historical sources. The chart enable the web users to view heart rate historical data, temperature historical data, historical data for both and the last valid pulses waveform along with some basic data analysis.
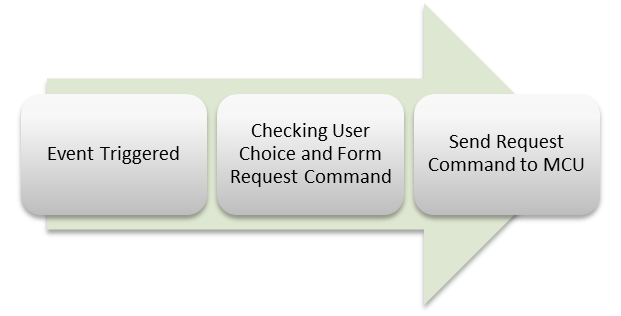
Notification Processes
Report Generating and Sharing
The very bottom of the web page provide a very neat feature which enables the web users to share the health report with whoever concerns. There are two ways to share the automatic-generated report, either by email or text message to cellphones in the U.S. The web server establishes and configures a SMTP client on the background which enables the user to send emails. To send text messages to U.S. cellphones, the SMTP sends an email to the email-to-message gate server according to the specific carrier. This is not known by many people because the carriers never want the users to know (Send SMS for free? Just that easy!) . One additional feather embed in this function is specifically created for the users. If users entered invalid characters in the address text box, the server asks the user to reenter instead of crashing itself. The processes are shown in the following figure.
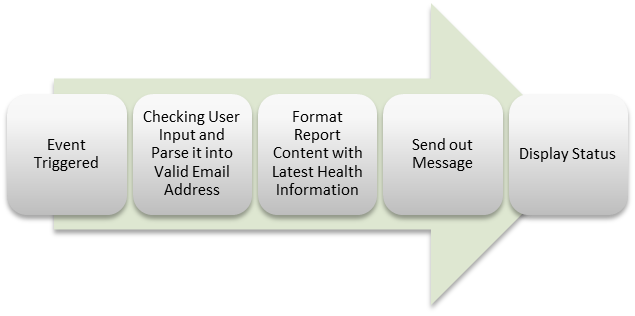
Reporting Generating & Sharing Processes
Partial Update Webpage
One annoying problem in the early stage of developing the website is that the whole web page updates when any action is taken. The idea of creating a partial updating environment comes from the requirement of maintaining any history on the screen when doing some new actions. For instance, the historical data chart does not reload and refresh even if the web user clicks to update the real-time data. Fortunately, the Microsoft provides a nice tool control called "Partial Updating Panel" which enables the user to update only part of the web page. To implement this sweet feature, the functions introduced above are all separate in different update panels and only update when certain event is triggered.
Advanced Charting
One crucial requirement for a personal health monitor is to present data in a vivid and meaning manner because pure data gives no valuable information to the users including both the patients and the doctors. Having a sophisticated chart presenting valuable data is absolutely essential in the health monitor. Microsoft ASP.NET gives a wonderful charting control which can manipulate data with existing APIs. Every time when the plot chart event is triggered, the data in the log file is converted in numeric type and computation is conducted. By using the function, the website provides advanced charting showing the mean value and the variance of all the historic data.
Pulse Curve
This special feature is the most valuable one in the whole project. The original idea of creating this is from the observation of the oscilloscope. During the period of building the project, the oscilloscope is the most frequency tool used for debugging. The signal from heart rate external amplifying circuit is observed to make sure if valid signal is acquired. Then, the idea of plotting the curve on the web page is generated to create a "Wireless Oscilloscope". This special feature provides a powerful tool not only let the doctor know the heart rate, but also the actual curve of the pulse. The pulse curve contains a huge amount of health information which only the doctors who have the medical background can decode.
Problem and Tradeoffs
Difficult Choices
To log the data coming from the MCU, two possible ways are offered. One is to use the web server sending out request on regular basis and store the coming data entry. The other one is to write an offline data logger program running on the background triggering logging event on regular basis as well. However, these two method cannot be implemented at the same time because the server only have one COM port and system only allow one entity to use the COM port at one time, otherwise, the access is denied. The collision can happen is the web user is updating the real-time data when regular logging takes place. This problem can be easily fixed by using a desktop which have multiple COM ports. However, due to the limitation of Code of Campus Computing in Cornell, no desktop on campus can be utilized as a web server which resulting using personal laptop as the web server and the difficult choices described above has to be made. The following describe the pros and cons for both of the solutions.
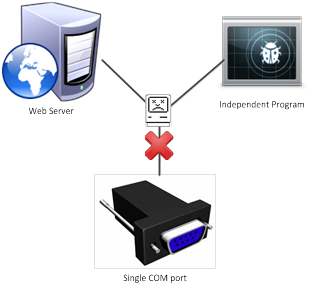
Communication Tradeoff Problem
If using the web server to do the data logging, the most significant advantage is the ease of access to the COM port. Since everything is configured on the server end, the web server has full control of the COM port and knows when is the appropriate time to do the right thing to the COM port. However, the disadvantage of this method is that the website has to be loaded on any client to enable the auto logging. Otherwise, the background control will never execute.
If using an independent program running on the background, the problem stated in the first method will be easily solved because the program never stops execution since it always hide on the background. Once the computer is on, the program sends out logging request on regular basis. However, this method brings up a new problem which it might collide with the server is multiple requests of using the COM port are triggered at the same time. If that happens, the communication would fail.
Final Solution
After careful and thorough consideration and discussion among group members, the decision was finally made to use the first method. The most critical factor of choosing it is to provide smooth and friendly user experience. The second method gives a more stable logging history for sure, but the first one is more practical to enable auto logging when users load the website. Guaranteeing solid communication is the highest priority when considering the tradeoffs.
Result
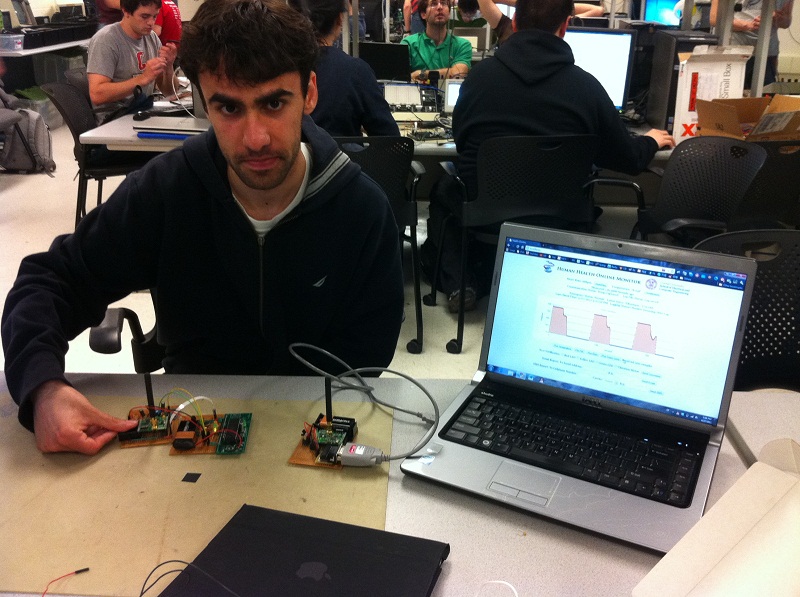
TopSpeed & Performance | Accuracy | Notificaiton System |Accumulated Measurements Test | Accumulated Measurements Test | Health Report | SOS Message | Wireless Communication Test | History Data | Safety Enforcement | Interference
Speed & Performance
Website Running Screen Capture
The picture above shows the website screen captured when the project is running.
The project turned out to be very successful on measuring human heart rate. The detection of the human pulse signal is very sensitive and the valid measurements can be obtained in a fast manner. A yellow flashing LED indicates the pulse peaks which enables the user to adjust the finger position accordingly to find the best measuring position. If position is well-adjusted, the valid measurement can be acquired within 3 seconds. The time is determined by the implementation of the heart rate algorithm. This also involves the tradeoff between the accuracy and the responsiveness. To ensure the accuracy, the program is configured to start outputting valid measurement reading after 3 consecutive valid pulses. However, if extreme speed is required, the setting can be easily changed to 1 valid pulse which gives a fast response of outputting valid measurement reading within 1 second. However, to ensure high accuracy, we decide to go with the 3 consecutive valid pulses. The status is shown in the following picture.
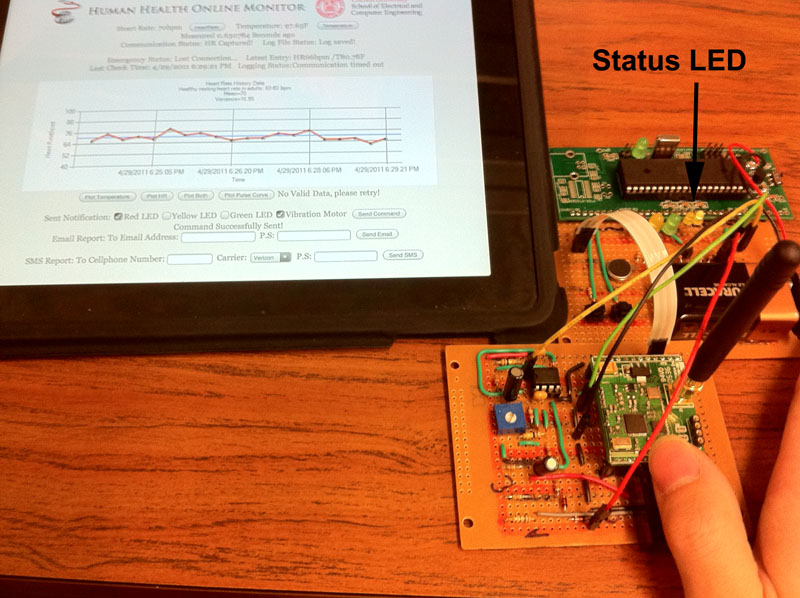
Status LED
Accuracy
The heart rate reading measured by our device is also amazing accurate! To test the accuracy of the heart rate measurement, a professional commercial blood pressure monitor is utilized to measure the reference reading. Tests are done on the project team members. The following picutre shows the testing result. The maximum error counts in unit of bpm is +/- 3. However, the error may even includes the the inconsistent heart rate of the test object itself which makes the actual project error potentially smaller than the current one.
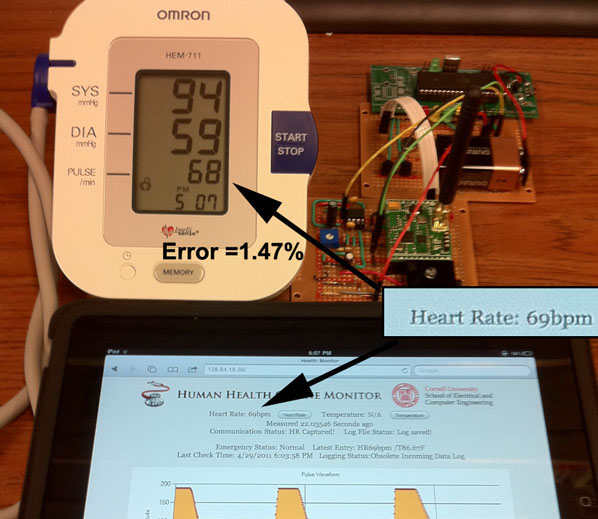
Accuracy Test
The following table shows the test results on more test objects and the error analysis.
Test object |
Reading from the Project (bpm) |
Reading from Professional Equipment (bpm) |
Error |
|---|---|---|---|
Xun Yang |
63 |
65 |
3% |
Houman Azemati |
73 |
73 |
0% |
Yinglei Wang |
60 |
63 |
5% |
The error analysis shows that the project gives out a wonderful accuracy especially when the measurements of the project and the professional product are not conducted at the exact same time. There might be some minor change due to the human body itself.
Notification System
The notification system works very well in terms of the response accuracy and delay. The desired LEDs can be lit up within a maximum delay of 0.5 second after the send command button is pressed on the website. The following pictures illustrates how the system works.
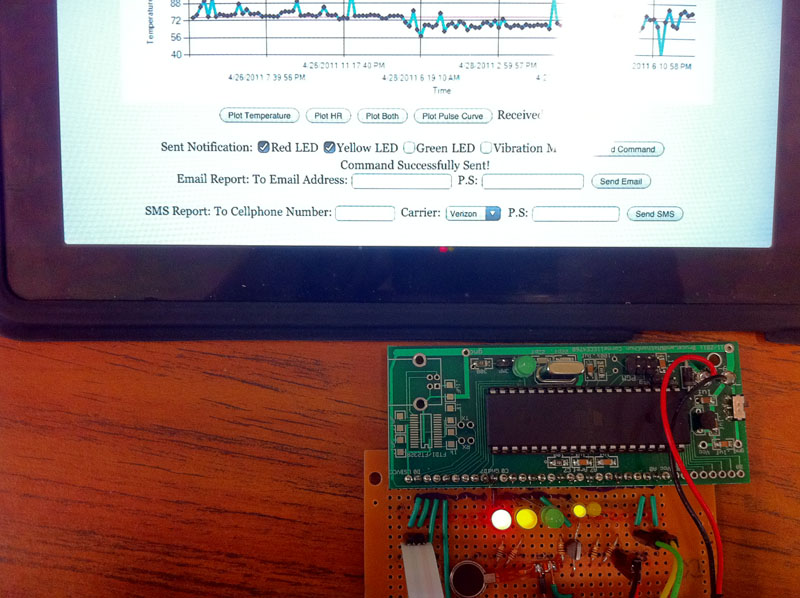
Notification LEDs
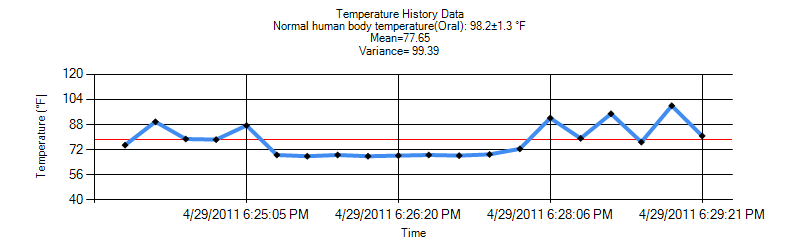
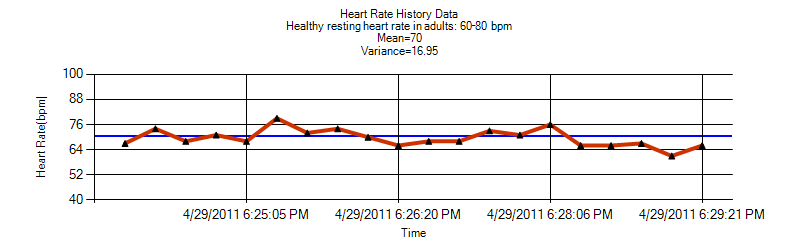
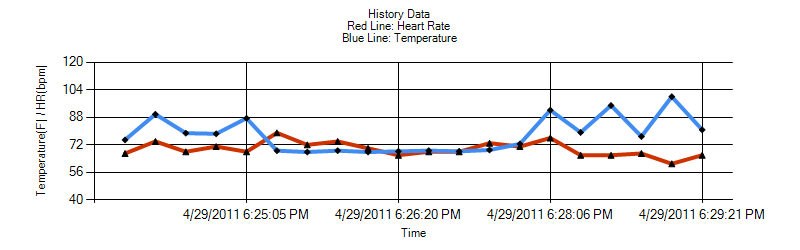
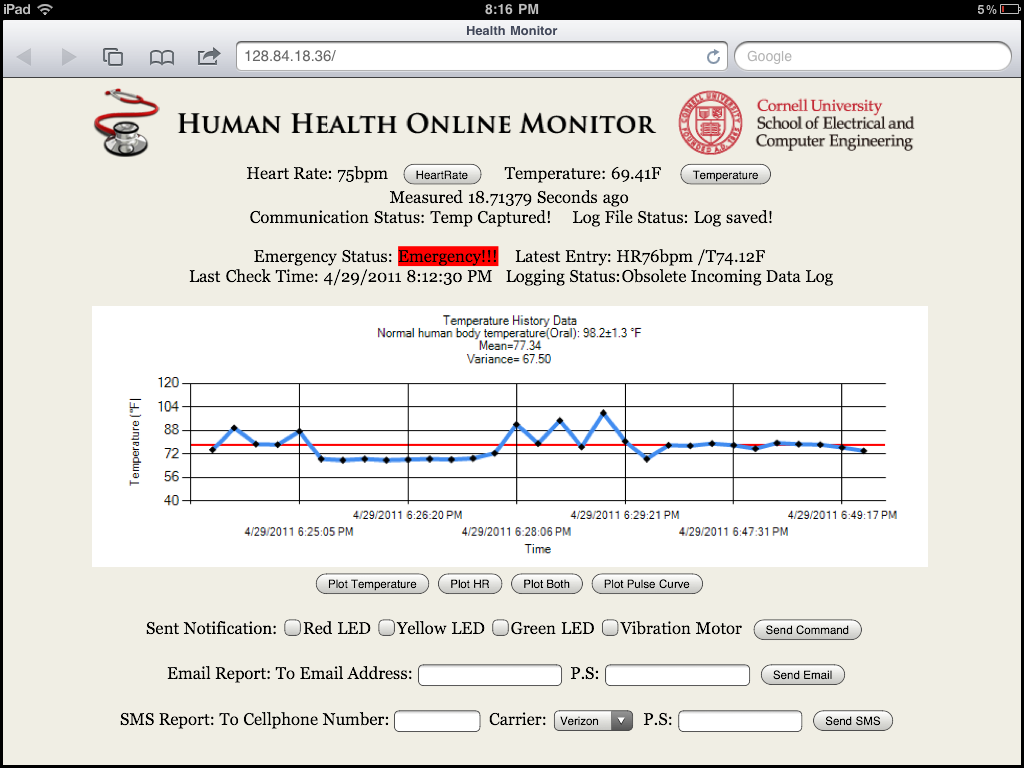
History Data
All historical data is stored on server's hard drive and can be plotted to the webpage. The reaction is very responsive because the chart image is very small is size. Pay attaention to the data below the chart title. Mean value and vairnace is calculated for the whole population of data. The data manipulation is accurate and provides useful statistical information for the doctor to diagnose. The strip line plotted in the chart shows the mean value of the data set gives visualization of the data. The following picture shows the historical data charts.
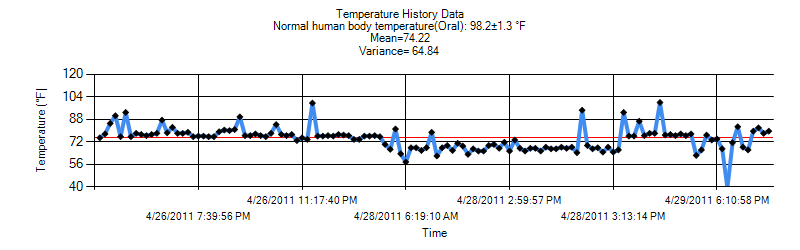
Temperature Hisory Data
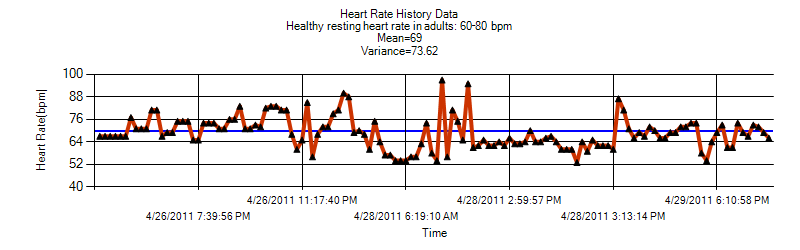
Heart Rate History Data
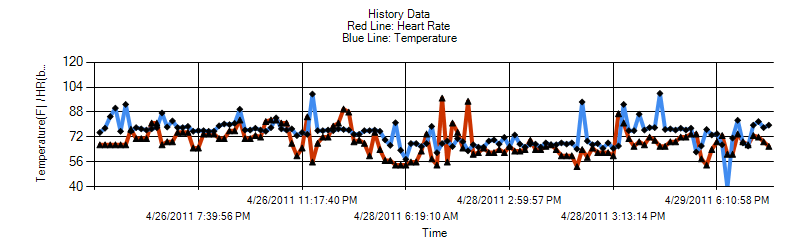
Historical Data for Both
The transmission of the pulse curve waveform requires a longer time to display. The delay is caused by the limitation of the data rate of the wireless module. It required at least 2 or 3 seconds for the server to acquire a complete set of samples. The pulse curve chart gives a very smooth and accurate waveform.

Pulse Curve Waveform
Accumulated Measurements Test
Just as stated in the section above, the historical data browsing function can be very useful to tell if one's heart rate is stable over a certain period of time. One practical and meaningful example can be constantly measuring one's heart rate for 3 minutes. The auto logging function can stored all the historical data for the 3 minutes and shows if the heart rate is consistent and stable. The following three figures show the measurements of the test object (Yinglei Wang) over a period of 3 minutes. Pay attention to the statistical manipulation shown below the tilte, it tells critical health information of the test object.
Temperature Hisory Data Over 3 Mins
Heart Rate History Data Over 3 Mins
Historical Data for Both Over 3 Mins
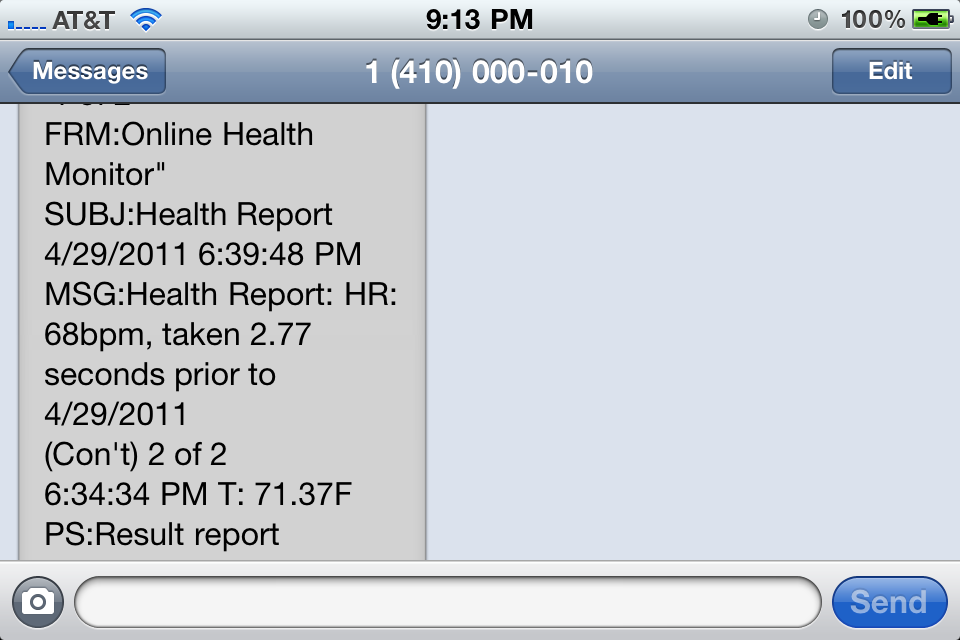
Health Report
As stated in the web server section. An automatic generated report can be sent via Email and SMS on the website gives a quick view of the health condition along with the time information. The function is created aiming to share the information in a convenient way. The following pictures show the health report email and SMS.
Health Reporting via SMS
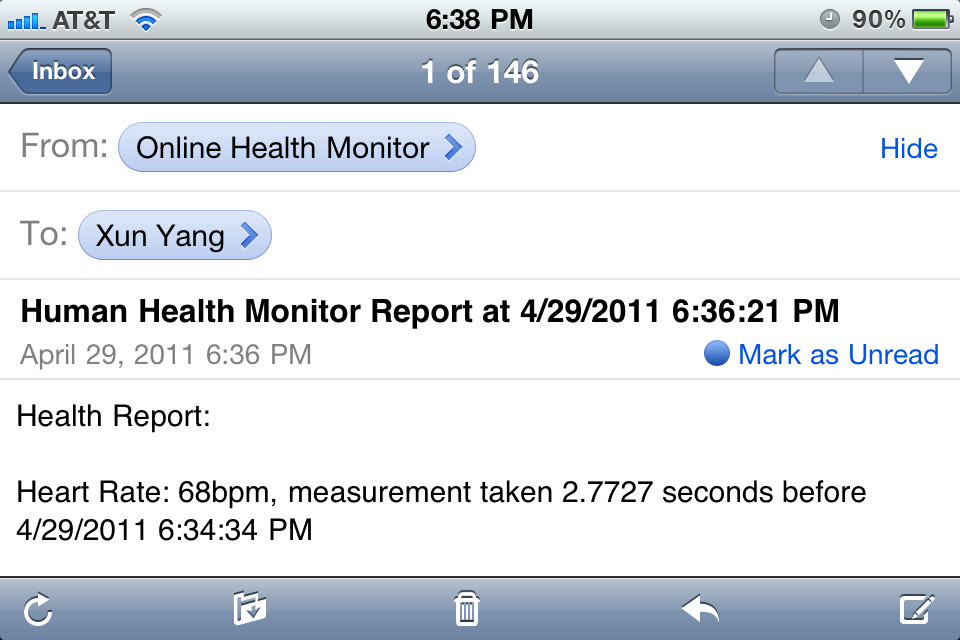
Health Report Email
Health Report SMS
SOS Message
The SOS message can be delivered to the pre-defined contacts in time and accurately. The reaction can be very responsive once the emergency status is captured by the server. Since the server checks the emergency every 15 seconds, the longest time it takes to deliver the emergency message after pressing the button is 15 seconds. Once the emergency status is captured by the server, the webpage will immediately update the status label as shown below.
Emergency Status Label
The emergency message is sent both via Email and SMS. Generally, due to the delay of the cellphone carrier, the email is delivered earlier than the SMS.
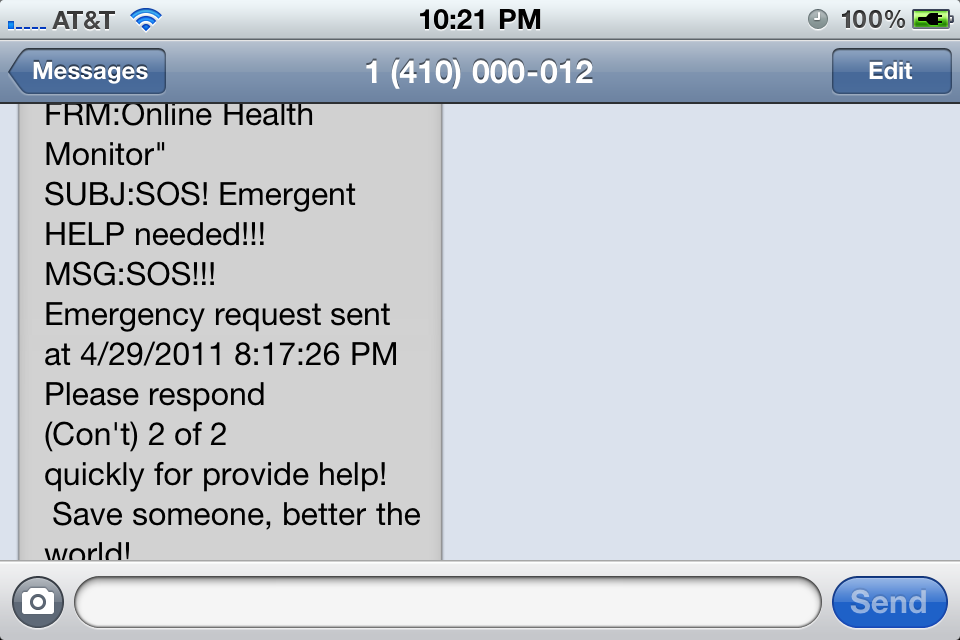
Emergency SMS
Wireless Communication Test
The wireless module offers a wonderful communication range. However, significant amount of battery power is consumed to pay off the range benefit. We selected three typical spot near the engineering quad to test the wireless communication. Each testing spot concentrates on one aspect of the wireless signal transmission. The test point 1 located inside the Kimbal hall concentrates on both the transmission range and the penetration ability. The test point 2 was intentionally assigned far from the receiver with few obstables in between. The test point 3 focus on the study of the penetration ability. The wireless signal had to penetrate at least 6 solid wall to reach the receiver. Since the wireless communication is bi-directional, the solid communication with little delay is required. The testing results indicated that wireless communication is sufficient for the users to take measurements at anywhere at home and communicate with the server for data exchange. The following maps shows the details of the wireless communication tests.
View Transmission Range Test in a larger map
Safety Enforcement
The product is designed to be used in people's daily life with extreme ease of use. Thus, it is also critical that it should not bring any safety concern to the users. Since the device is only running at 9V for the maximum voltage, the user should not have any concern of being electrically shocked. The only possible safety issue is on the hardware construction. The leads which have sharp edges may cut users' skin. To enforce the safety and eliminate the possibility of being cut by the sharp edges, all leads have been carefully polished.
Interference
Stated in the previous section, the project ran into the problem of being interfered by other group's radio because of sharing the same default channel. This problem is easily fixed by changing the radio channel to a non-default one. Detailed information can be referred in the wireless communication section.
Conclusion
TopSummary | Further Improvement | Intellectual Property Considerations | Ethical Considerations | Legal Considerations
Summary
The importance of this project is that we implemented a cheap, portable and easy to use health monitor system. This has special meaning for patients with cardiac problem because they can log their heart rate all the time, receive information from the doctors and send out help messages when they are in emergencies. The device is affordable by almost every patient. This final project is successful with most of the objectives and extended goals in the proposal achieved.
For primary objectives, heart rate and body surface temperature are measured accurately and automatically. The hardware and software is workable for almost everyone. MCU can communicate with server via bi-directional wireless communication. The webserver is connected with the Internet and date can be accessible all over the Internet. The webpage is accessible to both desktop and mobile users.
For extended goals, online users can send message to the portable terminal over the Internet. The message is displayed using LEDs and vibration motor on the portable terminal. When the emergency button on portable terminal is pressed, the webserver will notice it and fire text message to emergency contacts. The health information is automatically logged over time and the history can be seen in the online visual historic data browser.
The breath rate detection requires modification of the detection circuit and lowers the quality of heart rate detection. After considering this tradeoff, breath rate detection is excluded in this design project.
Further Improvement
The hardware side may need further improvement. Because of resource constraints, the current portable terminal is compact and portable but requires the user to intentionally put fingers on the sensors. If given more time and more resources, the sensors could be comfortably and firmly attached to appropriate part of the body so that the health information can be logged all the time.
Another aspect is that currently we are using a donated radio module to wireless transmit data from the MCU to the webserver. The range of this wireless transmission is limited. For further improvement, GPS modules can be used and the MCU could send and receive data directly through Wify. This allows user to take the device wherever they want and they don't need worry about the communication range limit. The GPS module could also locate the user so that once emergency happens, doctors know where the patient is and the rescue is more efficient.
Intellectual Property Considerations
In our first attempt of developing the heart rate detection algorithm, we referenced the last year's project "Heart rate monitor". We used their method of moving average of previous data to predict the threshold of the next pulse. This is just one step in developing our algorithm and we came up with more advanced and very different solutions later.
The heart rate detection circuit is provided by Prof. Bruce Land and we got the approval to use the circuit in our final project.
Ethical Considerations
The big concern about ethics here is the privacy of the patients. As all of the health information is published on-line, and this information is very private, this information should be only delivered to specific people with the patient's approval. Therefore, passwords may be needed to get access to a specific patient's health information. The information should also be securely delivered.
Another thing may need to bring attention to is the security of the log file. Since the log files contain patients' health information, they have to be well-protected from attacks. One good solution is to make these data unidentifiable to any specific user or patient and never record the identification. In this way, the log data can appear anonymous.
In the process of our final project, we tried our best to be consistent with the IEEE code of ethics. We paid attention on similar products to our project and the patent issue of these products. We also try to protect our right by properly claiming our work. We reported our result with our own experiment data and verified the accuracy with commercial devices.
We also actively participated in the communication between professors, TAs and classmates. We actively seek and accept honest criticism to our project and we also provide advices to other groups. In the process of this project, we also offered to help other groups who were doing similar things with us like using the wireless module.
We paid a lot attention to safety. We always checked that the soldering iron was turned off after we used the soldering station to ensure the safety of the lab and the safety of other students working in this lab.
In summary, the IEEE code of ethics is a guideline for us in our final project.
Legal Considerations
The wireless modules communicate via 902-928 MHz signal. A similar module of this product is certified by FCC. Antennas are also certified by the FCC.
Appendix
TopBudget
The budget is calculated based on the part cost list in the project instruction page. There are some parts which do not show in the table are estimated with best guess.
| Quantity | Cost per Unit | Total cost | |
|---|---|---|---|
| Headers | 119 | $0.05 | $5.95 |
| Switch | 1 | $0.2 | $0.2 |
| DIP socket | 3 | $0.5 | $1.5 |
| Max233CPP | 1 | $7 | $7 |
| 2 Pin jumpers | 5 | $1 | $5 |
| 9V Battery | 2 | $2 | $4 |
| Solder board | 3 | $2.5 | $7.5 |
| Mega 644 | 1 | $8 | $8 |
| Vibration Motor | 1 | $1 | $1 |
| RF module Wi.232DTS-EVM-R | 2 | Donated for free | $0 |
| IR module (unused) | 2 | $1 | $2 |
| RS232 CPP | 1 | $1 | $1 |
| Battery holder | 1 | $1 | $1 |
| Protype board | 1 | $5 | $5 |
| IR emitter | 1 | $0.25 | $0.25 |
| Photorransistor | 1 | $0.54 | $0.54 |
| LM535 | 1 | Donated by Bruce | $0 |
| Resistors | Donated by Bruce | $0 | |
| Capacitors | Donated by Bruce | $0 | |
| Diodes | Donated by Bruce | $0 | |
| LEDs | 6 | $1 | $6 |
| $55.94 |
Demonstration Video
The following video walks through the major functions of the project.
Circuit Schematics
The following circuit drawing include the complete circuit on the portable terminal.
Circuit Schematics of Portable Terminal
Acknowledgement
We would like to express our great gratitude to the following people/organizations for providing any form of help to our project. Without them, the project would not come to reality.
- Professor Bruce Land: Endless help and valueable guidance on the project. Always repondes with patience accepting our stupid questions.
- Radiotronix.Inc: Donation of the excellent wireless communication module.
- ECE 4760 TAs: Patient help on various specificproblems.
- Xuetian Wen: Provided valuable information in the beginning period, also helped to create this web page.
- Mrs. Jan Clayton: Critical help when setting up the web server.
- Natasha Gangjee: Provided access to the laser-cut machine.
Code Files
Copyright Statement
We welcome anyone to use our work to contribute your project. However, permission must be obtained from us first prior to any use. We would love to know how it can work for your and what it can do. Simply write emails to let us know.
The following links lead to the code files.
Microcontroller Code
- MCU main program (main.c)
- TRT OS (trtkernel644.c)
- TRT UART interface (trtUart.c)
- TRT OS setting (trtSettings.h)
- TRT UART setting (trtUart.h)
- Heart Rate Algorithmn (heartratealgorithm.c)
- Simple Temperature ADC (Temperature.c)
- Programm and test wireless module (Wireless.c)
Server and Website
- Website ASP.NET front end (Default.aspx)
- Server code-behind (Default.aspx.cs)
- History log (HistoryLog.txt)
- User event log (EventLog.txt)
- Testing data log (DataLog.txt)
MATLAB Algorithmn Development code
Specific Tasks
This following table shows the specific tasked finished by each indivisual.
Heart Rate Algorithm Development |
Yinglei Wang |
|---|---|
Web Server and Website Construction |
Xun Yang |
Web Server and Website Construction |
Xun Yang |
Webpage Encoding |
Xun Yang |
Temperature Measurement |
Xun Yang |
Detection Module fabrication |
Houman Azemati |
Data logger development |
Houman Azemati |
Heart rate circuit Construction |
Yinglei Wang and Houman Azemati |
Real time system, task scheduling, interface between MCU and server |
Yinglei Wang and Xun Yang |
Prototype board |
Yinglei Wang and Xun Yang |
Periodic Progress Reports |
Xun Yang |
External Circuit Construction |
Yinglei Wang , Xun Yang and Houman Azemati |
Final Intergration and Testing |
Xun Yang and Yinglei Wang |
Final report |
Yinglei Wang , Xun Yang and Houman Azemati |
Designers

Xun Yang
Yinglei Wang
Houman Azemati
Toolset
Thanks to the advanced technology in the current world makes life so beautiful. With the wonderful toolset, work becomes very efficient.
Softwares
- Microsoft Visual Studio Professional 2010 : Server & Website Construction
- AVR Studio 4 : MCU programming
- MATLAB R2011a : Algorithmn development
- Solidworks : IR module design
- Photoshop CS5 : Image Processing
- DreamWeaver CS5 : Report Webpage Editing
- Notepad++ : Coding
Languages
- C#.Net : Server code-behind
- ASP.NET : Website front-end
- C : Embedding programming
- HTML : Webpage editing
- Visual Basic : Data logger program
- MATLAB : Algorithmn simulation
- Chinese : Mother tongue
Web Serive
- Evernote : Real-time idea sharing
- Google Doc : Documentation shareing
- Gmail : Background Email service
- Dropbox : File sharing with no efforts
Life Beyond the Project
The project lasts for 4 weeks in total. Tons of efforts had been put in without any consideration of payoff. We are glad that project achieve success and we had lots of fun in it.
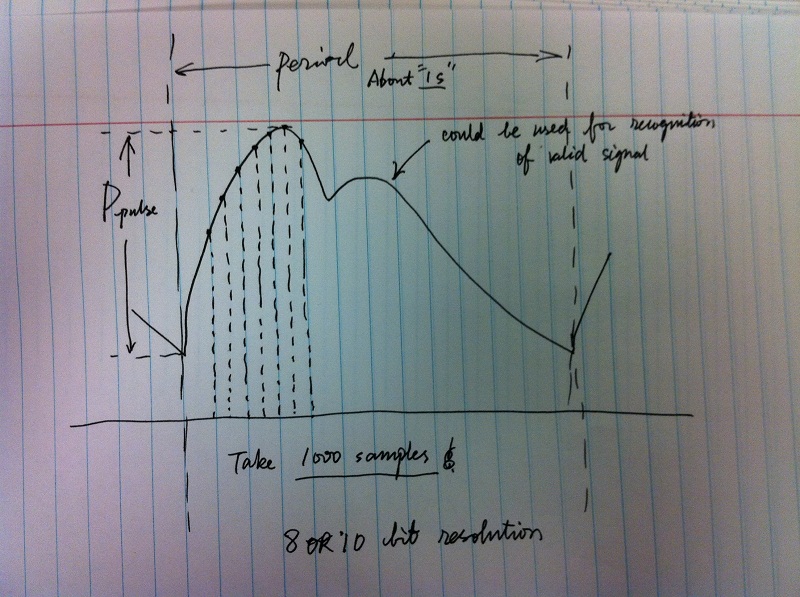
Original Hand Scripts
- Initial Hand Script of ADC Design
- Cardic Pressure Curve Study
- Initial Idea Generation
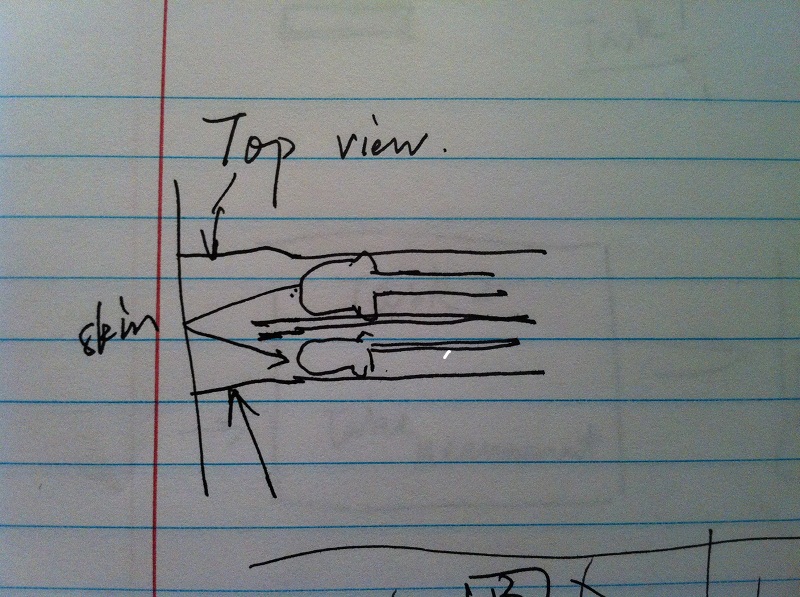
- IR Module Design
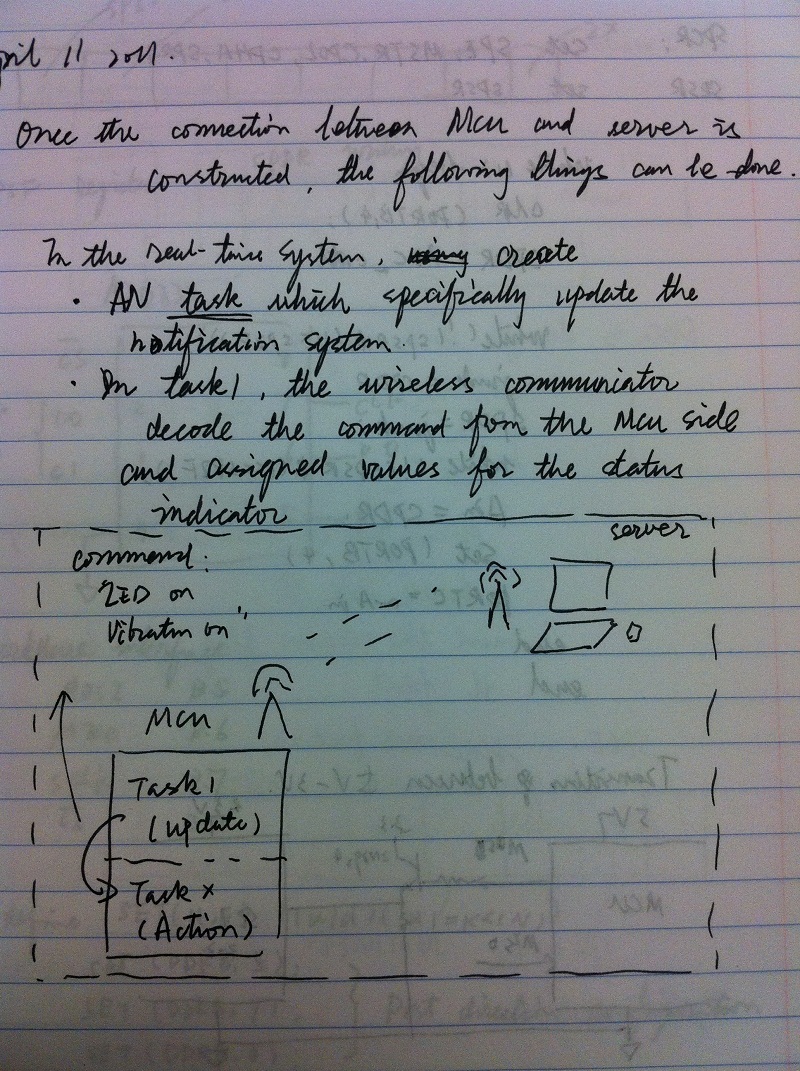
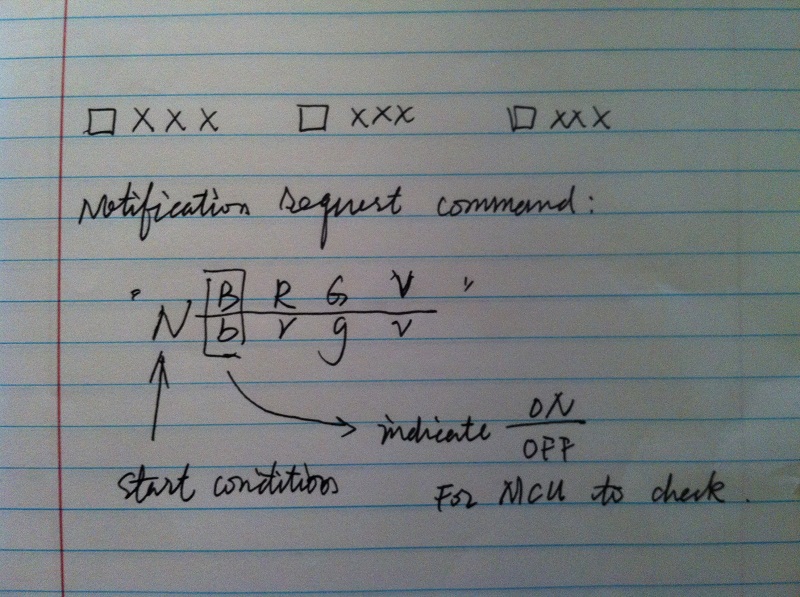
- Command String Encoding
- TRT OS Tasks Scheduling
- Full Command Control
- Auto Logging Design
Life Behind
Reference
TopData sheets
- Mega644 datasheet: http://www.atmel.com/dyn/resources/prod_documents/doc2593.pdf
- Wireless Module data sheet: http://www.radiotronix.com/datasheets/WI232DTS-R_um_1_5_0.pdf
- LM34 Datasheet: http://www.national.com/ds/LM/LM34.pdf
Vendors
Code/Design borrowed from others
- Heart Rate detection Circuit: http://instruct1.cit.cornell.edu/courses/ece5030/labs/f2009/Plethysmograph.html
- TRT Real-Time OS: http://people.ece.cornell.edu/land/courses/ece4760/TinyRealTime/index.html
Background sites/paper
- Electrocardiography, general information: http://en.wikipedia.org/wiki/Electrocardiography
- Cardiac cycle: http://en.wikipedia.org/wiki/Cardiac_cycle
- Aortic Pressure, Richard E. Klabunde, PhD: http://www.cvphysiology.com/Blood%20Pressure/BP003.htm
- Cardiac Information (Chinese): http://baike.baidu.com/view/57019.htm
- Human Body Temperature: http://en.wikipedia.org/wiki/Normal_human_body_temperature
- COM Port Communication in C#: http://www.c-sharpcorner.com/uploadfile/eclipsed4utoo/serialportcommunication12082008111137am/serialportcommunication.asp
- COM communicator example (in Chinese): http://blog.csdn.net/wuyazhe/archive/2010/05/17/5598945.aspx
- Serial Communication Library: http://msdn.microsoft.com/en-us/library/system.io.ports.serialport.aspx
- Wonderful ASP.NET Tutorial: http://www.4guysfromrolla.com/
- Pan-Tompkins Algorithmn: http://www.engr.wisc.edu/bme/faculty/tompkins_willis/Pan.pdf