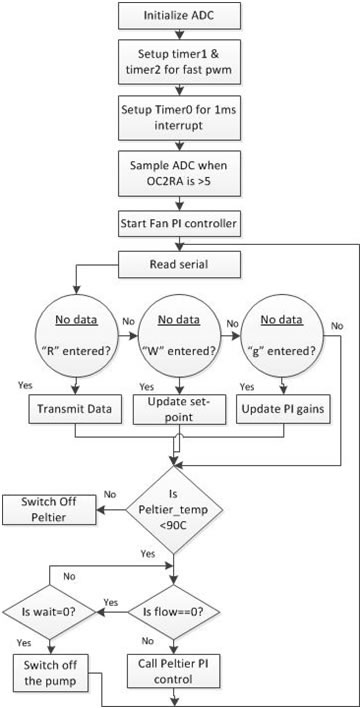
Figure ( 10) Controller flow chart
In the software part of this project, we first started by setting up the microcontroller to measure temperature readings. To accomplish this, we had to configure the Analog to Digital Converter ADC. We started by reading one ADC channel and afterwards, we scanned all ADC channels. We were able to convert resistance change of thermistor to temperature using an equation that we got from the curve fitting the resistance change verse temperature plot. This was inefficient as it involved a lot of floating point calculation which takes longer time to calculate and overloads the microcontroller; instead we established fixed point arithmetic where we used a look up table that looks up a corresponding temperature based on the ADC 10 bit value. After being able to measure temperature, we then configured timer0 to generate a time interrupt of 1ms. This helped us in calculating the flow rate of each loop based on the frequency measurement we got from the flow sensors. Flow sensors were connected to digital pins D12, D13, so each time there is a change in the status of any of the pins, we incremented a variable which after 1000 times interrupts, we convert these pulses into frequency. Having both temperature and flow rate measured facilitated us introducing a single input single output PI controller for the chiller loop pump to control the follow speed in that loop. We were also able to run a single temperature PI controller on the chiller loop to control the temperature of the air supply.
Stage1:This stage was pretty straight forward as we integrated the configuration of ADC, timer interrupt, and PI loop together. In addition, we started tuning the temperature PI controller to give the best response with minimum overshooting. Setting the PI parameters were a compromise of how fast we wanted to get to the set point verses oscillation around the set point. During this stage, we have also implemented safety checks such that if the Peltier Heater temperature exceeds 90ᵒC, then we switch it off as well as if there is no flow in the condenser loop; we switch the pump off to protect it against running dry. The following flow chart indicates the high level design of the software.
Figure ( 10) Controller flow chart
Stage 2: In this stage we started the implementation of wireless communication between the PC and the controller. To implement this feature, we later on designed a GUI in Matlab and also an interrupt driven UART for the controller as well. In the first stage of our design, we needed to reprogram the controller to observe the response of the system under various settings. This also introduced a risk of destroying the controller from the physical or electrical damage (static charge that our bodies hold). The implementation of wireless communication helped us overcome this difficulty. In this stage we utilized a serial terminal program, TeraTerm to transmit and receive data wirelessly using Zigbees. Though it was helpful, we did not have any control over incoming data. Nevertheless it was the first step towards designing the GUI.
Stage 3: To overcome the limitations of stage 2 design, we designed a GUI in Matlab. In the primary design, we implemented a control over the amount of data we receive. We did this by restricting the Matlab code to a certain number of user entered reads. It was not optimal compared to controlling the data flow from the controller itself, but it proved to be a good tool for debugging the performance of the system. In the later part of this design stage, we added a feature to transmit the user entered setpoint to the system.
Stage 4: Achieving total control over the data transmitted and received was the goal of this part of the design stage. All these features enhanced the control any user had over the system.
The features we added in this stage are:
To make the wireless interactions between the controller and the computer more user friendly, we decided to design a GUI which implements the functions. Initially we had functions which needed to be called from the command line in MATLAB which was a tedious task for a user unknown to the system. Hence we plan to have a GUI designed which implements the commands to acquire data wirelessly and also command the controller to reach a desired set point on the system.
The GUI was designed using the GUIDE – a layout editor available in Matlab. The key features of the design are pointed out in figure (10) and explained briefly.
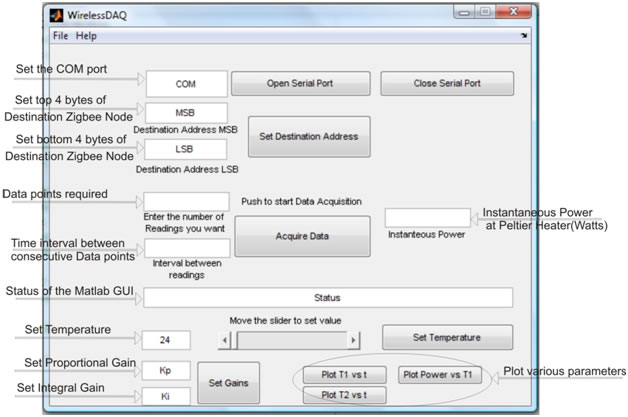
Figure (10) : GUI design layout
Setting the COM port of the connected Zigbee Module: As the serial port is now obsolete in most personal computers and laptops, the use of USB-Serial converters is increasing. These devices on the USB emulate a serial port and hence do not have an assigned COM port address (eg COM1, COM2 and so on). Hence on different computers we may have different port addresses. To make the GUI more user friendly, we included an option where in the user can enter the comport value and then open the serial communication using the ‘Open Serial Port’ button.
Setting the Destination Address: The Zigbee module can hold a single destination address. In a mesh network where we have multiple nodes and want to communicate with all of them, we can change the destination address on the Zigbee and hence communicate with the desired node.
Setting the number of data points required: To implement a controlled communication, we added this feature of supplying the number of data points required. This feature commands the controller to send the data only when asked by the user and also in the quantity asked by the user.
Setting the time interval between reads: Since we are dealing with controlling the temperature here, sending out data every couple of milliseconds just accumulates redundant data. Hence to control the interval between successively transmitted data point, we provide the user with the feature to enter this value.
Setting the temperature: This feature sets the desired temperature for the PI control loops. It has been implemented using the slider bar and the text box. So a user can update the value at any of these objects. The range of temperature that has been provided is from 24˚C to 37˚C in steps of 0.1˚C.
Setting the gains: Changing the gains and seeing the response of the system in essential in choosing the best combination of gain values. Before we had this feature, we needed to reprogram the controller to change the gains and see the effect of this change. This was a very tedious task and involved removing the controller from the board and inserting it again. Hence we decided to add this facility which enables any user to change the gains and observe the effect of this change.
Plotting the data after it has been received: Once the data has been received and saved to a mat file, we have the feature of plotting the data against time. The two plot functions we have plot the two temperatures against the time based on the user defined iterations and intervals between the iterations.
Power: Based on the readings of the current and voltage sensor, we calibrated the ADC to resemble the instantaneous power consumed by the system. After extracting the data, we calculate the power consumed at that instant and display it on the GUI window.
Protocol Used for communication: Since we are using the Zigbee Module in the transparent mode, the format data received is identical to the one received in the standard serial communications. Hence to distinguish the different data points from each other we have a start byte (126 = 0x7E) and an end byte (126 = 0x7E). Hence each data point is encapsulated within the pair of start and end bytes. A typical data frame would look something like (0x7E)(Data)(0x7E). Data is sent out by the microcontroller in a preprogrammed sequence and hence can be decoded and sorted out at the receiving end.
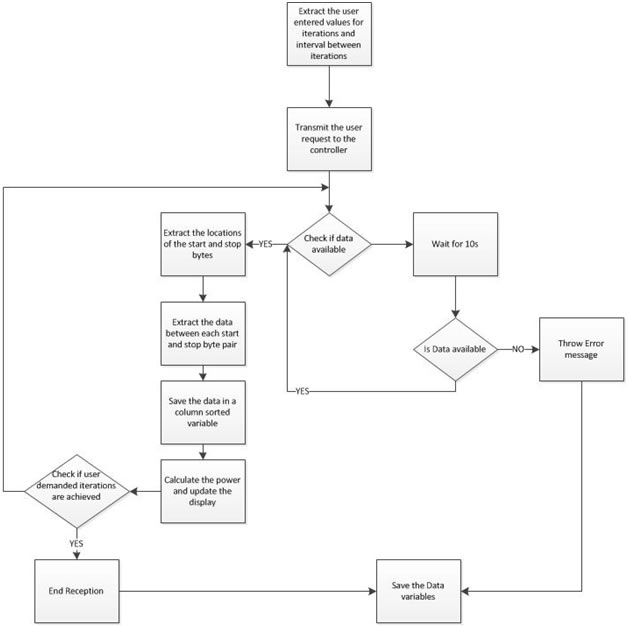
Figure (11): Matlab GUI decoding
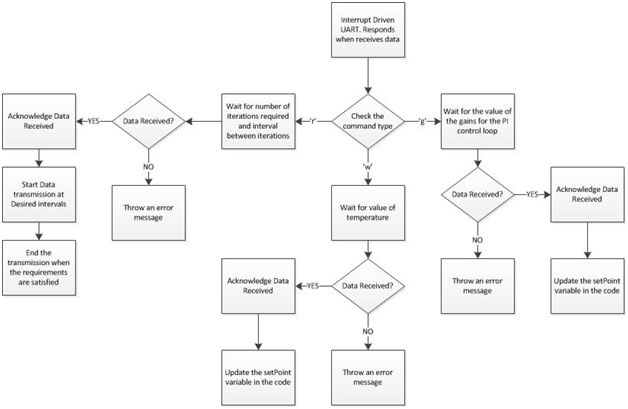
Figure (12): Logic decoding in Arduino Controller