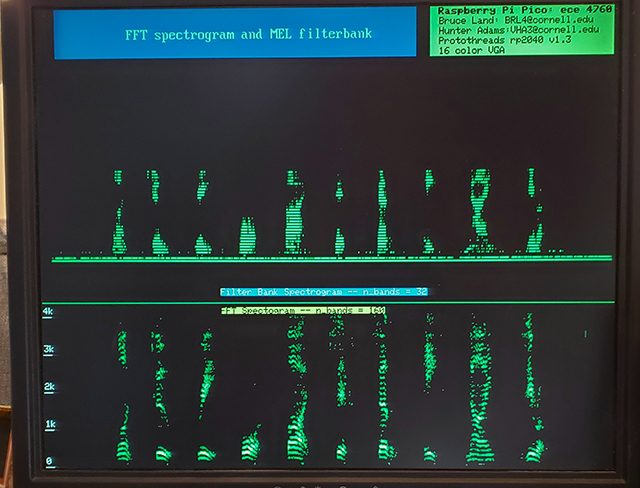
The following image is me saying the digits: one, two, ..., nine, zero.
Cornell University ECE4760
Voice Spectrograms
Comparing
short-term FFT and MEL spectrum
Pi Pico RP2040
Spectrogram -- Voice rate
Voice can be characterized in a variety of ways. Here we compare the short-term FFT and second order IIR filters approximating a MEL scale spectrum as ways to visualize speech, and perhaps as the first stage of voice processing for recognition or synthesis.
VGA routines were used to construct an oscilloscope-like display of an ADC channel connected to a microphone. The raw waveform is displayed, plus the power spectrum, the approximate log-power spectrum, and the spectrogram. Core 0 handles the data aqusition, IIR filters, and display. Core 1 does the FFTs and handles the serial terminal. The ADC acquires 512 samples at 12.8 KHz. This rate and window length is about right for speech spectrum (100-3500 Hz). The code computes 50% overlapped FFTs with a new spectrum every 20 mSec. The serial interface starts/stops the data acqusition. The spectrogram shows about 12 seconds of 40 mSec, 50% overlapped, sample windows.
The FFT code uses two interesting approximations. The first is the alpha-max, beta-min algorithm to speed up square root of sum-of-squares. It is accurate to within 6%. The second is an approximation of log base two from Generation of Products and Quotients Using Approximate Binary Logarithms for Digital Filtering Applications, IEEE Transactions on Computers 1970 vol.19 Issue No.02. It is accurate to within 0.2 log units and is represented is a weird u4x4 fixed point format. The resulting 8-bit log is accurate enough for plotting.
The IIR analysis code uses 32, 2-pole, bandpass filters, arranged on an approximate MEL scale of center frequencies. Each filter output is rectified and low-pass filtered with a time constant of around 5 mSec to make an average amplitude estimate for each filter band. The display of the IIR frequencies on a linear scale results in a sort of log-frrequency response vertically. If all is working well, the filter bank output should look like a simplified, vertically nonlinearly compressed, but recognizable version of the FFT spectrum.
The following image is me saying the digits: one, two, ..., nine, zero.
Copyright Cornell University May 3, 2024