Cornell University
Electrical Engineering 476
CodeVision 1.24.6 Debugger
for Atmel Mega32 microcontrollers
Introduction
This is an attempt to make a debugger which is easy to link with a target program and which allows interactive exploration and modification of the state of the target program. There are commands to read/write i/o registers, data registers and memory, read variables on the fly, and to determine the locations of the Codevision data stack and hardware stack.
The intent was to make a system in which a student could debug any C program (the target program) with very minimal modification. The debugger is small and designed to minimally interfere with the target program.
printf and scanf. use_rxc_isr option. This is an option to use interrupt-driven UART-receive so that you can break target program execution from the keyboard. Using the Debugger
There are only a few changes that have to be made to the target C program to run it with the debugger:
#include "debugger.c" if you have stored a copy of the debugger in the same directory as your project. UCSRB), then comment out that line.Project...Configure dialog set the clock speed to the correct crystal value, (as you should anyway). RS232 SPARE line to the PC. On the PC run hyperterm. Set up hyperterm for 9600 baud, no
parity, 1 stop-bit, no flow-control.debug(IDnumber).
The IDnumber represents a code that you choose. 0x55 just before entering the debugger when button 1 is pushed. The demo code
assumes that PORTB will be hooked to the LEDs on the STK500, PORTC to the
switches, and the UART (PORTD.0 and D.1) attached to a PC running hyperterm.
The demo code is a slightly modified version of sched1.c
used as an example in Lab 1 in 2005. report or logV statement (see second table below). #define nullify_debugger just before the debugger include statement. All debug statements can stay in the target program, but the program acts as if they are removed and there is no code size or timing overhead. There are keyboard commands available which you can use at the db> prompt (appearing on the
PC hyperterm window) and there are various debug statements which you embed in your target program. The two tables below explain the commands and statements.
Interactive Commands:
The interactive, db> prompt commands are in the first table table. The Backspace key works at the debugger command line, but does not echo the erased characters. After backspacing, new characters type over old characters. No error checking is done at the command line. Unrecognized commands are ignored. Poorly formed parameters (e.g. letters in a number) default to whatever C does to them, which is usually to return a zero.
h |
Prints a short version of this table (disabled if you comment the verbose define). |
||||||||||||||||||||||||
g |
Exits the command shell and run target program | ||||||||||||||||||||||||
<control-c> |
Stops the target program and enters command shell with DebugID=255.
NOTE: you must uncomment a define near the beginning of debugger.c for this
command to work. |
||||||||||||||||||||||||
x |
Forces a RESET of the MCU and trashes the state of your program! This is implemented using the watchdog timer reset function. | ||||||||||||||||||||||||
i ioregAddress |
Reads an i/o register. The register address is entered in hexadecimal.
The result displayed in in hex. Example: i 13Reads the state of the pushbuttons attached to PINC. |
||||||||||||||||||||||||
I ioregAddress iodata |
Writes to an i/o register. The register address and data are entered in
hexadecimal |
||||||||||||||||||||||||
r datareg |
Reads data register. The register number is in decimal. The
result displayed is in hex. The .map file generated by the
compiler will show you where variables are stored. Note that Codevision can store varibles in SRAM or in registers. You have to look at the map file to verify where a variable is stored. Registers 1 to 15 are available for global variables. Registers 16 to 21 can store local variables. Registers 22 to 31 store state information for Codevision. Normally, no user information
should be in these registers.Example: r 16 Displays the value 55 if the demo program is running and button
one is pressed to enter the command shell. This is because the running
program writes a 0x55 to data register sixteen just before it calls the debug(3)
macro. |
||||||||||||||||||||||||
R datareg data |
Writes task data register. The register number is in decimal.
The data is in hex.
0xaa to register 0. The debugger does not allow you to modify registers 22 to 31 because of the dynamic contents of these internal C registers make it hard to predict the results of a modification. If the
demo program is running, it stops with debugID=1 just after reset time. There are six local variables in registers when it stops. |
||||||||||||||||||||||||
m address |
Reads memory. Address is given in hex. The |
||||||||||||||||||||||||
M address data |
Writes data to memory. Address and data are in hex. 0xaa to address 7d0. Remember that
there is NO memory protection, so you can easily trash the system with this
command. |
||||||||||||||||||||||||
l, lc, ld |
View a logged variable. The l command shows a log, if any is stored. The lc command clears a log and the ld command lists the logged variable, but in decimal. To use these commands, you must first insert loginit and logV commands into your code (see table below). |
||||||||||||||||||||||||
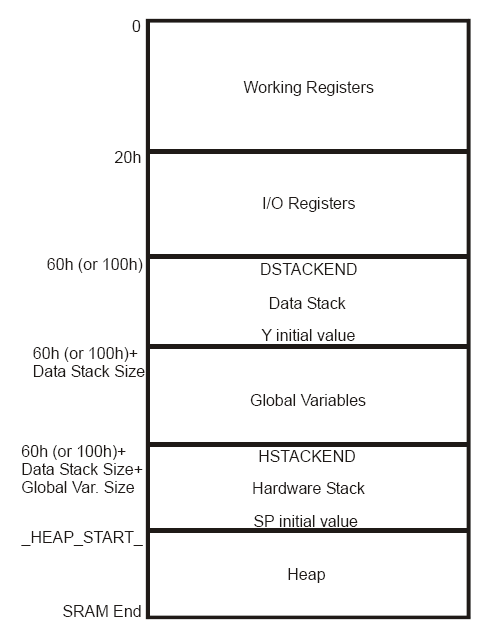
w |
Reads the memory location of the top of the hardware
stack. This is mostly useful to make sure that you have not overrun the
space allocated to the hardware stack. The value reported by this command is the stack location before the context switch to the debugger stores 32 bytes on the stack. The hardware stack grows downward from the top of memory, which in the Mega32 is 0x85f. Mega32 RAM organization diagram. Codevision RAM use diagram. |
||||||||||||||||||||||||
d |
Reads the memory location of the top of the data stack. This is mostly
useful to make sure that you have not overrun the space allocated to the
data stack. If you are looking for local variables, remember that Codevision
puts the first six bytes of local variables defined in a function in data
registers R16-R21. After that they are placed on the data stack. The example program stops with debugID=1 at reset time. The data stack has 6 stored bytes, then six local variables in registers. The software stack grows downward from a location set in the |
||||||||||||||||||||||||
s |
Reads the processor status register (SREG). Output is in hex.
|
Statements inserted in target program:
The following table has the statements which can be inserted into the target program. All of the report statements slow down the MCU while printing to hyperterm. The time overhead is about 1mSec/character printed, including spaces and carrage returns. This time overhead is not too important if the commands are in a task which executes every 500 mSec, but they should not be used in any fast ISR. A short demo shows how the commands work. The logging commands are much faster (about 3 microseconds) but use memory. A big log may crash the software stack.
#define nullify_debugger |
Completely eliminates the debugger, while allowing debug, report and log statements to remain in the program. Use this when you are ready to make a production code. |
<control-c> |
Stop target program and enters command shell with debugID:255. This command is actually interactive, but is included here for completeness. NOTE: you must uncomment a define near the beginning of debugger.c for this command to work. |
debug(char debugID) |
When used in the target program being debugged, this macro enters the command shell with the specified debugID. The debugID can be used as an error code. The valid range is 0<debugID<250. Example: debug(4) |
reportR(regnum) |
Display the contents of data register regnum while the program is running. The output register number is in decimal and the contents is in hex. Time overhead is 6 or 7 mSec. |
|
Display the contents of i/o register ioregnum while the program is running. For example, reportI(0x3f) returns the value of SREG. The output register number is in hex and the contents is in hex.Time overhead is 6 or 7 mSec. |
reportM(address) |
Display the contents of memory location address while the program is running. The output address is in hex and the contents is in hex.Time overhead is 7 to 10 mSec. |
reportVhex(var) |
Display the contents of variable name var in hexadecimal while the program is running. This command will show the value of char and int variables, as well as i/o registers (e.g. TCCR0) defined in the mega32.h header. Time overhead is 7 to 10 mSec. |
reportVdec(var) |
Display the contents of variable name var in decimal while the program is running. This command will show the value of char and int variables, as well as i/o registers (e.g. TCCR0) defined in the mega32.h header.Time overhead is 7 to 10 mSec. |
logInit(var,max) |
Initialize a storage area for logged variables. The log is created below the software stack and grows upward. A big log may crash the software stack. The max parameter sets the maximum size of the log and must be less than 256. The variable name is stored for interactive use and must be less than 16 characters. If you use logV(var) more than max times, you will enter the debugger with debugID:254. |
logV(var) |
Record a variable of name var to be displayed later in the debugger with the l command. The variable must be only 8 bits (type char). You must call logInit once before using this statement. If you use logV(var) more than the maximum number of times set in the logInit command, you will enter the debugger with debugID:254. Time overhead of logV(var) is about 3 microseconds with a 16 MHz clock (49 cycles). |
Details of using the debugger
The debugger attempts to change the state of the MCU as little as possible:
main with interrupts turned off (normal behavior), unless you have chosen to enable the character receive ISR (see above). printf and scanf (normal behavior).#define nullify_debuggerWhen you enter the debugger, the three MCU timers are frozen, but interrupt state is not changed. If you don't like this particular behavior, you can hack on the following macro debug (in debugger.c) to change the defaults. The saveitall and loaddatareg functions are asm routines to make it easier for the debugger to get the SREG, stack pointers and data register values. You can treat the debug ID as an error code for your program.
#define debug(id) \
	do{      	\
	db_t0temp = TCCR0;  \
	db_t1temp = TCCR1B; \
	db_t2temp = TCCR2;  \
	TCCR0 = 0;  \
	TCCR1B = 0; \
	TCCR2 = 0;  \
	saveitall(); \
	db_break_id = id;  \
	cmd();     \
	loaddatareg(); \
	TCCR0 = db_t0temp;	\
	TCCR1B = db_t1temp;\
	TCCR2 = db_t2temp;	\
	}while(0)
If you want to be able to enter the debugger with a <control-c> from hyperterm, uncomment the following line near the beginning of the debugger.c file. But note that your main is entered with interrupts enabled! Also, the target program should not disable interrupts for a long period of time when using this option. NOTE: If you turn on this option, then you cannot use the debug statement in any ISR unless you explicitly set the I-bit in the ISR.
//#define use_rxc_isr
If you want to save 400 bytes of flash memory you can comment the following define, however you will lose the interactive help command.
#define verbose
If you want to disable on-the-fly reporting of variables to the terminal, comment out the following to save 100 words of flash.
#define use_reporting
If you want to disable on-the-fly logging of variables to memory for later inspection, comment out the following to save 150 words of flash.
#define use_logging
When you are done debugging and want to try out the final code, insert the line
#define nullify_debugger
just before the debugger include statement. All debug statements can stay in the target program, but the program acts as if they are removed and there is no code size (or timing) overhead.
Older versions of the debugger are available, but are bigger and slower.
Copyright Cornell University Jan 2007