OptoMyoGram
OptoMyoGram: an infrared based hand gesture detection system
Industry practice and Our Motivation:
Hardware Design and Implementation:
Hardware for this setup consists of the following parts:
Band pass Amplifier (Section 4-6)
National Instruments – Data Acquisition Box:
Phase 1: Breadboard setup of the circuit
Phase 2: Transfer of the breadboard circuit onto PCB board
Phase 3: Assembly of final IR sensor module
Hardware Utilized per Filter (single Channel)
Principal Coordinate Analysis Theory and Application
Controlling artifacts due to the movement of the skin:
Differentiating between signals of different fingers:
A: Testing the infrared muscle detection principle:
B: Testing Amplification Circuit:
C: Testing MATLAB detection algorithm:
Intellectual property considerations:
Introduction:
OptoMyoGram: an infrared based gesture detection system
The aim of our project is to be able to sense the movement of a hand’s fingers, leading to a detection of gestures being indicated by the hand. We aim to achieve this by sensing the change in the absorbance of infrared light by the blood around the tendons.
The underlying principle behind our project is that the blood absorbs infrared light and when a muscle contracts, the amount of blood around the muscle is reduced temporarily – which is reflected as a change in the IR absorption of the blood. This data can be used to track muscle movements. The same principle can be applied to regions with Tendon concentrations, which, when under motion, cause a predictable change in blood concentration around them.
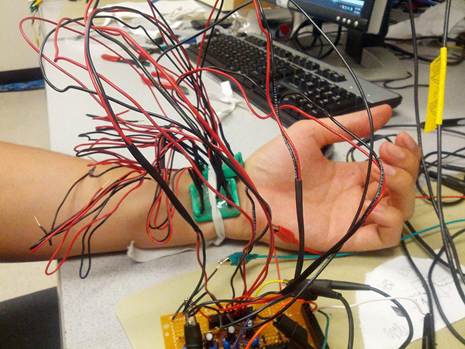
To enable this measurement, we constructed an infrared (IR) based sensor out of PLA plastic. Each section had an infrared emitter and 4 infrared phototransistors. The IR light was emitted by the IR LED in the band and the scattered light was collected by the phototransistor. This sensor is placed at the wrist on the inside of the arm.
We then created a MATLAB based GUI that calibrates the sensor to the user’s hand. Once calibration is complete the detection algorithm can determine which finger the user is moving via Principal Component Analysis.
This project forms the basis of a non-image based system that can later be used to translate gestures in to commands.
High Level Design:
Industry practice and Our Motivation:
Our project is inspired in part by an upcoming product called ‘Myoband’ which reads electrical activity produced by muscles (https://getmyo.com/) and translates it into actions on a computer. We intended to replicate and possibly, further enhance the capabilities of this device. Contrary to their working principle of reading electrical signals, we used infrared signals to get similar functionality. Be replacing electrodes with IR sensors we hope to lower costs and create a safer product.
Currently, the standard practice in industry is to measure muscle contractions via the electrical signals sent from the brain to the muscle. While this method is effective, it is also prone to interference and can lead to serious injury if the electrodes are improperly grounded.
In ECE 4760 during the Fall 2012 semester, another group used IR sensors to detect muscle movement in a project titled ‘Muscle Music Control’. However their work could only detect wrist movements. Our objective was to further improve upon this idea by measuring the movement of each individual finger. Our project could eventually lead to a gesture based control system that could easily be connected to computers or smart phones via Bluetooth.
Figure 1: Anatomical Diagram of a Human Hand. (Copyright Britannica Encyclopedia 2008)
http://www.britannica.com/EBchecked/media/121138/Muscles-of-the-forearm
Armband:
Although the fingers are located on the hand, the muscles that control the fingers are located on the arm as can be seen by Figure 1. Each finger is connected to the muscle by specific tendons which run from the hand and go through the wrist. We decided to place our sensors at the wrist because all the tendons from the hand must go through the wrist before they can connect to the muscles. We created an armband to keep the IR sensors firmly (but gently) pressed against the wrist so there would be no contamination of our signal from outside sources.
Principle:
Infrared light emitted is at 950 nm which penetrates the skin and is absorbed by the blood. Expansion and contraction of the muscles (and hence the tendons) pushes the blood through the capillaries faster. This quick change in the volume of blood moving through the capillaries causes a change in the reflection of the IR light, and therefore a change in the amount received by the IR receiver. This principle is reinforced by the fact that if a finger is held in a contracted state the IR receiver will detect a change but then return to its original voltage.
Measurement path:
1) The infrared emitter emits the light
2) Infrared light is partly absorbed by the blood, and partly scattered
3) The scattered infrared light is received by the photo transistors
4) The received light reduces the resistance of the phototransistor
5) This generates a voltage signal
6) Voltage signal passes through a high pass filter to remove DC
7) Filtered signal is amplified by a bandpass amplifier
8) Amplified signal is sent to the NIDAQ for processing in MATLAB
9) MATLAB processes the data and determines which finger moved
Data Analysis:
Once the data goes into the computer via the DAQ, it is analyzed by the MATLAB GUI. Before any detection occurs the user must calibrate the sensor. This involves pressing the calibrate button on the GUI and then moving each finger individually for 45 seconds. Once calibration is done the user pressure the continuous button and begins moving a finger of his choosing. The built in detection algorithm uses principal component analysis to determine which finger has been moved.
Potential Patents:
A thorough patent search was conducted and to the best of our knowledge our project does not infringe on any patents.
In our search, we could find only one paper that had followed a similar approach to measure muscle activity.
On a lighter note, we believe that we are the first ones to coin the word ‘OptoMyoGram’ - idea of sensing muscle movement with light - not enough to patent though. Our conclusion is based on a Google search of the above word with zero results.
Hardware Design and Implementation:
Previous Attempts:
We initially tried constructing the same circuit with Honeywell (Part: HLC 1395-002), which is a combined infrared transmitter and receiver pair. The device was intended as a object sensor. In our use, the device failed to output any meaningful data. We then resorted to separate infrared emitters and photo transistors.
Circuit:
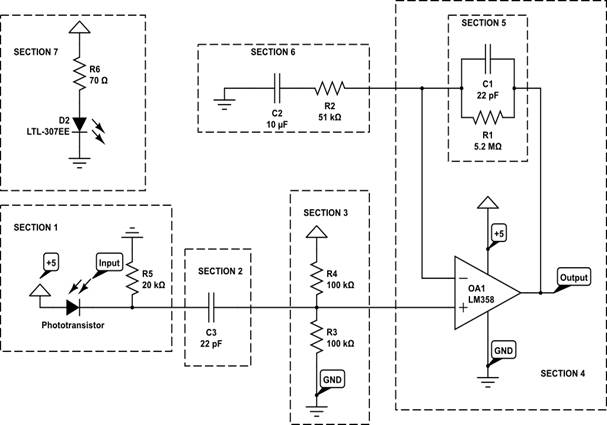
Figure 2: Circuit diagram of our setup. Note: only one IR emitter and one phototransistor, our actual setup contained one emitter and two phototransistors; the circuit for the second phototransistor is identical to the first.
Hardware for this setup consists of the following parts:
Phototransistor (Section 1)
The photo-transistor used in our setup was LTE 4206E. A phototransistor increases its conductivity on receiving light – infrared light in our case. The increase in conductivity is directly proportional to the amount of light incident on the transistor. We used this principle to detect muscle movement, since the amount of light incident on the photo transistor can be linked to the position of the tendon which correlates to the position of the muscle. This receiver has a good sensitivity at 940 nm. The phototransistor was biased with a 20kΩ resistor to the ground to obtain a signal.
Filter (Section 2)
The signal from the phototransistor was passed through a 22pF capacitor to remove the DC component of the input signal.
Level Shifter (Section 3)
A level shifter, constructed using two 100kΩ resistors (between +5 and GND) is used to shift the signal into completely positive scale.
Band pass Amplifier (Section 4-6)
This signal was then amplified using an amplifier (LM358) with a bandpass filter. Using the bandpass filter from the Muscle Music Control project as our starting point, we experimentally arrived at a bandpass between 31 and 1392 Hz. To create these cutoff frequencies we used a 5.2 MΩ and a capacitor of 22 pF for the lowpass filter. For the highpass filter we used a 10uF capacitor and 51kΩ resistor.
Infrared LED (Section 7)
We used LTE-4208 IR LED, which was powered by a 5V power supply limited using a 70Ω resistor. This was essential to ensure sufficient penetration depth for the IR beam. As mentioned earlier, the LED emits IR at 950 nm. Before arriving at 70Ω, we experimented with a range of values between 1000 and 330Ω. After experimentation we concluded that the LED needs to be as bright as possible.
National Instruments Data Acquisition Box:
The amplified signal (corresponding to a signal of 0-5V) was fed into the NIDAQ for further processing. Having an array of sensors surrounding the arm – enabled tracking of the muscle movements.
We also utilized an Agilent power source (E3630A), Tektronix oscilloscope (TDS 1012B), BK PRECISION signal generator (4040A) as a part of the standard laboratory equipment available in our lab.
Sensor Moldings:
We designed and 3D printed plastics to fit our requirement of making the band. The band was designed as links in a chain rather than a complete circle. Emphasis was laid on using smaller pieces that come together to form a bracelet to ensure a better fit with the skin surface.
Our original design included one emitter and 4 receivers in every link of the chain – we found this setup to be difficult to handle – since inputs from each link would result in a lot of wires to capture the received signal, and the additional channels did not offer any significant benefit.
Our final design includes more ergonomically designed links along with one emitter and two receivers per link, this, we believe is a good balance between signal and the required resolution. The links were held together using an elastic band. Below in Figure 3 is an image of one of our sensors. In the center is the LED emitter and at each corner is a IR receiver.
We 3D printed the design on PLA material using MakerBot 2. The services were provided to us at no cost.
Figure 4: Sensor 3D design - angled bottom view
Figure 5: Sensor 3D design
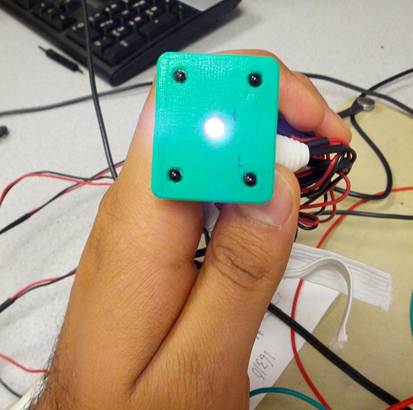
Figure 6: Bottom surface of the receiver, showing a glowing LED, and four phototransistors.
For our final result, we used only two which provided sufficient accuracy.
CONSTRUCTION:
Construction of the sensing setup was carried out in phases.
Phase 1: Breadboard setup of the circuit
We first constructed the circuit on a breadboard, but because wires were easily pulled out of the circuit and delays in debugging a circuit simply due to a loose wire, we decided to make the circuit again.
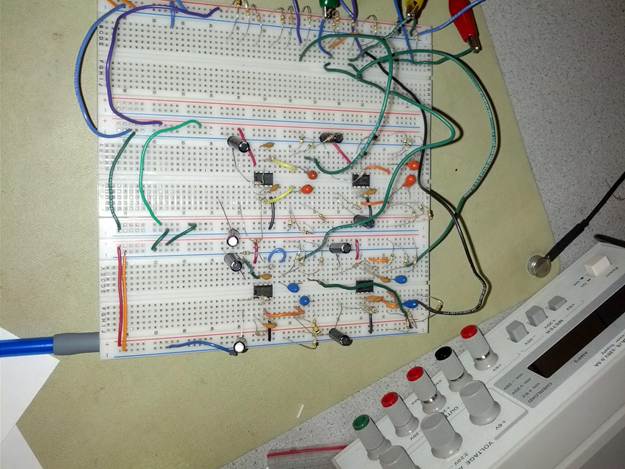
Figure 7: Breadboard circuit
Phase 2: Transfer of the breadboard circuit onto PCB board
In the second phase we transferred the circuit onto a PCB prototyping board; this drastically reduced the errors in the circuit - primarily caused due to loose wires.
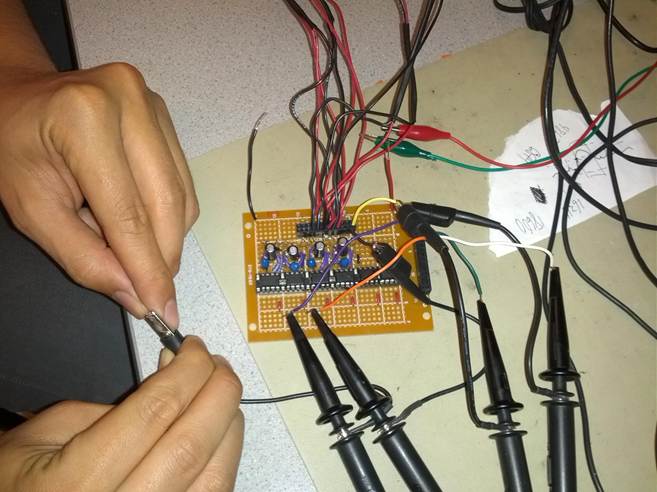
Figure 8: Final soldered circuit
Phase 3: Assembly of final IR sensor module
This stage involved assembly of the final IR sensor module with IR emitters and phototransistors over using the same setup in foam (picture not available). We hot glued the LEDs in, soldered wires on to them and shrink wrapped the cable connections to prevent any shorts and ensure robustness.
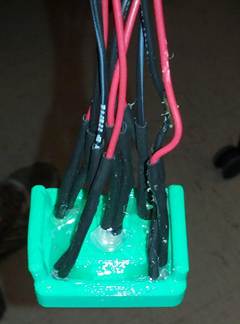
Figure 9: Final IR sensor module
Hardware Utilized per Filter (Single Channel)
|
Part Number |
Hardware Part |
Manufacturer |
Part Number |
Quantity |
Price |
|
1 |
Infrared Emitter |
LiteON |
LTE-4208 |
1 |
Free - ECE Lab |
|
2 |
Phototransistor |
LiteON |
LTE-4206E |
1 |
Free - ECE Lab |
|
3 |
Operational Amplifier |
Fairchild Semiconductor |
LM-358AN |
1 |
Free - ECE Lab |
|
4 |
Capacitor (Electrolytic) |
Unknown |
10uF |
1 |
Free - ECE Lab |
|
5 |
Capacitor (Ceramic) |
Unknown |
22pF |
1 |
Free - ECE Lab |
|
6 |
Capacitor (Ceramic) |
Unknown |
22pF |
1 |
Free - ECE Lab |
|
7 |
Resistor |
Unknown |
51kΩ |
1 |
Free - ECE Lab |
|
8 |
Resistor |
Unknown |
5.2MΩ |
1 |
Free - ECE Lab |
|
9 |
Resistor |
Unknown |
100kΩ |
2 |
Free - ECE Lab |
|
10 |
Resistor |
Unknown |
20kΩ |
1 |
Free - ECE Lab |
Software Design and Testing
The software portion of this lab was completed entirely in MATLAB and can be broken down into three main sections: the GUI, calibration and the detection algorithm. While all three functionalities were codependent in the operation of this lab, the sections are discussed separately here. The overarching goal of this MATLAB code is to create a GUI that allows the user to calibrate the sensor to himself, display the sensor data on the computer and determine which finger is the user is moving.
Design
Principal Coordinate Analysis Theory and Application
The technique called principal coordinate analysis (PCA) is used to characterize which movement was performed from a collect data set. Principal coordinate analysis is one of the easier potential qualifiers and proved to be work well. In analyzing a pair of sensors that are recording the same event (in our case, a finger movement) there should be some correlation between the two sensors/data sets. If the sensors were perfect and ideal, the correlation would be 1:1 where the two sensors mirror one another perfectly.
However, with the IR sensors in different positions on the arm, each sensor measures a different muscle or tendon movement and should capture the event in a unique fashion. Now, imagine plotting one sensor against another to graphically visualize the correlation between the two (in a two dimensional space determined from the two sensors). All of the data of the two identical sensors would lie along the line with slope of one that passes through the origin, perfectly mapping one sensor onto the other.
In the other case, the will be some correlation between the two data sets. If the two sensors are linear functions of one another, the points will tend to lie along a preferential plane. In a simplified description of PCA, the principal coordinate is that rotated coordinate frame (defined by x’ and y’, where x’ lies along the preferred axis and y’ is perpendicular) through which most of the data passes through. Through PCA, a rotation matrix is determined (and is accomplished by the built-in MATLAB function princomp) which maps/rotates the ordered pair of the two sensor data sets onto a new coordinate frame in which the majority of the points lie along the new x-axis (x’).
Therefore, points that deviate from the x’ axis, have a non-zero y’ coordinates. This is how new data is classified; in our application of PCA, the incoming data is rotated by the determined rotation matrix and the variance between the new points and the preferred axis is determined. We decided to look at the standard deviation from the set of ordered sensor pairs to the x’ axis. Data that is very similar to the original set off data from which the principal coordinates were determined would have a small associated standard deviation.
With three sensors, the principal coordinate is a plane in 3-space. Once a data set is rotated to the principal coordinate, the majority of the points should lie within the x’-y’ plane with deviations into the z’ direction; therefore, the “quality” of the fit is determined by the standard deviation in the z’ direction. This method of analysis generalizes to higher n dimensional states with even more redundant sensors/data sets. An n dimensional principal coordinate is a hyperplane in the n-1 dimension that minimizes the distance between it and all points (usually done by a moment of inertia calculation). Again, the majority of the points should lie within the hyperplane, deviations are measured from the nth coordinate.
High dimensions theoretically contain more information and should have a higher confidence whether or not a data set belongs to that principal coordinate. For the OptoMyoGram, we used 4 sensors (more were planned, but were removed for simplicity). The fourth dimensional principal coordinate for each movement is recorded and used to transform new data into the principal coordinates. Like before, we determine the variance in the fourth principal coordinate for each principal coordinate corresponding to each of the pre-”learned” gestures. The movement associated with the principal coordinate with the smallest variances was determined to be the “correct” classified movement.
GUI
The majority of the GUI code was adapted from our Lab 4 code. This GUI has the following 5 buttons: Capture, Continuous, Save, Quit and Calib. The capture function allows the user to collect data from the NIDAQ and display it on the GUI’s graph. Data can be collected for either 1, 2, 5 or 10 minutes depending on which value is selected in the drop down menu. When the continuous button is pressed the GUI displays the data captured from the NIDAQ in real time. The displayed data is the mean subtracted voltage of each of the four phototransistors which slowly scrolls across the screen. As with the capture function, the timebase for continuous data acquisition can be change from 1, 2, 5 or 10 seconds (note the implicit change of units) depending on which value is selected in the drop down menu.
In addition to plotting the data from the sensor, if the user moves one of his fingers during continuous mode the detection algorithm will display which finger the user has moved. For this to work the user must move the same finger for 7 - 15 seconds before the detection algorithm can accurately determine which finger has been moved. The save button allows the user to save the raw data as a text file and a jpeg of the current graph on the GUI. The quit button is used to quit the GUI when the user is finished. Before continuous mode can be accessed the user must first calibrate the sensor to himself. Calibration is necessary because the detection algorithm is sensitive to both the location of the sensors on the arm and size of the arm.
Implementation of the calibration function and the detection algorithm are discussed in the following sections. Upon closing and restarting the GUI, the calibration data is saved and automatically reused in case the user accidentally closed the program or changed an internal parameter and subsequently reopens the GUI.
Calibration
Calibrating the sensors for each movement is relatively straightforward and easy. Calibration can be activated at any time by clicking the Calib button in the upper right hand corner. When the calibration protocol is activated, the GUI prompts users to move a specified finger for 45 seconds. We empirically found that 45 seconds is the lower bound on the amount of data needed to accurately “teach” the detection program. For each specified finger, all four sets of sensor data are collected. The fourth dimensional principal coordinates were determined and stored for each of the movements. While the GUI prompts the user to move his or her pointer finger for 45 seconds, the user does not need to adhere to this protocol. If there is another motion that the user prefers, the user can repetitively perform that movement for a given prompt. For example, if the “rock on” pose was made instead of moving the ring finger, every time the user made the “rock on” pose, the GUI would display “Ring.” By making the calibration process automated and fully flexible, the user has full freedom to choose any 5 gestures (albeit with a potential label misnomer).
Detection Algorithm
Once the GUI has collected 5 seconds worth of data of the user moving one finger, the data is analyzed by the detection algorithm. The detection algorithm can be summarized by the following 3 steps;
1. Multiple the data by each of the 6 transformation matrices to create 6 data sets
2. Compute the standard deviation from the 4th principal axis of each data set
3. Determine which data set has the smallest standard deviation
In the first step, the mean subtracted data is multiplied by each of the 6 transformation matrices created during calibration. This step creates 6 separate data sets in which the data from all 4 sensors has been converted into a coordinate system defined by the principal axis of that particular finger. For example, the first transformation matrix is for the pointer finger.
When the data is multiplied by the pointer transformation matrix, the data is converted into another data set whose basis are the principal axis of the finger transformation matrix. Once step one is done there will be 6 separate data sets which correspond to the 6 different possible movements; Pointer, Middle, Ring, Pinky, Thumb and No Movement. Each of these data sets will be N by 4 matrices where N is the number of data points and the columns correspond to one of the 4 principal axis. Next, in step two, the algorithm computes the standard deviation of the data points from the 4th principal axis of each rotated data set. In the last step the algorithm determines which data set has the smallest 4th principal axis standard deviation.
We found that the determined mode often “flickered” among two or several values if only the latest “chunk” of the data (set to .25 seconds to free up the GUI and simulate real-time graphing/processing) was analyzed. Instead, heuristics were added and the last 15 seconds of guessed finger movements were kept. If a particular finger was detected more than half of the ten seconds, the finger indicator is updated to display the detected movement.
Challenges:
In essence we faced two major challenges during the development of our system:
Controlling artifacts due to the movement of the skin:
If the armband’s physical position moves during the measurement of the data, this causes a change in the signal that can be easily confused with the movement of the muscle.
The first step in controlling this artifact is to ensure that the infrared receiver stays stationary with respect to skin. Primarily, this issue was resolved by the strap we created to wrap the sensors around the arm.
The second step was to account for excessively large signals (as generated due to the movement of the sensor over the arm) and ignore those signals.
Amplifying the IR signals:
The IR signals are received by the phototransistor and result in a voltage change in its output. This output change is of the order of 50 mV, this is then fed through an operational amplifier to amplify the signal input to 5 V range so that it can be detected by the NIDAQ.
The challenge arises is amplifying the signal and the not the noise, for this purpose, we employ a capacitor before amplification to filter the DC. The amplification itself is band passed to ensure no noise was amplified.
Differentiating between signals of different fingers:
If we place a transmitter receiver pair on the arm and measure signals received, we normally get a signal for every muscle moved. To resolve this, we placed multiple sensors around the arm. In principle, the sensor placed directly above a muscle should produce the strongest signal. This only helped to a certain extent. Major progress in this area was reached by
Testing:
Testing for this project was carried out in several phases:
A: Testing the infrared muscle detection principle:
We first constructed a simple IR (infrared) emitter and phototransistor pair using black foam. We observed the signal output of the phototransistor on the oscilloscope this was used to test our signal amplification principle. We tinkered with the resistances to alter the filters and amplification to obtain ideal values before moving on the finalizing the values onto the soldered board.
We observed that increasing the gain excessively made the sensor act like a plethysmograph rather than a muscle movement sensor. Hence the gain had to be kept under check to correct for this problem.
Another issue that we observed was that if we altered the value of the resistor in the low pass filters without altering the capacitor, it would stop all signal from appearing, indicating that the frequency band that was being amplified and output was shifting out of the range of the filter. To ensure proper operation and low noise, we had to change both the resistor as well as the capacitor.
B: Testing Amplification Circuit:
We fed the output of our circuit, to the circuit made in the ‘Move your Music’ and adjusted the Low Pass filter capacitor value and resistance value from 10KΩ to 5.2MΩ to change the low pass filter limit.
This circuit was supplied a signal from the signal generator to check the output. The output was measured using an oscilloscope and compared to the original signal to test its functionality.
We expected the circuit to amplify the signal from microvolt levels to early voltage levels, we changed the filter values till we obtained the proper setup.
C: Testing MATLAB detection algorithm:
Most of the GUI plotting code used was brought over from our class laboratory setups. We modified the code to enable display of multiple channels. However, besides adding additional DAQ channels, the plotting and capturing code was left unchanged. The calibration protocol, described above, was added and is triggered with the “Calib” button.
Once calibration has been completed, a cell array storing all set of the principal coordinate coefficients are stored in the program. From here, the user can select one of two modes: Capture and Continuous. Capture is completed by simply triggering the DAQ and plotting the collected data - a feature that has been long implemented in previous labs.
Continuous mode is where the majority of the modifications were made. First, the code was modified to capture data in .25 second segments to reduce the frequencies of the discontinuities that arise from the code overhead needed to processes and plot the incoming data. The by-product of that the plot is updated at a slower rate of roughly 4 Hz.
After each .25 second segment of data is collected, two vectors storing the previous 15 seconds of data are shifted and appended with the new data (and in the process removing .25 seconds, always keeping 15 seconds of data). One of those vectors stores the raw data to be used in the classification algorithm; the other stores the data with the mean removed and scaled to a 0-1 scale for display purposes.
Following each data collection period, the entire previous 15 seconds were to transformed with the five transformation matrices. The standard deviation was calculated of the fourth dimension residual. The finger corresponding to the lowest standard deviation was considered the “best fit.” Originally, we looked at pairs of phototransistors, making the principal component two-dimensional with a 2x2 coefficient matrix. To test this method, we ran through all combinations of fingers and performed the principal coordinate transformation on each. Using this method, our categorization method only guessed the correct finger 75% of the time. Instead of breaking up the photodiodes into the pairs, we took all four sensors as a set, and inherently retaining more information (through the interplay of four data sets, instead of two). With a four dimensional data set and principal coordinate analysis, the algorithm was accurate over 95% of the time (on the best, clearest fingers).
Below are two plots of the two dimensional PCA. Because the fourth dimensional PCA lies in the fourth dimension, it cannot be easily depicted and included in the report.
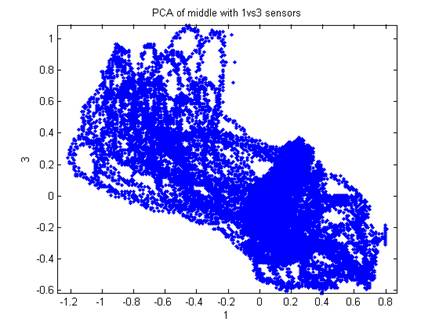
Figure 10: Sensor combination with a low/noisy correspondence between the two sensors, resulting in a large second dimension residual.
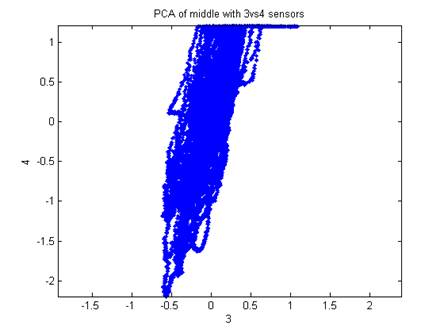
Figure 11: Sensor combination displaying a strong correlation between readings, resulting in a small second dimension residual.
Heuristics was employed here and the last 15 seconds of the lowest standard deviations are stored. If a single finger was guessed more than half of the time, then it is displayed on the GUI. Before we implemented heuristics, the categorization algorithm tended to “flicker” between two guessed fingers if the captured data contained components close to both data sets. Adding the heuristics quickly fixed that problem, but it forces the used to perform a single action for at least 7.5 seconds before any acknowledgement is given.
D: Testing for Heart Rate Noise on PCA:
When our hands our not moving the IR sensors act as a plethysmographs and record the user’s heartbeat. Initially we were concerned that the noise generated from detecting the heart beat would interfere with the PCA algorithm. To remove this noise we placed one sensor on the user’s left arm and one on the right arm. The user would move the fingers on his left arm while keeping his right arm still. This way the heartbeat data generated from the right arm could be subtracted out from the left arm data before PCA was done. During testing we compared the results of PCA from both the heart rate subtracted data and the original data. We were surprised to find that there was almost no difference in the results. The principal components from both data sets were almost identical. We believe that the heart rate data does significantly affect PCA because it is a constant source of noise in all the sensors. Since it is constant no matter what happens, PCA ignores it because the data does not help in determining which finger is moved.
Results:
Interference:
We do not expect our project to cause interference in anyone else’s designs, since the infrared light being emitted is localized and mostly enters the human skin. On the contrary, if operated in regions where direct sunlight is present, the sunlight may cause the readings of the phototransistor to change, although we did not test that.
Usability:
This device is intended to be used by humans in between the ages of 18 and 60. For humans above or below that age another human who is familiar with the device must be present to assist. Those suffering from osteoporosis or arthritis should not use this device because it may cause injury.
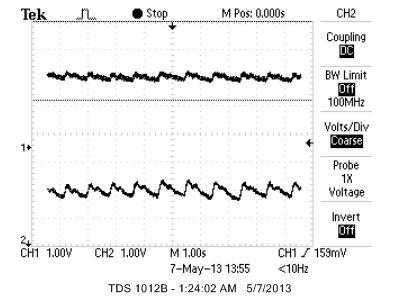
Figure 12: Oscilloscope screenshot of the user not moving his hand.
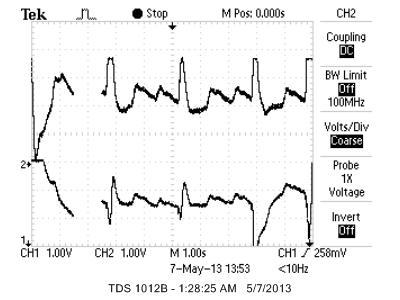
Figure 13: Oscilloscope screenshot of the user moving his pointer finger.
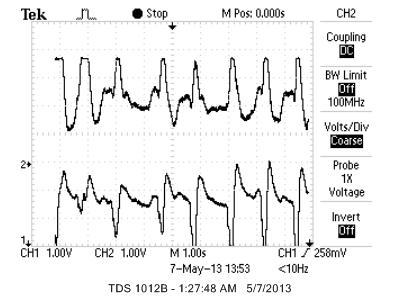
Figure14: Oscilloscope screenshot of the user moving his middle finger.
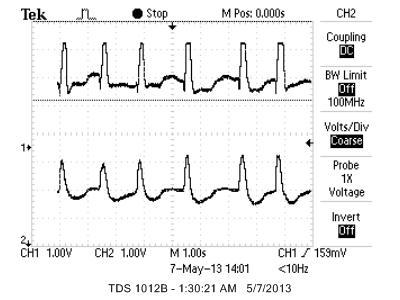
Figure 15: Oscilloscope screenshot of the user moving his pinky finger.
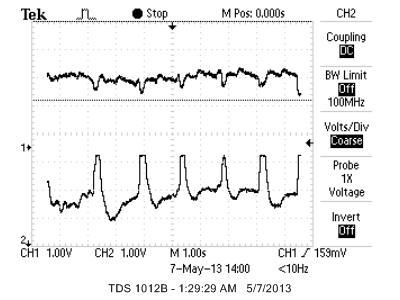
Figure 16: Oscilloscope screenshot of the user moving his ring finger.
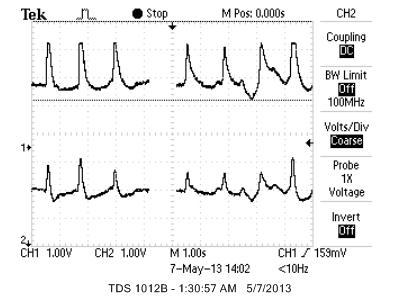
Figure 17: Oscilloscope screenshot of the user moving his thumb.
Figure 12 shows the heartbeat of the subject which was observed when the person being measured was not moving. We experimented with several positions on the arm to obtain the cleanest signal and in our experiments we found the bottom part of the wrist to give the best readings.
Figures 13 to 17 are screenshots of the oscilloscope readings from the outputs of the bandpass amplifiers. Each screenshot shows 2 channels from the sensor. In each screenshot a different finger is being move. These screenshots demonstrate that we can detect different finger movements.
Below is a screenshot of the MATLAB GUI used in this project. Each of the four waveforms is one of the 4 IR receivers in the sensor. Currently the user has already calibrated the sensor to himself and is moving his pointer finger. In the top left corner the detection algorithm has correctly identified the correct finger being moved.
Figure 18: MATLAB GUI, please note the detection of the pointer finger as shown in the upper left corner of the GUI.
Conclusion:
In conclusion, we developed a MATLAB based GUI that used PCA to determine which finger the user moved while the user was wearing several IR sensors. Although we were only able to accurately detect the pointer, middle and thumb, we believe that our system can be improved to detect not only all the fingers but hand movements too. Our current design only uses four IR receivers and two IR transmitters. In future designs we would use enough transmitters and receivers to encircle the entire arm. Having more sensors would allow us to collect more data which would give us a larger data space to make conclusions from. It would also increase the number of principal axis that we can analyze. In addition to increasing the available amount of data we would also implement a much more robust detection algorithm. Currently our detection algorithm is only using the standard deviation of the fourth principal axis. However there are many other metrics we can use in conjunction with the standard deviation such as the distance of the data from the origin. Each metric would have its own weight corresponding to how reliable it is. We could also take all the data and put it into a machine learning algorithm for analysis. Our device is merely a proof of concept showing that IR sensors can be used to accurately distinguish different hand movements. Given more time and resources this device can be made more robust and commercially viable.
Intellectual property considerations:
Code reuse
We reused our MATLAB code from Lab 3 and Lab 4 to generate the scrolling display, GUI, Capture functionality along with Stop, Save and Quit buttons.
Design reuse
We referenced our band pass amplifier design to the ECE 4760 project “Move your Music” and modified the values specific to our requirements - specifically values that described the gain of the operational amplifier.
Reverse-engineering
We did not reverse-engineer any part of any project apart from the case described above, and therefore avoid any legal implications happening from such actions.
Patent opportunities
If our project code can be moved from MATLAB to an embedded - energy efficient environment, there might be high chances of obtaining a product here.
Legal considerations
We do not see any part of our hardware requiring legal clearance.
Safety
We consider our product safe to use. Since the IR sensors are electrically isolated from the user there is no chance for the user to receive an electrical shock from the sensor. Furthermore, in the unlikely event that the emitter was pointed into someone’s eye it would not cause damage because it is a very low intensity IR signal. The IR emitter is also limited by a 70Ω resistor to prevent the intensity from becoming too high. The elastic band may impede the blood flow if it is tied on too tight or the user’s wrist is very large. Therefore, it is suggested that the user does not wear this device for more than 15 min at a time and that the user should remove the device if he feels any discomfort.
Code:
See OptoMyoGram.m for code.
Task Distribution:
We aimed to divide the tasks evenly between the team and rotated most of the responsibility.
|
Matt Fisher: - MATLAB GUI - 3D design of the sensor - Soldered final circuit - Software testing - Soldered final circuit |
Amrit Singh: - 3D design of the sensor - 3D printing of the sensor - Breadboard circuit determination - Hardware testing |
Maneesh Gupta: - Circuit determination - Sensor Construction - Hardware testing - Detection and calibration algorithm |