ECE 5030
Finger Plethysmograph
Introduction.
In this assignment you will build a plethysmograph, use the DAQ toolbox to interface to the computer, then write software to extract your heart rate from the fluctuating voltage. In addition you will build a breath monitor.
Procedure
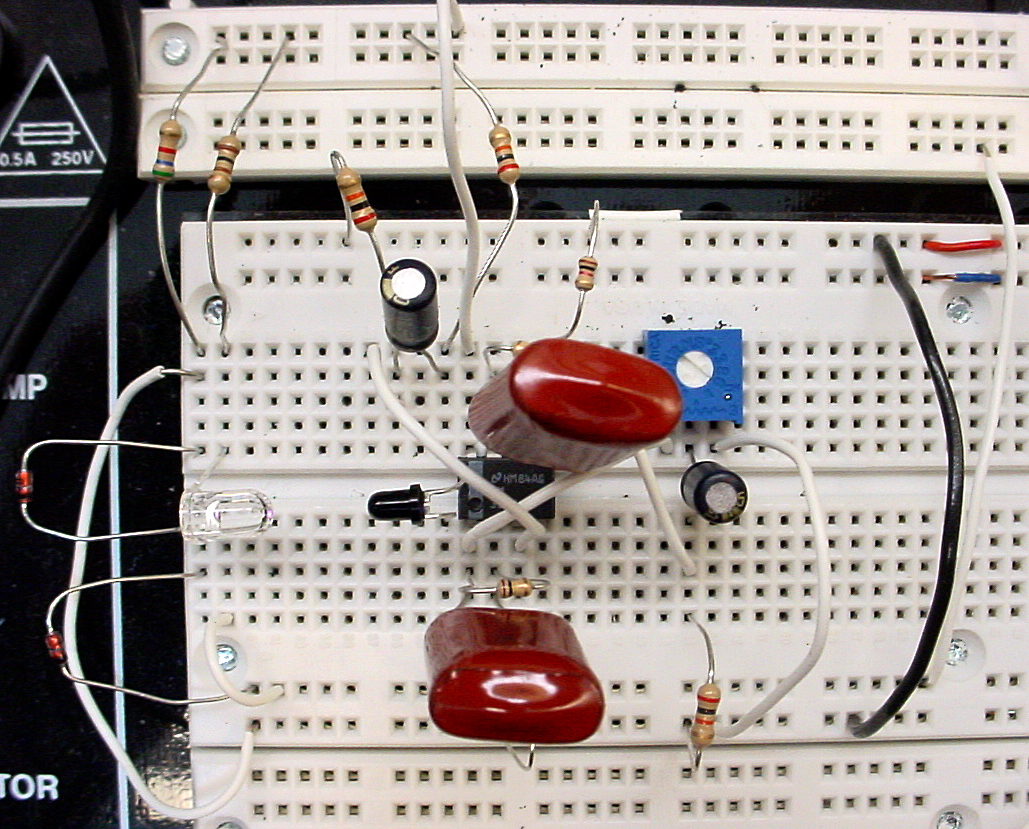
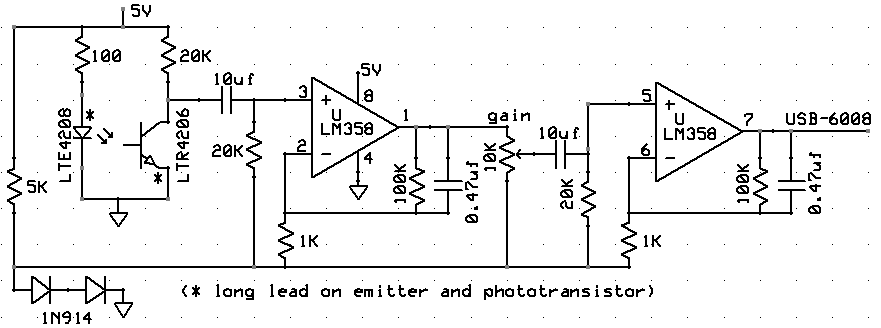
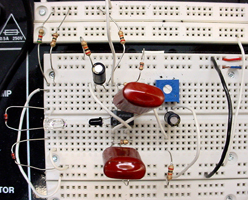
The circuit below uses a infrared emitter to shine light into your finger tip. The amount of light scattered out is related to the amount of blood flow and hence phase of the heart beat. The light scattered is measured by a phototransistor, amplified and filtered by the two opamps. You can try reflection or transillumination. I found transillumination of my thumb to give the best signal. It is important that your finger does not move relative to the phototransistor or emitter.
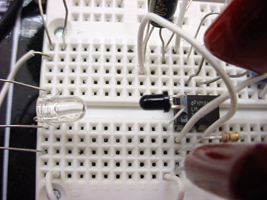
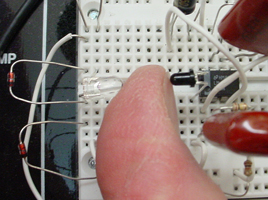
You can see a slight glow in the IR emitter (on the left) because the camera is slightly sensitive to infrared light. The Phototransistor is the black device just to the right of the thumb in the last image. The black color is caused by a filter in the plastic body of the phototransistor which blocks visible light.
A slow analog input program shows how to set up the DAQ interface for one channel, and plots the data without scrolling.
You will need to make a movie of your scrolling data. The following code (taken from the Matlab command help addframe) shows how to make an AVI file which can be played using Windows Media Player. An example AVI shows a startup transient as I put my thumb into the sensors, then several seconds of heart beat, then a transient as I removed my finger. At about 25-28 seconds into the recording, I did a gentle Valsalva maneuver which reduces heart stroke volume. You can see the reduced signal during these few seconds.
fig=figure;
set(fig,'DoubleBuffer','on');
set(gca,'xlim',[-80 80],'ylim',[-80 80],...
	'nextplot','replace','Visible','off')

aviobj = avifile('example.avi')
aviobj.compression='cinepak';
aviobj.quality=100;

x = -pi:.1:pi;
radius = 0:length(x);
for i=1:length(x)
	h = patch(sin(x)*radius(i),cos(x)*radius(i),...
			[abs(cos(x(i))) 0 0]);
	set(h,'EraseMode','xor');
	frame = getframe(gca);
	aviobj = addframe(aviobj,frame);
end

aviobj = close(aviobj);
Assignment
- Build the circuit above. You may need to adjust the gain control to get a good pulse with amplitude of a few hundred millivolts.
- Lower the high-pass filter cutoff by replacing the 20k resistors with 100k resistors. Is the signal better or worse? Why?
- Build a breathing monitor by detecting a resistance change of the force-sensitive polymer attached to a string around the chest. Do you see an effect of breathing on the waveform? Explain.
- Use the USB-6008 to connect the plethysmograph circuit and breathing monitor to your computer.
Write a matlab program to:
- Read the plethysmograph output voltage and breathing monitor about 10-30 times/second.
- Automatically determine if the plethysmograph data represents a heart beat, or is just noise. (interface example)
Make a visual indication of good data. (perhaps a red/green button on the display)
- Make a scrolling plot of voltage versus time for both channels and save a few seconds of the scrolling plot as a AVI movie file. Note that saving frames consumes a fair amount of time, so you may not want to do much realtime computation while recording the movie. In fact, you may need to slow the data acquisition down to as low as 10 samples/second while recording.
- A
Quit button should end the data acquisition and close the figure.
- Compute and display the current heart rate only if the data is valid.
Your written lab report should include the sections mentioned in the policy page, and :
- Images and video to support observations.
- The algorithm you used to detect valid heart rate data.
- Observations concerning biological effects, such as the Valsalva maneuver, breathing patterns, or other effects. This may include heart rate, pulse amplitude, pulse regularity, or other parameters.
June 2009 . Copyright Cornell university