ECE 5760 Final Project: Bruce in a Club
by Connor Archard and Noah Levy
"Sound Bite"
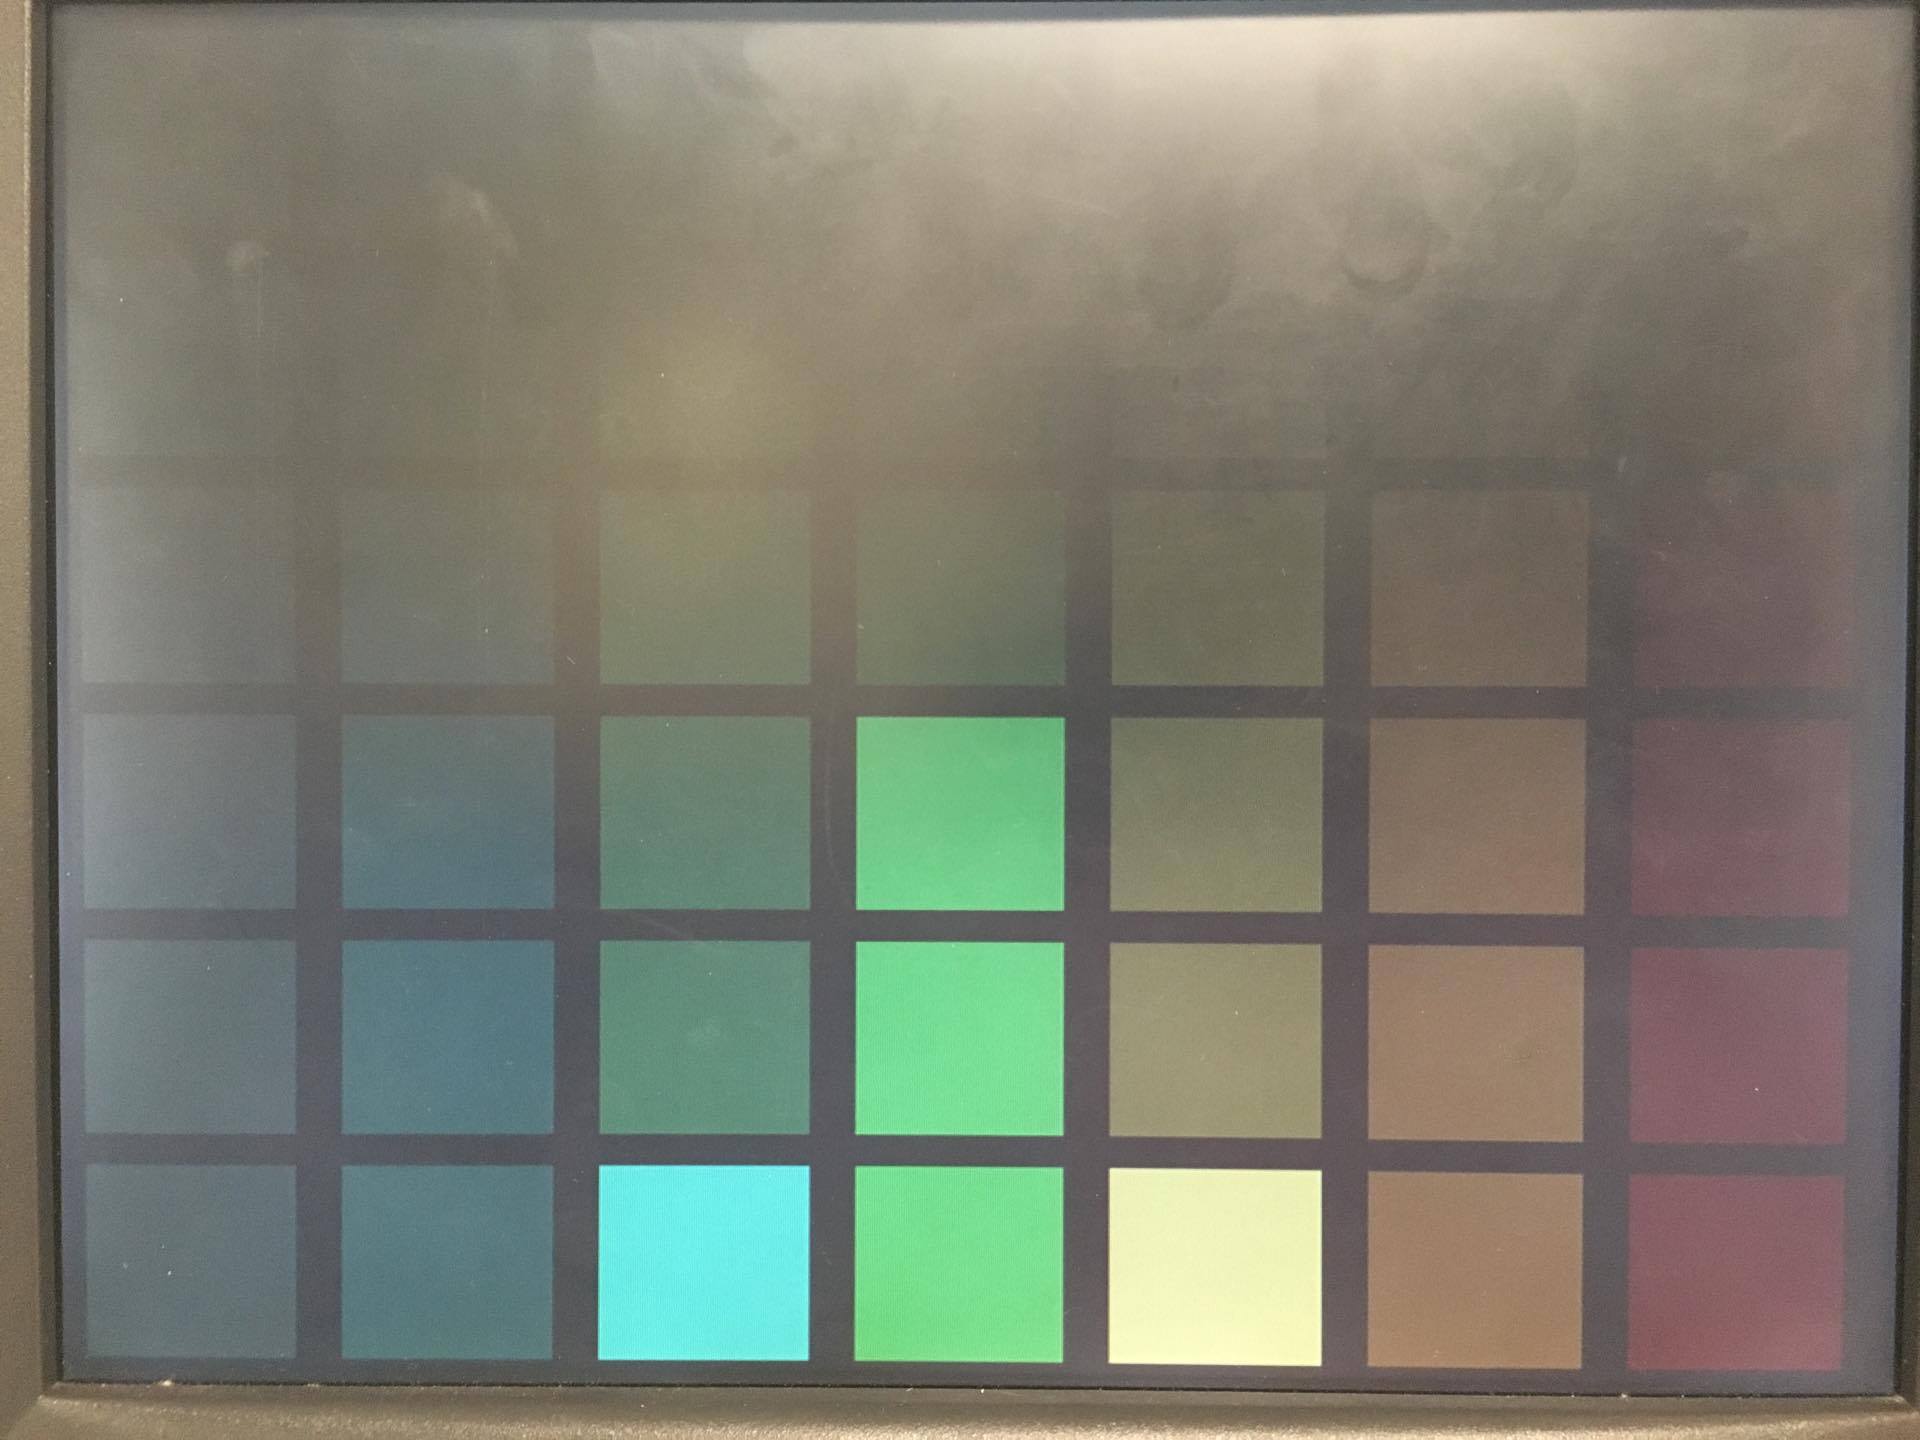
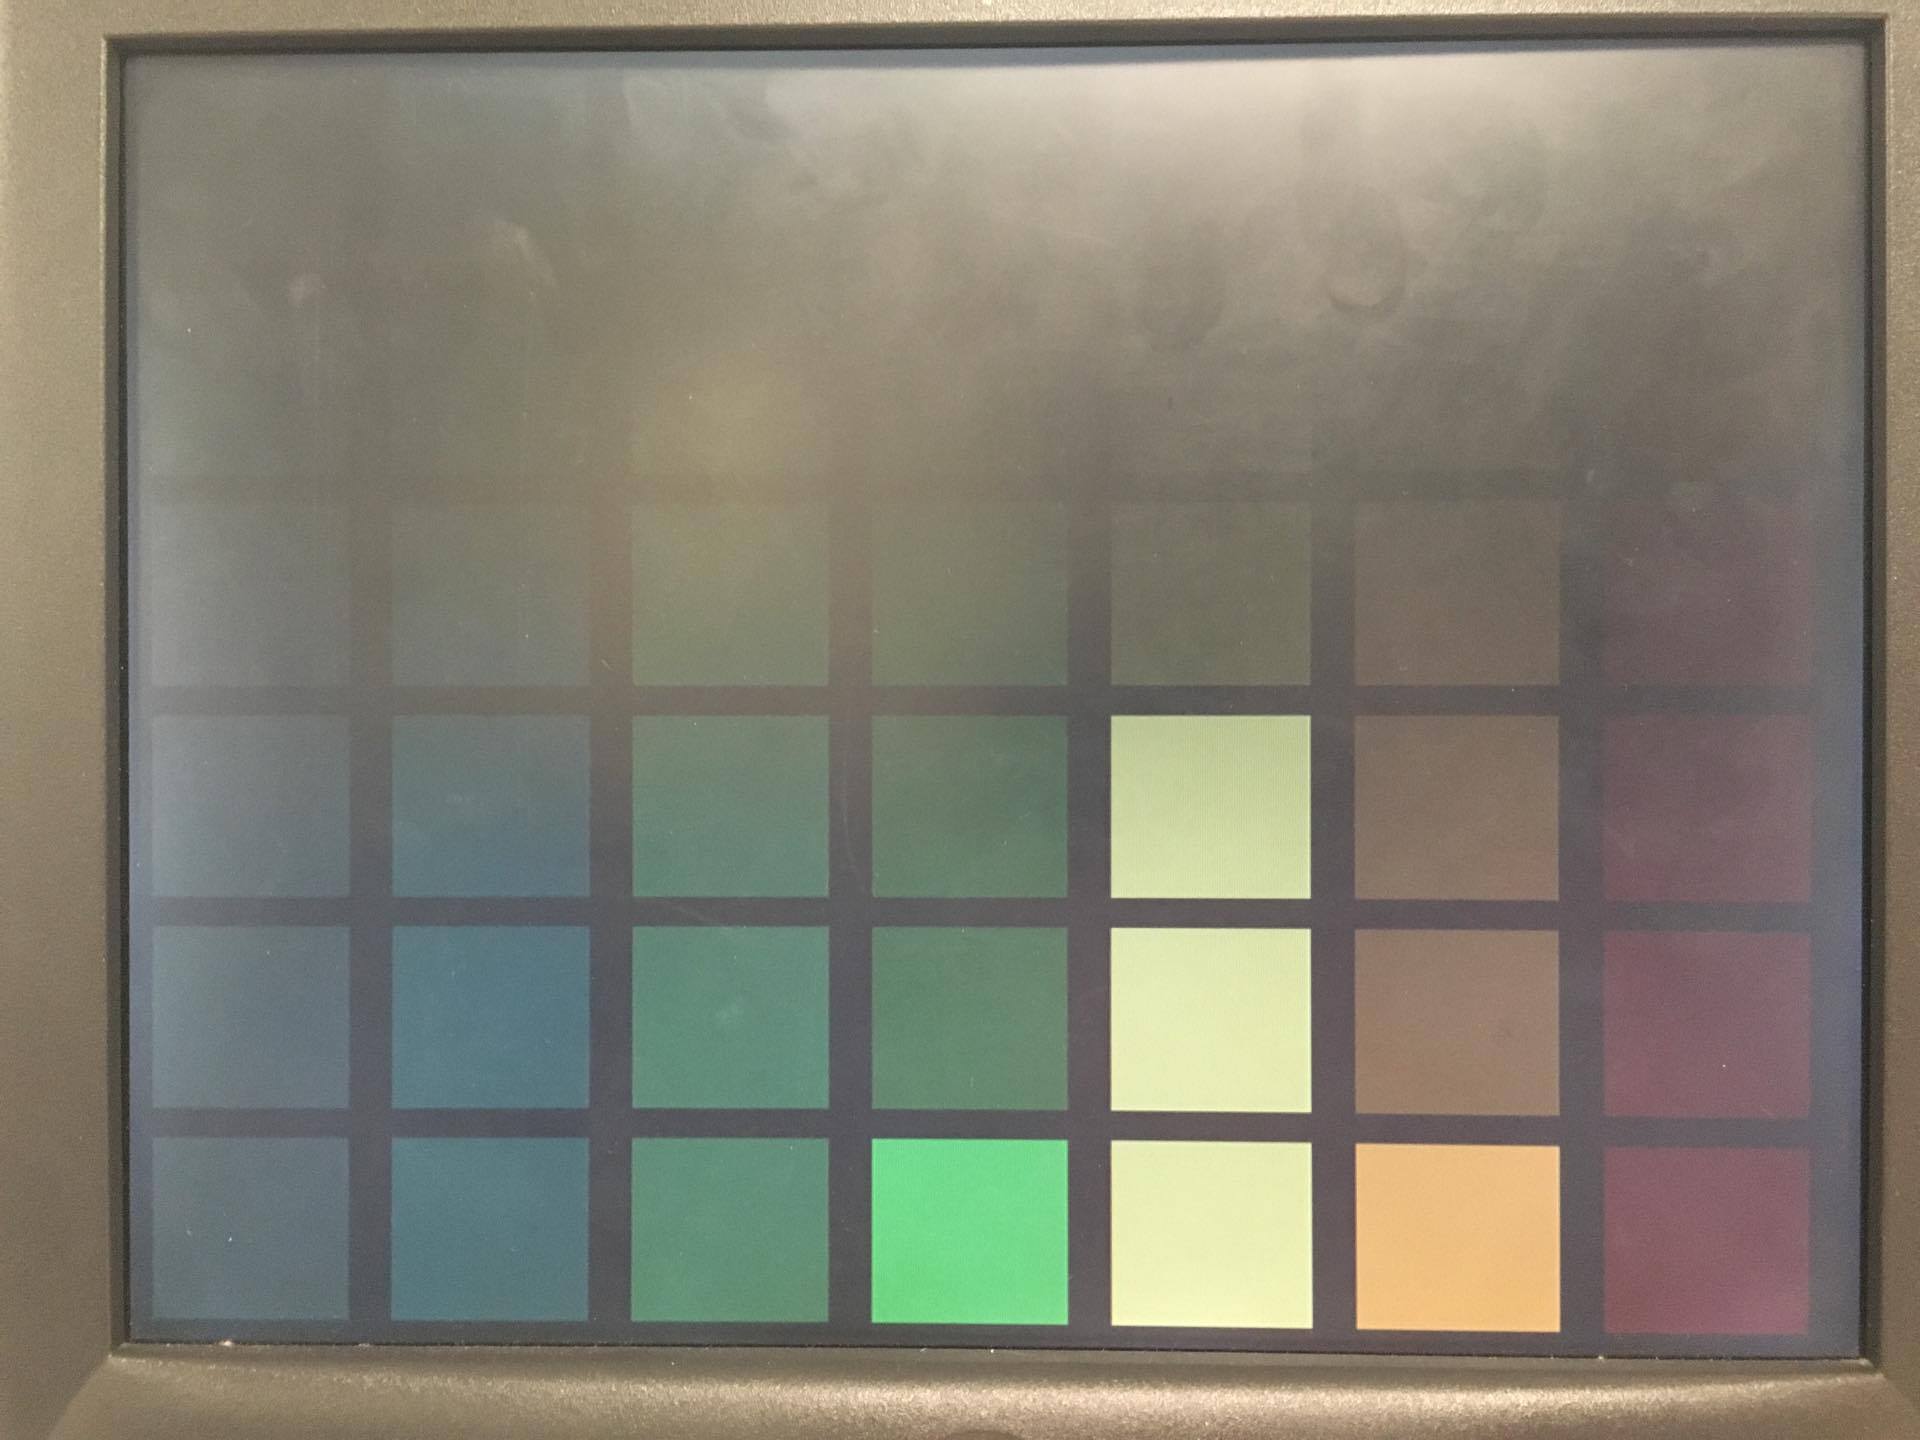
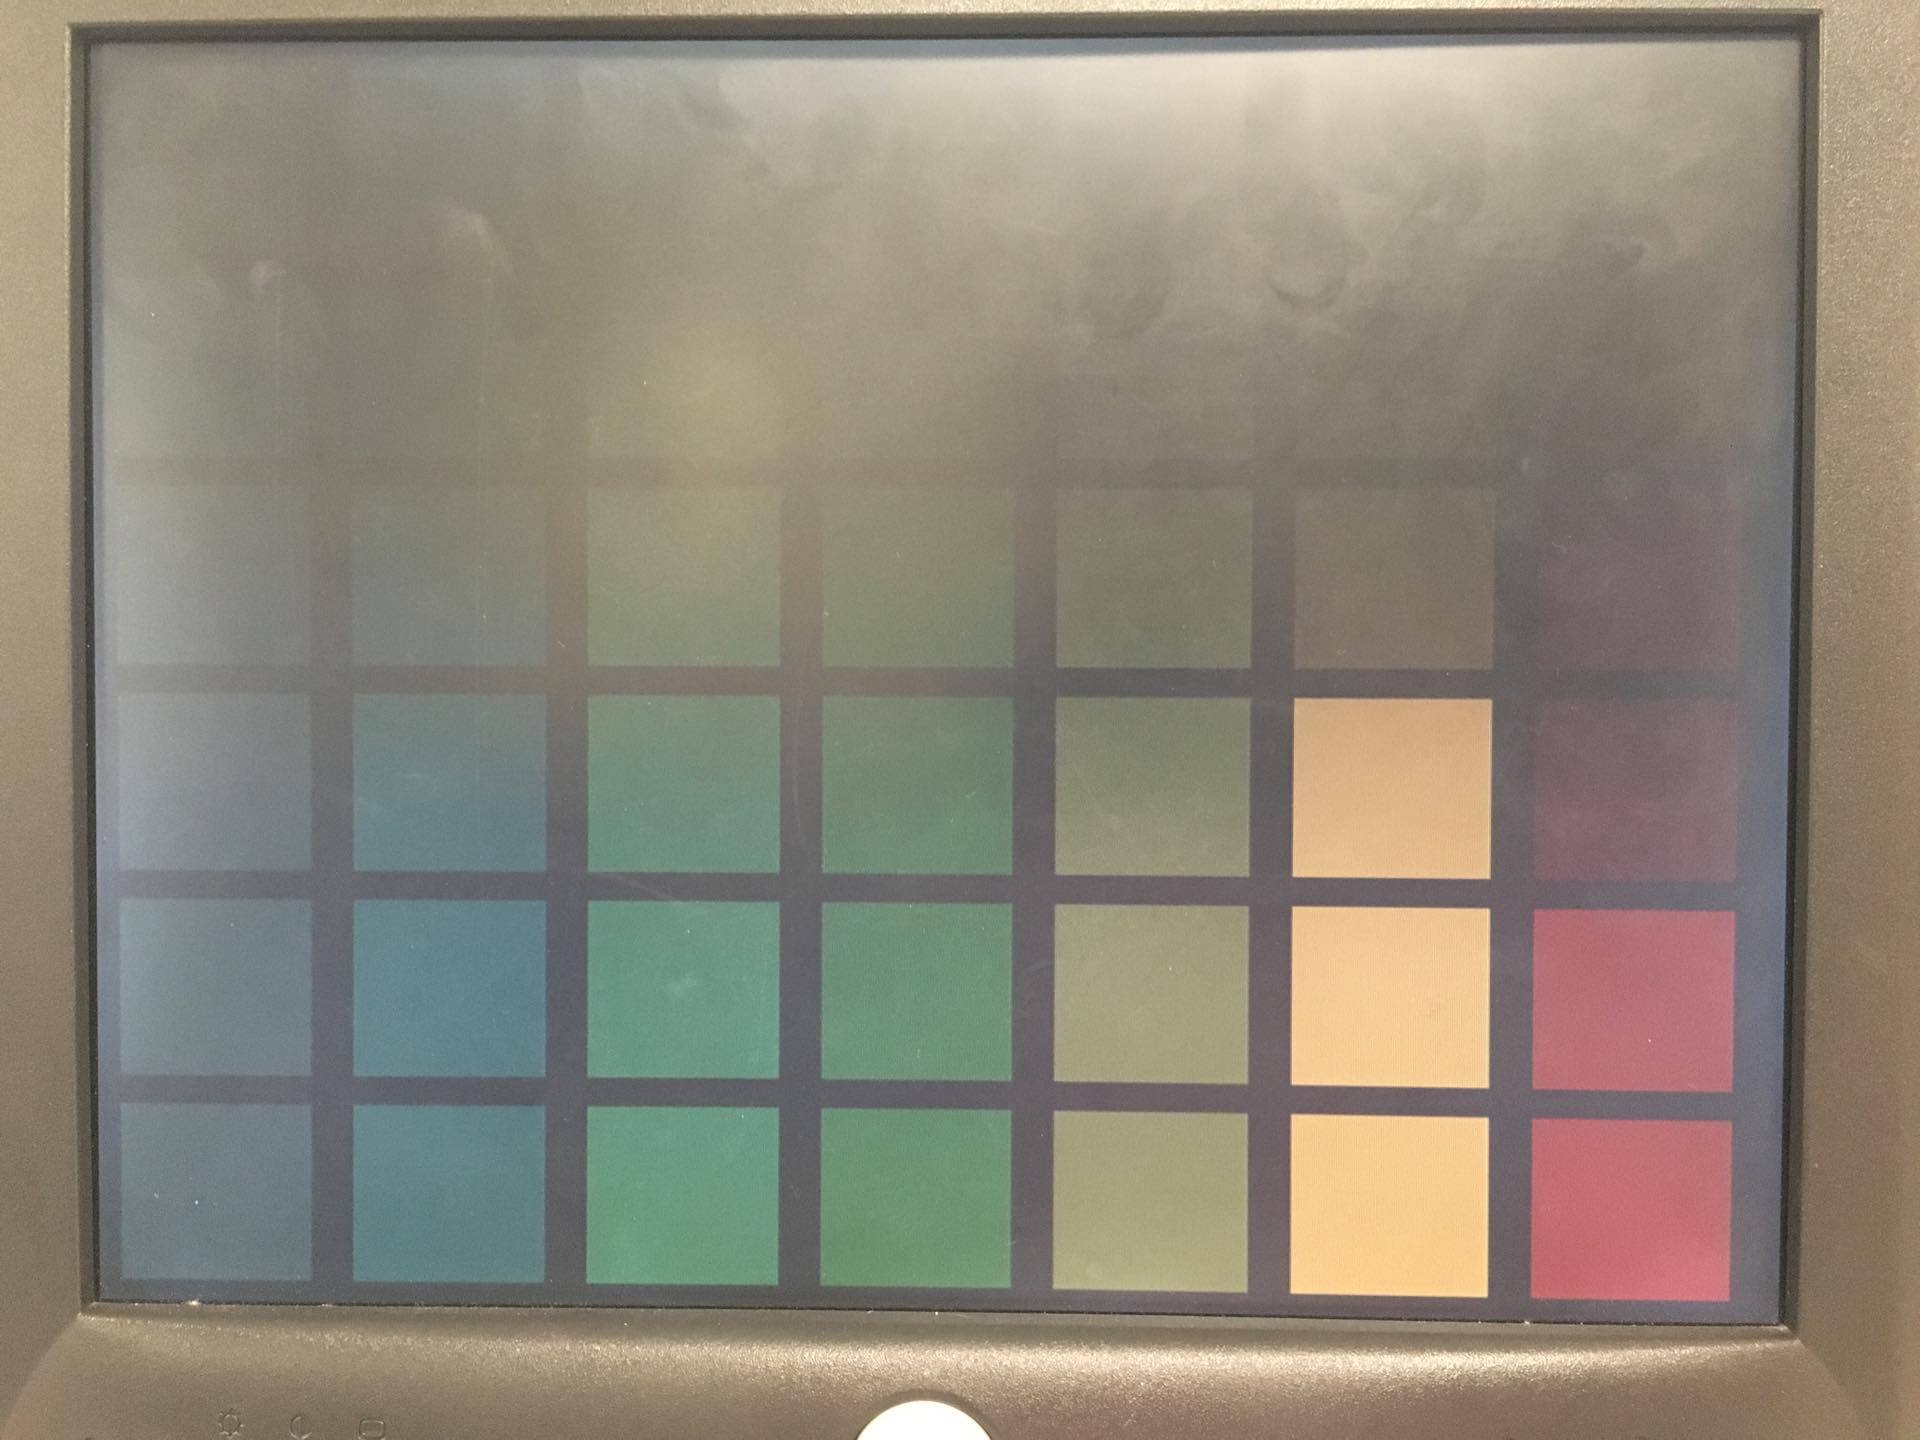
For our final project in ECE 5760, we made a music visualizer that interprets the rhythm and spectral content of a song played through the line-in on the Altera DE2-115 to create novel graphical and auditory output.
Introduction
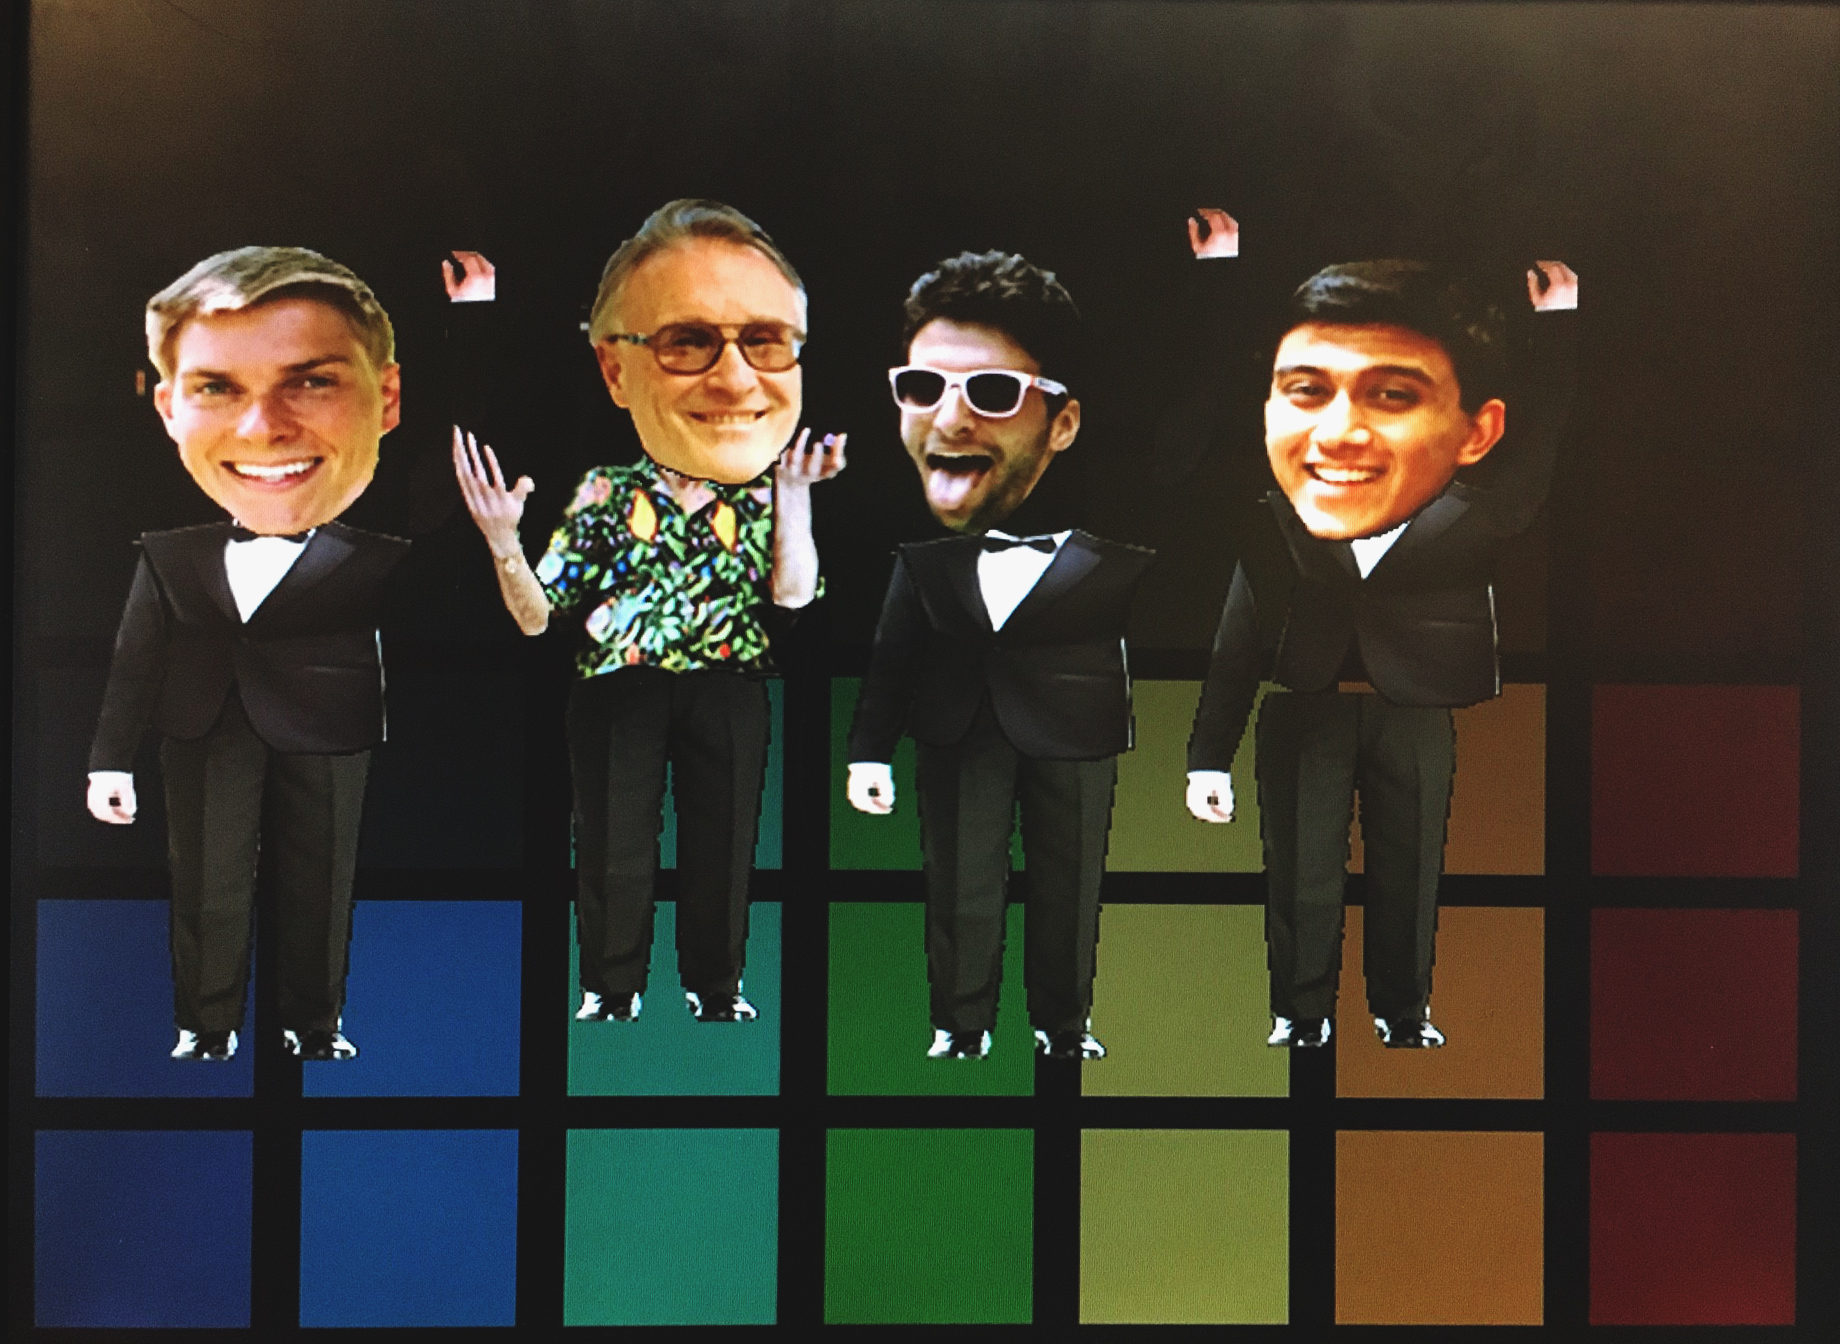
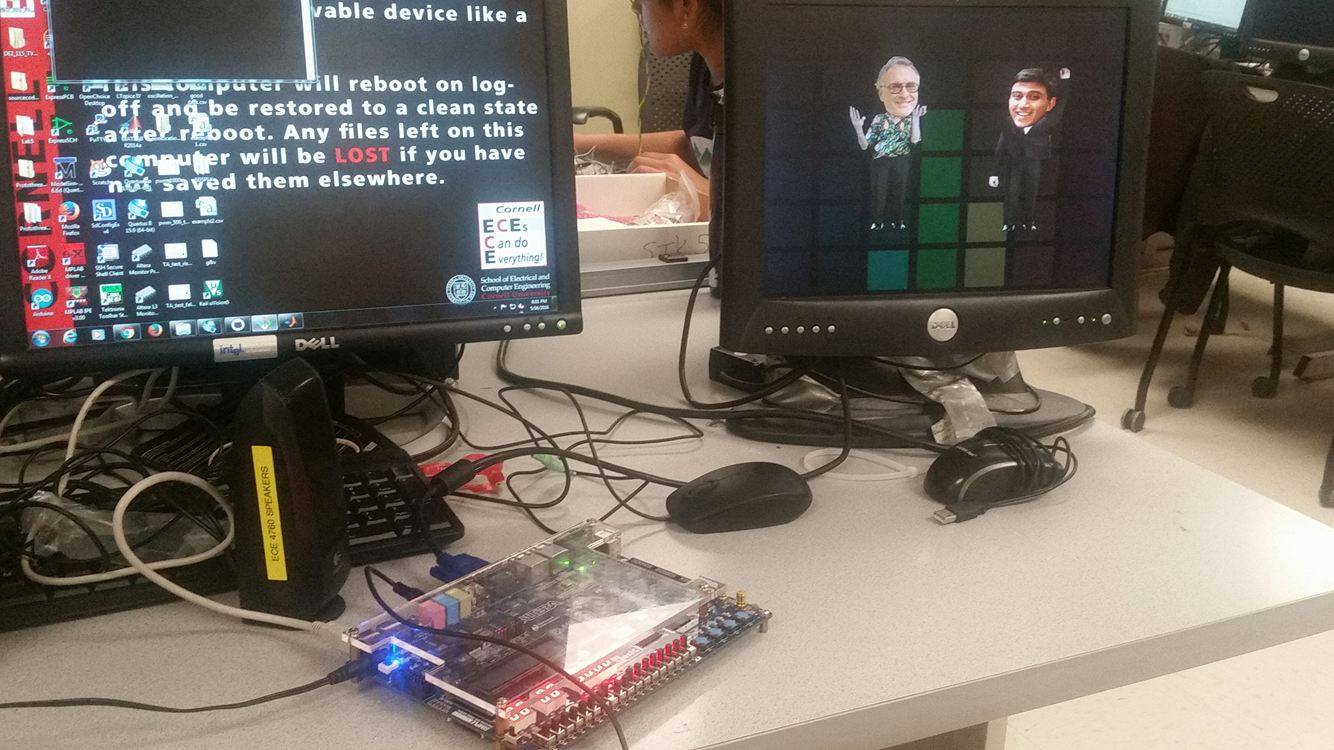
Bruce in the club reads in audio to the DE2-115 through the Wolfson Audio Codec. The output of the ADC on the audio codec is passed through a filter bank in order to analyze the spectral content of the song that is being played. A graphics module takes this information to render frames that display the spectral content of the input song to the user and to animate four dancers on the screen. When music is detected, a module will take the output of the lowest frequency filter to interpret the beat of the song and will propagate this information along to the graphics modules to control the dancers' animations. By taking advantage of parallel computing capabilities of FPGAs, the graphics module was able to track up to 64 objects on the screen at a time while tracking each object's relative depth to facilitate visual occlusion in a manner similar to the common occlusion culling technique in computer vision. This system resulted in a music visualizer that did not rely on screen buffering and would instead calculate the pixel value for each location on the screen ''in real time.'' While this might be considered computationally wasteful, it took advantage of the inherent strengths of the DE2-115 platform to elegantly do away with visual artifacts, facilitate 3D visualization, and allow for the import of arbitrary bitmaps to be displayed on the monitor.
Check out our Demo Video!
Design and Testing
RTL Design
Graphics Modules
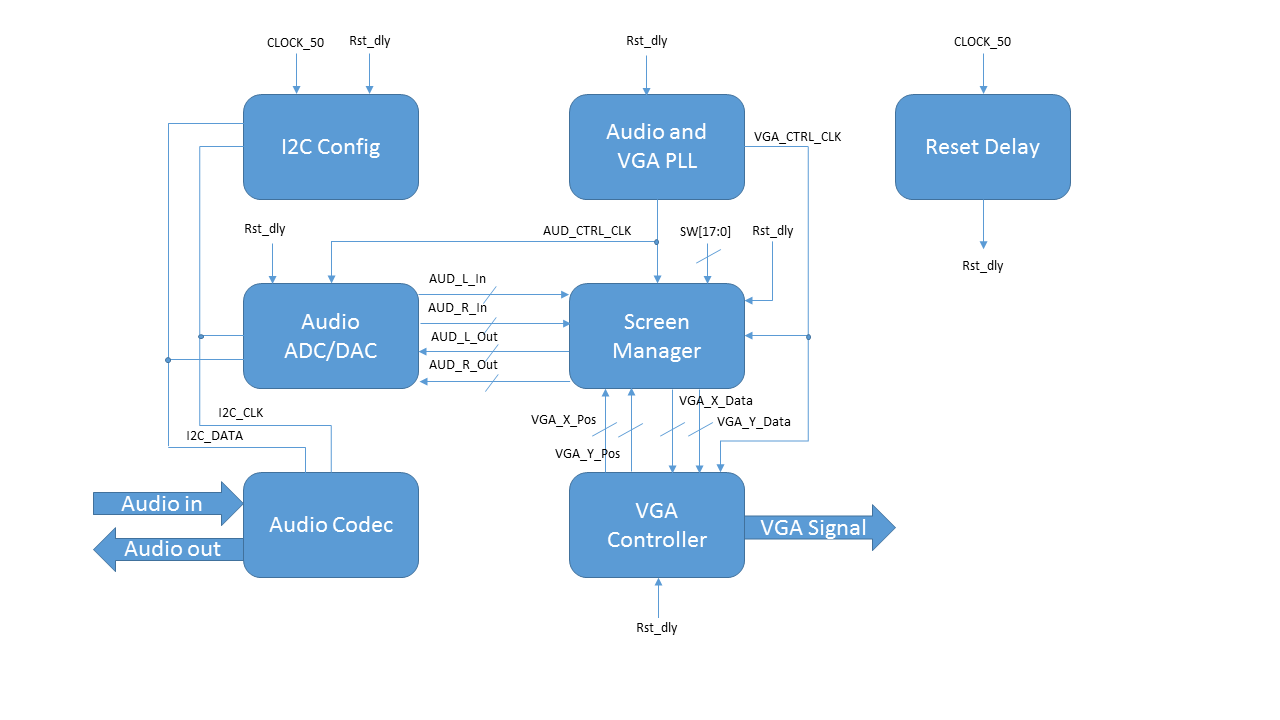
We used the hardware VGA controller that we have referenced in previous labs in order to generate the analog signal that would control the VGA monitor attached to the FPGA. As seen in the block diagrams in the gallery section below, this module will output the current VGA X, Y coordinate pair that it is trying to draw and expects three 8-bit inputs that correspond to the R, G, and B values that should be shown at that pixel. While most graphics systems rely on a screen buffer that will store the RGB value of each pixel in memory and then use the X and Y position outputs of the controller module to address into the memory, we decided to take advantage of the parallel computing abilities of the FPGA to implement a graphics module that could provide occlusion culling to enable us to animate the dancers in a three-dimensional space.
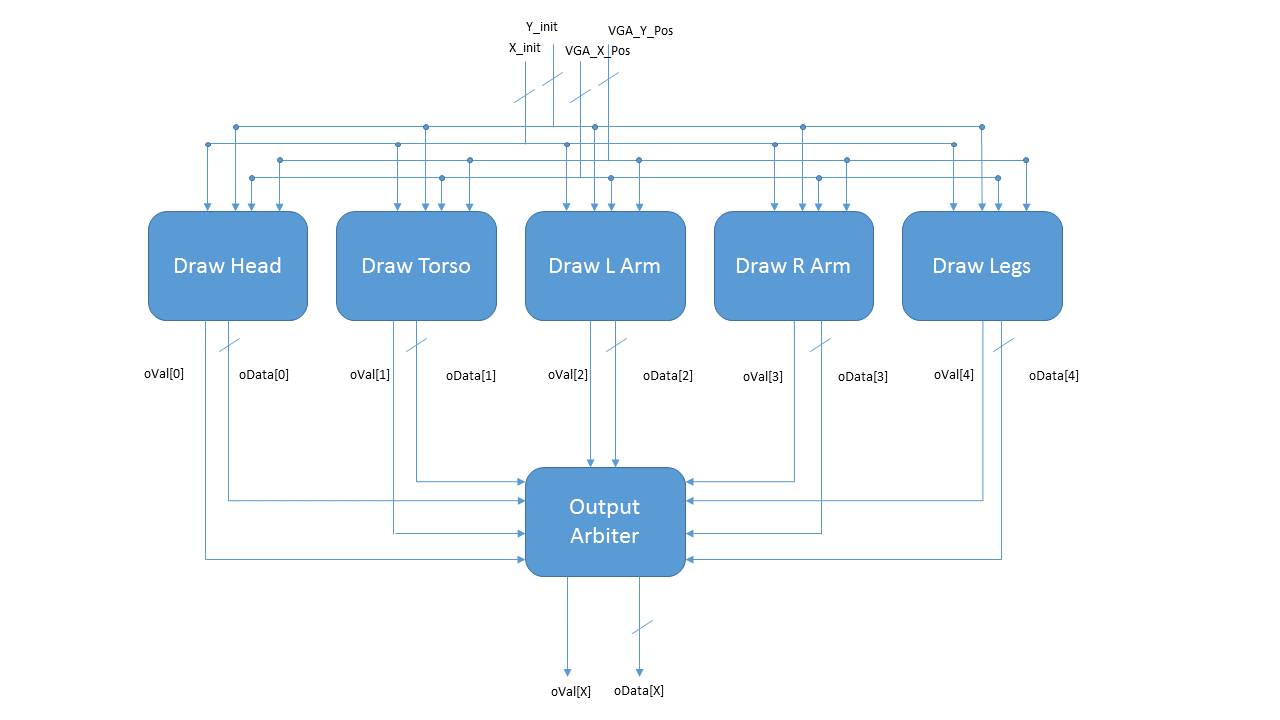
Modules were created to draw the basic components, and then these modules were instantiated in higher-level constructions that would allow us to create complicated layered designs at an arbitrary X and Y position. These modules included blocks with parameterized colors, and the various body parts of the dancers: the head, torso, legs, and left and right arms. Reference the "Person Block Diagram" image in the gallery section below to see the inputs and outputs of some of these modules. In the basic modules, the current VGA X and Y position of the VGA controller would be read in and if statements would be used to determine if the pixel in question was within the region being controlled by the basic module. If the pixel was relevant, the output valid signal would be set high. If the basic module was a body part, the difference between the top left X and Y position of the component and the current VGA X and Y position would be used to address into a ROM that was initialized with a memory initialization file (.mif). These initialization files were created from bitmaps with 24-bit color depth (8R8G8B). The color value at the given address in ROM (or in the case of the solid color blocks, the color of the block) would be returned in a 24-bit wide signal. Due to the low resolution of the VGA display that we were using, we were able to store all of the bitmaps on the M9K blocks that were on-chip.
Wrapper modules were then created to encapsulate these basic components and provide a first layer of arbitration between the various components to implement the occlusion culling mechanics. For example, in the drawBruce.v file, a Bruce-head block, a Bruce-torso block, a Bruce-l-arm block, a Bruce-r-arm block, and a Bruce-legs block were instantiated and given initial X and Y positions based on the inputs to the drawBruce module. An arbiter would take in the output valid signals from each of the five basic blocks along with their output colors and would select the color data from the frontmost element. This nesting allowed us to implement a large number of complicated drawings in hardware without the need for a screen buffer and without having to worry about the potential of visual artifacts from frame to frame as a result of improper memory management. These wrapper modules would take in an initial top left X and Y position in addition to an animation top left X and Y, which allowed us to move some of the simple components within the wrapper module based on the rhythm of the song that was being played into the FPGA.
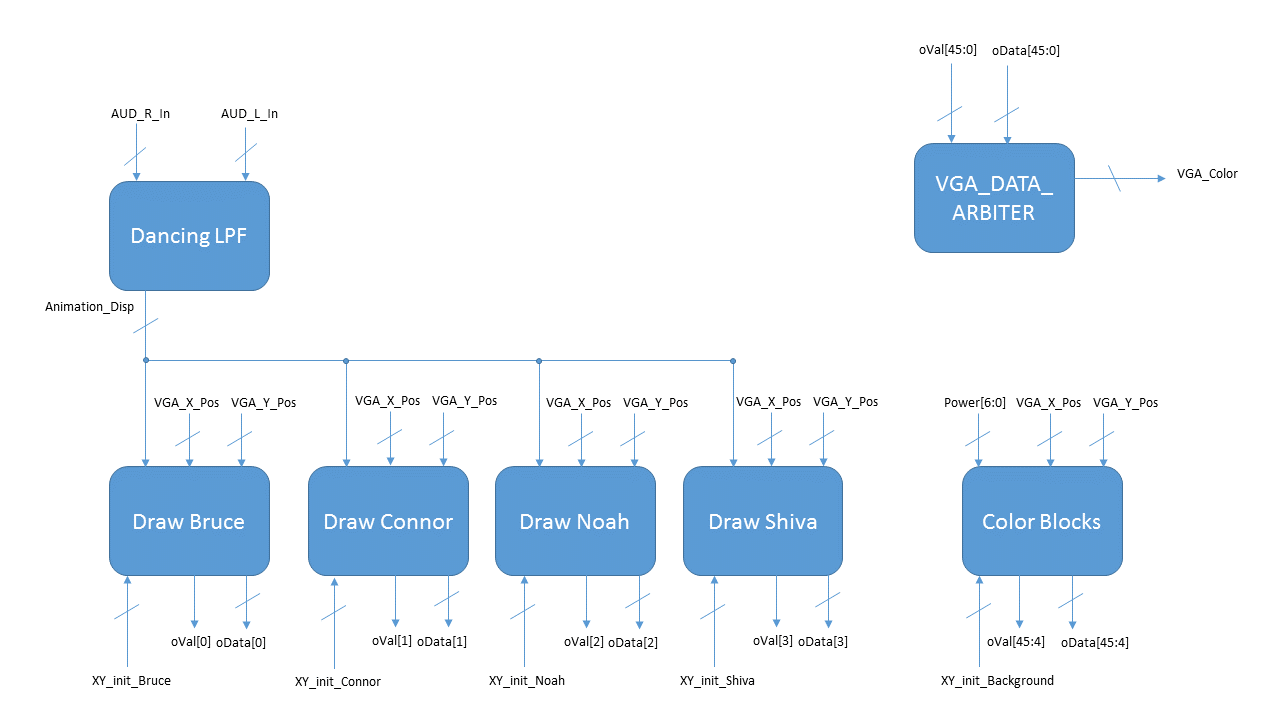
At the top level of our graphics modules was the screen manager. This module housed instances of all of the wrapper modules that were composed of the basic components and performed a final level of arbitration between the various wrappers. This module could support up to 64 layers before the one-hot encoding fanned out and became too cumbersome to repeatedly fit in the FPGA. Given the ability to nest layers in the wrapper modules, however, our graphics hardware was able to render an arbitrary number of layers. Reference the graphics block diagram image in the gallery below to see how all of these modules fit together to render the screen pixel-by-pixel on each frame. This top module also contained a low-pass filter that would take in the audio data from the audio ADC and adjust the animation X and Y position that would be passed into the wrapper modules where local logic would inform the basic component modules of their new top left X and Y positions.
This architecture took advantage of the strengths of the FPGA: utilization of the hundreds of thousands of logic elements to make high-speed custom logic, and hierarchical modularization. At the same time, we navigated the shortcomings of the development board that we were working with by avoiding the need to use SRAM or other memory sources to store an entire full-color VGA frame. The end result of this hardware was an easy to debug and a trivially expandable graphics package that could be informed by the audio inputs in order to create a unique music listening experience.
Audio Modules
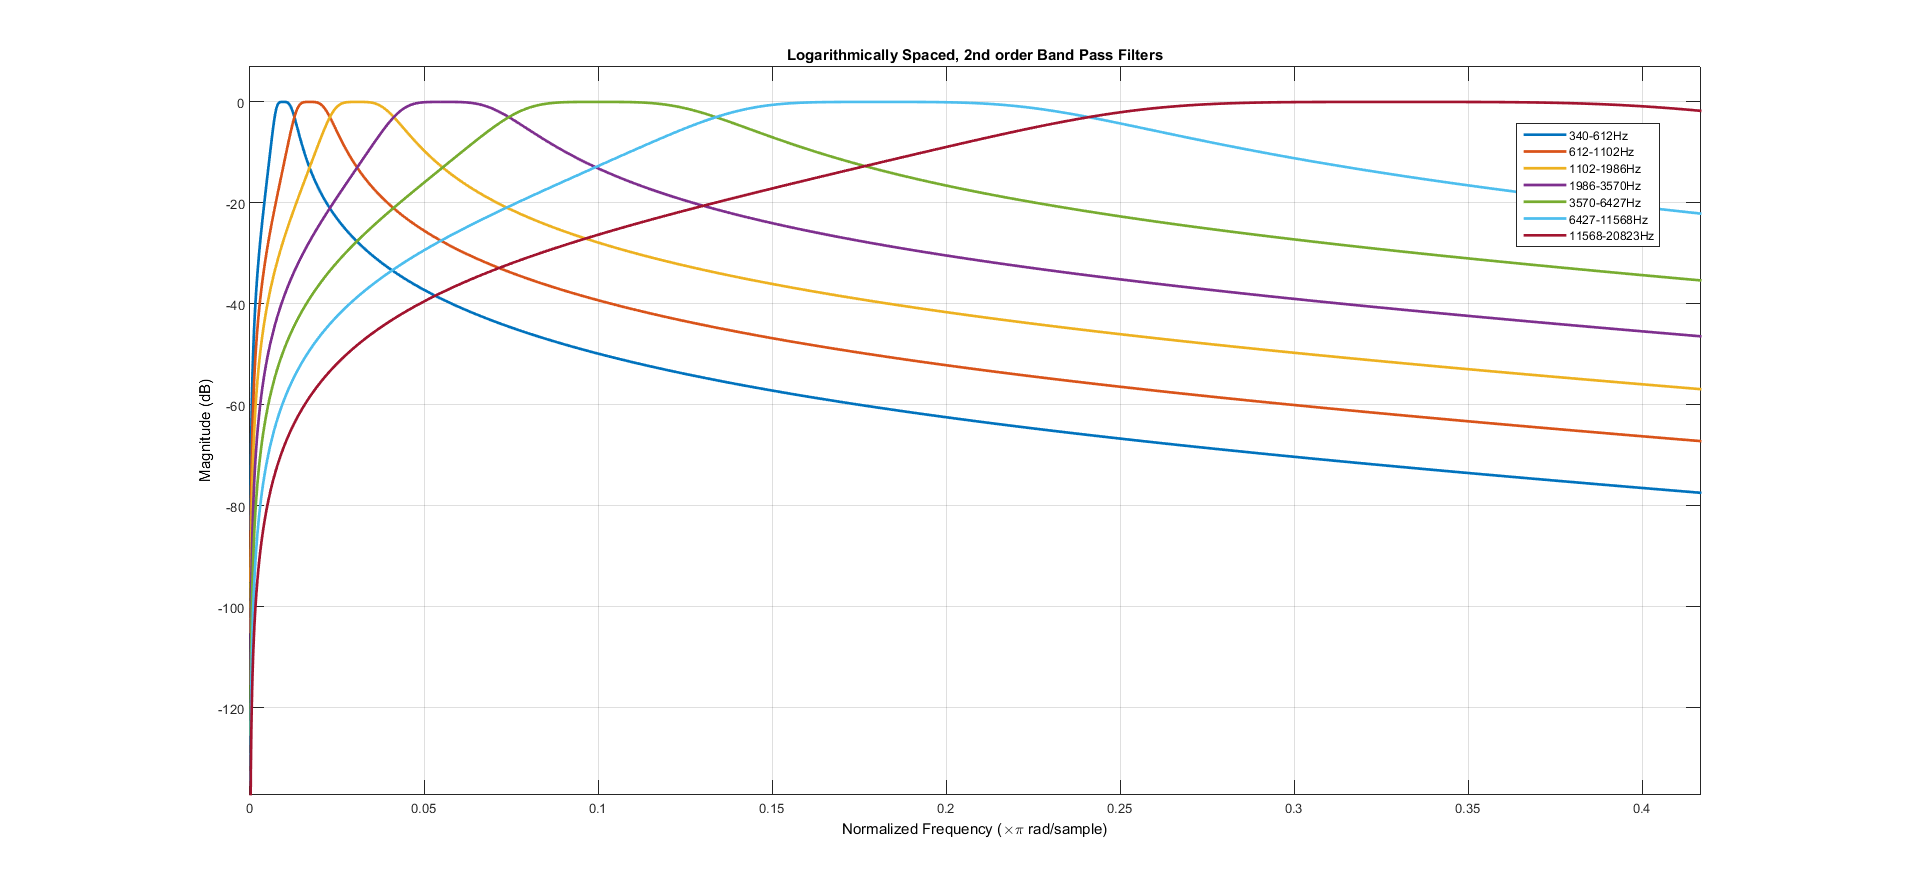
A filter bank is not the only way to display the snapshot of the magnitude spectral content of a signal. A DFT (Discrete Fourier Transform), DHT (Discrete Hartley Transform) or DCT (Discrete Cosine Transform) could also be used to output the magnitude of the sampled spectra. However, for our application there were compelling reasons to go with a filter bank instead: in general, the DFT,DHT,and DCT can be implemented in O(nlogn), but these implementations tend to be fairly complicated; and they're outputs are inherently linearly spaced. As a result, FFT-type IP cores are usually used as black boxes on FPGAs. Since using a black box would not sufficiently contribute to our understanding of anything, and since we wanted our "frequency bins" to be logarithmically spaced, we decided to use a bank of IIR (infinite impulse response) band-pass filters of varying widths across the audible range.
From here we had the choice of a floating or fixed point filter implementation. On the 5760 website, there is already a good example of a IIR filter implemented using 18-bit floating point on the DE2. Floating point is useful for filters when signals vary over a wide dynamic range. In general, this helps prevent overflow issues from cascading to a filter's output, but floating point numbers themselves are rather messy to implement. Just like the DFT option, we chose not to use floating point for our application so that we could avoid having to base our filters on the work of others.
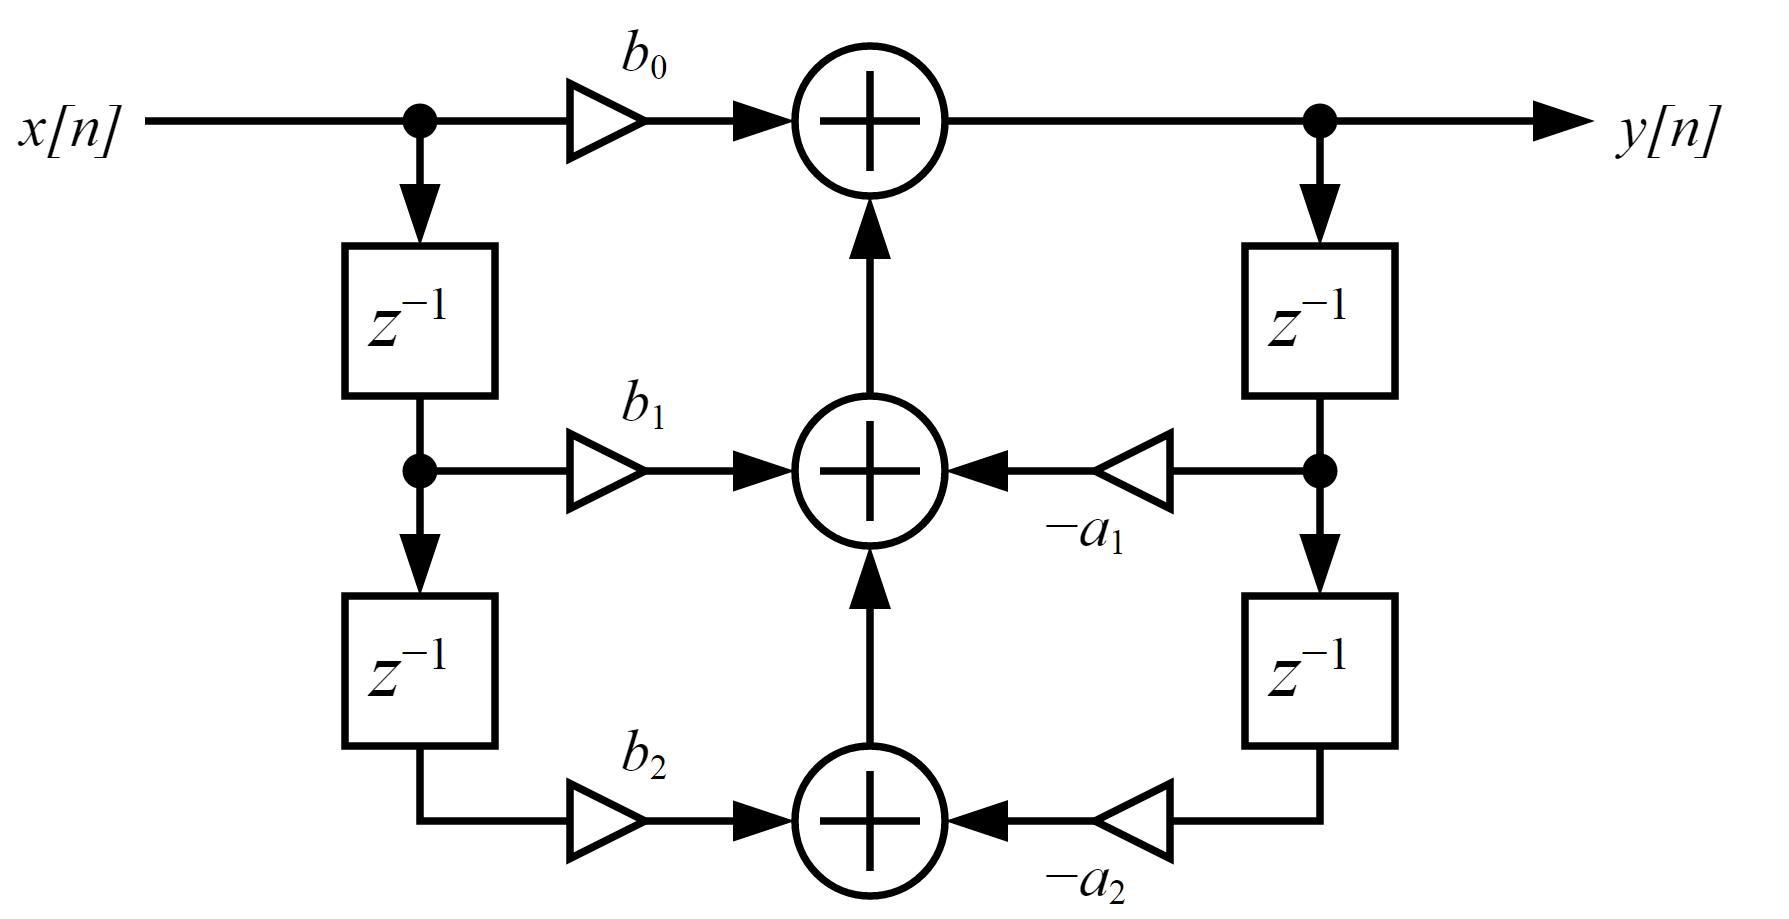
Because we were not interested in phase information from the input signal, we did not have to consider the phase response of our system when designing our filter. As a result, our basic decision in selecting a filter type was between steepness of the transition band and flatness of the passband. In the end, we found that the steepness of our transition band mattered little in the final display, but a flat pass-band was useful so that the output audio from our system, which was the sum of the filter outputs, would not add random gain and attenuation at arbitrary frequencies. For this reason we decided to use a 2nd order (2 pairs of conjugate poles and 2 pairs of conjugate zeros) butterworth bandpass filter. We selected 7 logarithmically spaced frequency bins and used them as the input to the MATLAB filter design toolbox's "butter()" function. Conceptually, it would work to just use the feedforward (b) and feedback (a) coefficients from this function to implement the filter as one difference equation. However, we found that doing this tended to affect numerical stability because the dynamic range of the tap coefficients varied by many orders of magnitude. For this reason, we adapted our MATLAB script (filterSOSGen.m) to output filter coefficients as a cascade of "second-order-sections". Each of these sections is a ratio of two quadratics that can be used to realize a conjugate pair of poles and zeros. By using the output of a second-order-section as the input to another second-order-section arbitrarily high-order filters can be realized in a numerically stable way. For our implementation of the second order section, we used the "Direct Form I" (pictured in gallery). This has the useful property that the individual filter-tap multiplications can overflow as long as the sum of the taps does not. Knowing this, and constrained to multiples of 9 by the multiplier hardware on the DE2-115, we chose to use signed two's complement 4.23 fixed-point for our calculations. Since the input from the audio codec is a signed 16 bit number (interpreted as a 1.15 fraction, between -1 and 1) this allowed for some flexibility in designing our filters, because we could have up to 8x (18dB) of pass-band gain without overflow occurring and allows for a residue as small as 1/256 the size of the ADC least significant bit.
For beat detection we used the output of a low-pass-filter, filtering the absolute value of the input signal. In MATLAB (LogPowerEstimator.m) we had compared a number of different strategies to get an "envelope" signal at 60-180bpm from a song (1-3Hz). Here we were able to determine that our design goal was actually significantly different from most "beat detection" systems. Most systems are trying to find one fixed "beat" frequency. For us it was good enough to have the animations move in time with the envelope of the signal. Although, filtering the absolute value of a signal is commonly thought to be a poor "beat detector", for our purposes it worked well.
Systems Integration
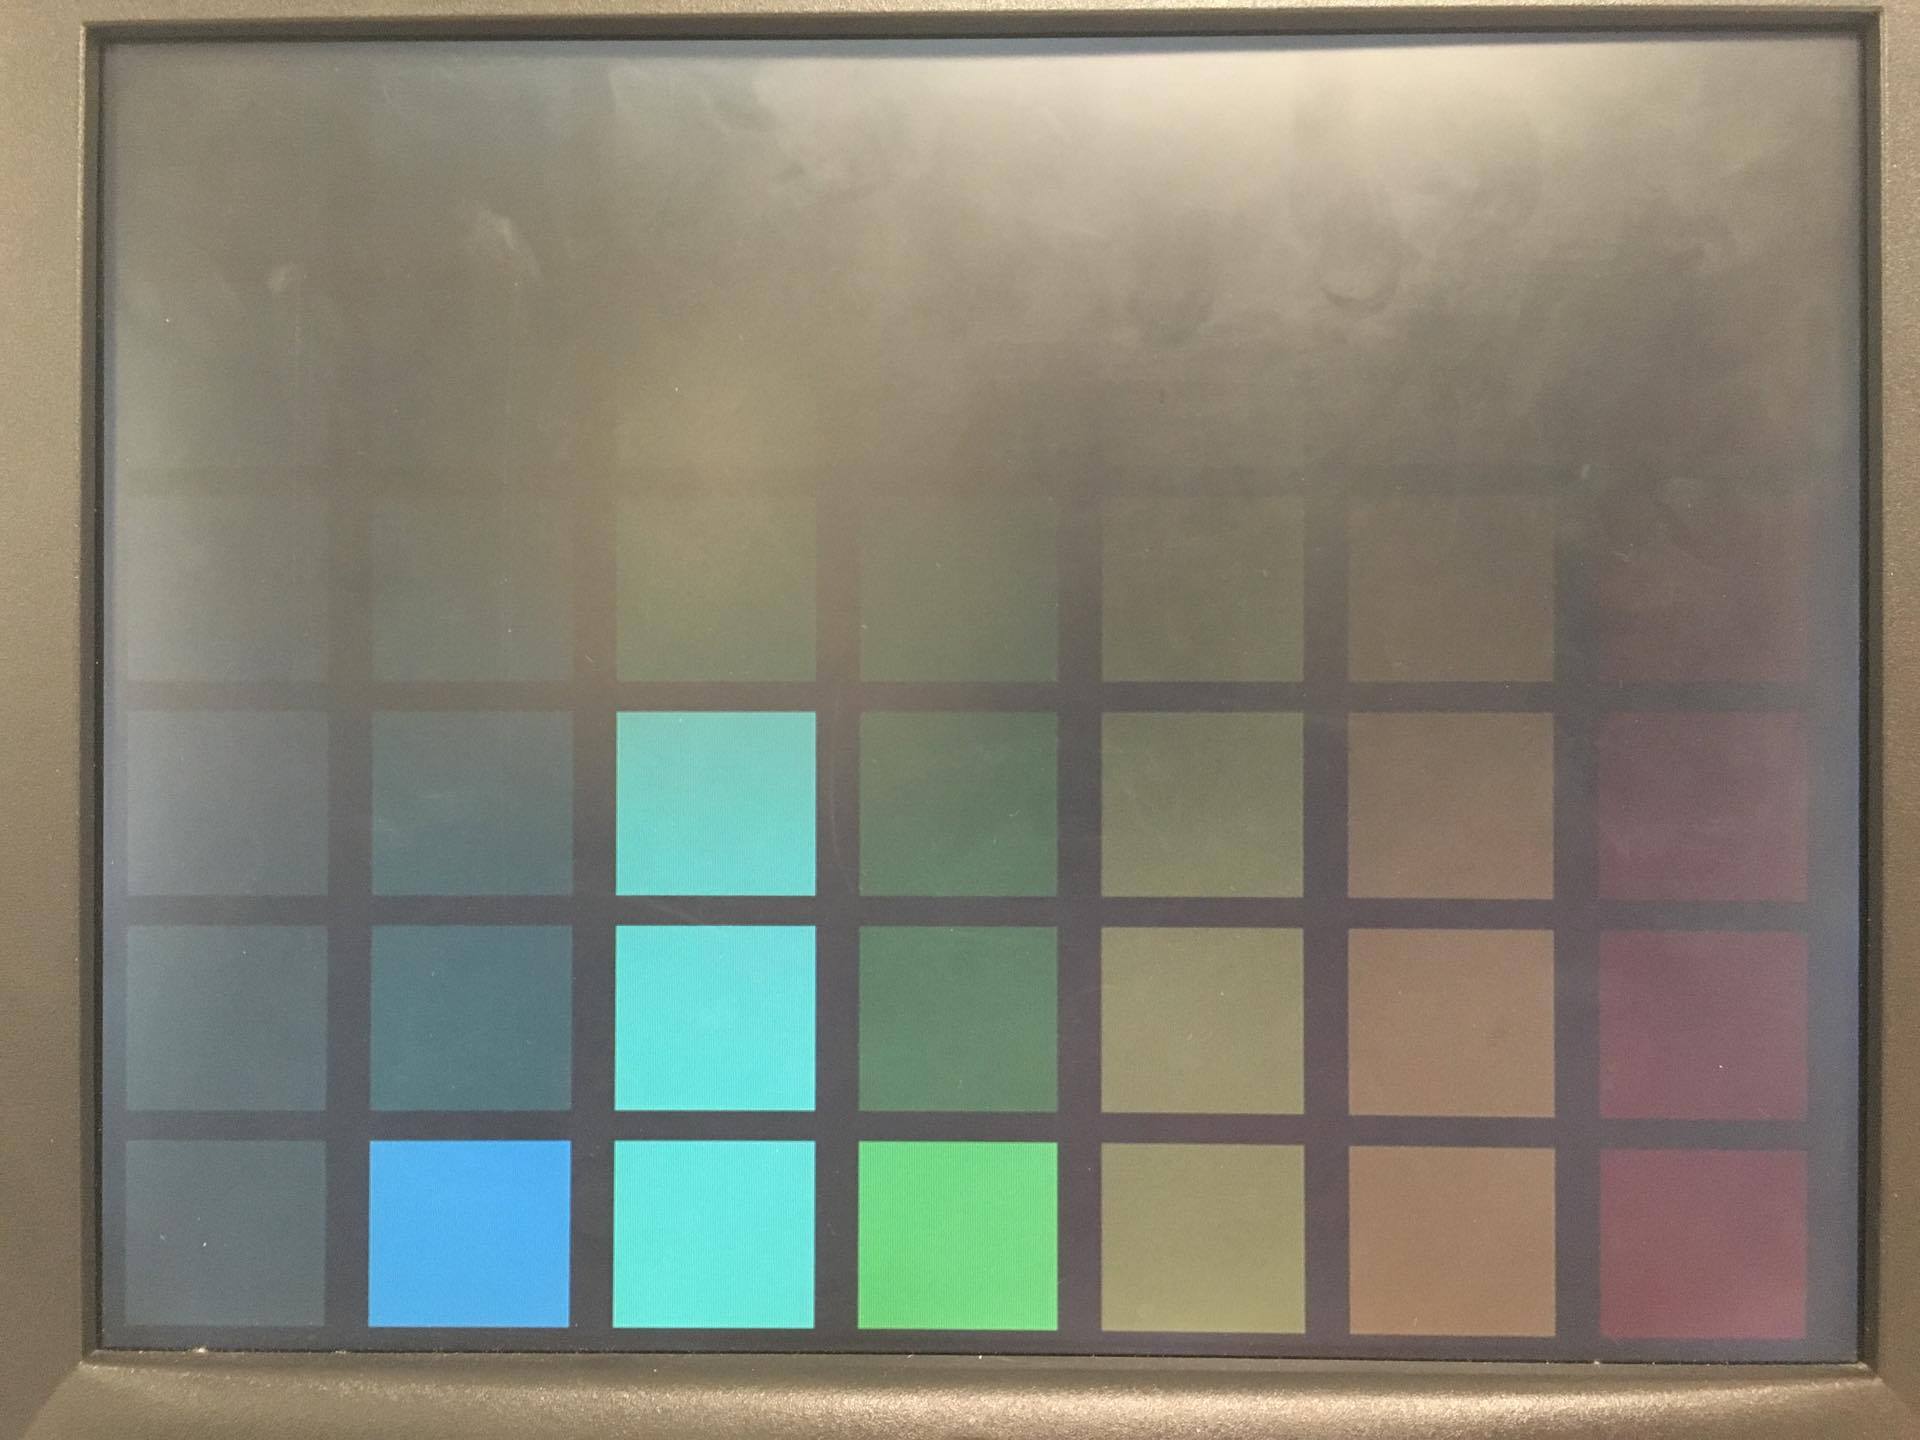
We blended the audio modules and the graphics modules within the screenManager.v file. As shown in the graphics block diagram and the audio block diagram below (which represent all of the modules instantiated within the screenManager module), the output from the filter bank is passed through the "power" array into the color blocks wrapper module that would update the equalizer display in the background based on the power content in the spectrum of the filter that corresponded to each respective column. Additionally, the audio input would be passed into the motion manager (shown in the figure as the audioLPF) that would create a signal that informed the wrapper modules of the horizontal and vertical displacement with which the dancers will be drawn. The audio clock was phase-locked to 18.4MHz while the VGA clock was phase-locked to 27.8MHz, and as such cross-clocker modules were used to ensure that the signals were being transmitted appropriately between the two distinct halves of the the screenManager module.
The top-level block diagram figure in the gallery below shows how the screen manager module - functioning and the computational powerhouse of the system - would interact with the video and audio controller hardware on the FGPA to inform the output of the system. The Wolfson Audio Codec used I2S to transfer data into the screenManager at the appropriate audio sampling rate of 48KHz, the screen manager could filter the data and then return an output within one I2S clock cycle (i.e. within one audio sample). This allowed the filter bank in the screen manager to modulate the line-in data and drive the line-out with no delay. By sharing a clock with the VGA controller, the screen manager was able to simultaneously update each pixel as it was needed by the VGA DACs. As a result, we were able to use highly modular architectures and take advantage of the capabilities of the FPGA to create a system that would ''listen'' to an arbitrary audio input and create a visual representation of the music in realtime while also modulating the audio output based on user controls.
Testing
We built up this system incrementally as separate subcomponents in order to facilitate testing and short compile times. Near the end, we worked to integrate all of the individual components in accordance with the block diagrams shown below, which were used as a guide to the architecture of the system.
First, we wanted to build the basic graphics modules as described in the sections above. We used code from previous labs to provide a stable platform that could draw solid colors the VGA monitor with the hardware VGA controller and then created the colorBlock.v file. After getting to a point where we could draw a single color block of a parameterized color, we built up the occlusion capabilities by creating arbitration logic and adding multiple overlapping color blocks. With this logic in place, we could then combine the color blocks into the wrapper modules that were used to generate the background equalizer. To finish up the basics of our graphics hardware, we then implemented the ROM files and the worked to display a single ROM image on a blank screen. After completing this, we could then include the ROM drawings into the wrapper modules in a similar manner to our color blocks. Through this progression, we were quickly able to build up the graphical capabilities that we would need for our music visualizer.
After creating stationary graphics, we then settled on a scheme to animate dancing based on the output of the audio LPF in the motionManager.v file. By hardcoding in a temporary output to this motion manager that would ramp displacement linearly from zero, to an arbitrary maximum value, and then back to zero over the course of a second, we validated that the dancer graphics could be made to ''dance'' to the beat of a song with our current architecture.
Having navigated the graphical challenges of this project, we then turned to the task of analyzing the audio input from the audio codec. Again, we started with code from a previous lab to read in and play out sounds from the line-in and line-out ports on the DE2-115. The next step was to create the filter bank that would be used to analyze the input and drive the output. Here, we turned to iVerilog and GTKwave to generate the filters, pass in a pure sine wave, and then compare the output with what we would expect based on the characteristics of the filter as evaluated by the MATLAB filter command. Once we had confirmed that the filters were working in simulation, we connected their spectral power reading outputs to the wrapper modules for the color blocks in the background of the VGA so that the filter bank would drive the brightness of each color block in the column. After synthesizing this file and programming the board, we found that we were able to successfully display the spectral content of the audio input while animating all four dancers on the screen.
The final task and the final subsystem to be validated was the rhythm detection that would control the motion of the dancers. Given that the rest of the system was functional and drawing to the VGA monitor, we were able to use the display to debug this final module. Through repeated visual inspection, we compared the audio input to the motion of the dancers until we were satisfied with the music visualizer that we had created.
Results
During our final lab period we were able to demonstrate real time graphics, audio-filtering, and animation from the FPGA. Specifically, by using a "tone generator" app and a cellphone we were able to demonstrate the agreement between the displayed spectrogram and reality. By toggling switches, we were able to "notch" the audio output of the filter bank and cancel the tone being played. Additionally, while playing a song we were able to show that the animations moved according to the "beat" of the audio. Each animated character can be toggled on and off and made to "dance" individually. The system succeeded as a demonstrator of a complex graphical and fixed-point audio system with a quirky front-end. Overall we were pleased with out results.
Demonstration
See embedded video in the Introduction Section!
Conclusions
We learned a lot doing this lab. We were able to build on our experience from earlier in the semester working with fixed point math and gained some knowledge about how to implement very-low level graphics on the FPGA. Second order sections and numerical stability considerations in filter design for HDL are both widely applicable to many problems within the FPGA tradespace. In the process, we got to build a Bruce-in-a-Club simulator that we think is pretty cool.
Mathematical Considerations
There were some noteworthy mathematical considerations that are worth noting in terms of the infinite impulse response filters that we developed. While they are mathematically stable with infinite precision, when using the 4.23 fixed notation that we adapted to utilize the 9-bit hardware multipliers it is possible to generate sustained oscillation that can result from switching filters on and off while there is a large amount of spectral content in their passbands. Apart from this limitation and the effects of limited precision arithmetic, the filters that we designed are a good approximation of the infinite impulse response butterworth filters that they were designed to replicate. With this fixed point precision, we could not hear a difference in the unfiltered and filtered output and so these shortcomings were deemed acceptable.
Societal Impacts
This project is unlikely to have significant societal impact.
Ethical Considerations
As far as we know, our project does not violate any laws or endanger anyone. Noah Levy, Connor Archard, and Shiva Rajagopal all gave their permission to be portrayed. Admittedly, we used the likeness of Bruce Land without explicit permission. We felt this was justified to maintain a veil of secrecy and excitement regarding our project, there is also precedent for this from the Bruce in a Box project. Obviously, after the big reveal if Bruce objects to this we will remove the image from our system and update our code and website accordingly.
Appendices
Budgeting
| Part: | Description: | Cost: |
| DE2-115 | Altera development board used as the platform for this project | $0 |
| VGA Monitor | Display used to output the music visualization | $0 |
| VGA and Aux Cables | Connected the FPGA to a display and to a music source | $0 |
Software Listing
DE2_115_Basic_Computer.v (top file) - The main Verilog file that connected all of the modules on the Cyclone IV together. View here.
screenManager.v - The file used for handling layer based drawing of images. Implements 64 layers and contains priority encoder for choosing among them. View here.
motionManager.v - The file used to implement movement of people on screen. Also contains lowpass filter for beat detect. View here.
AUDIO_DAC_ADC.v - The file used for I2S interfacing with audio codec. View here.
filterSosGen.m - Matlab file used for generating fixed point 4.23 SOS Matrices. View here.
autoGen_BPF.v - Verilog file containing 2nd order BPF IIR implementation. View here.
SOS.v - Verilog file containing Second Order System Direct Form I implementation. View here.
bitmapReads.m - Matlab file for generating .mif ROM files from image file formats. View here.
LogPowerEstimator.m - Matlab file used for prototyping filters and testing beat detection. View here.
To see a full listing of our final code, view it on github: View here
Contribution
Connor made all of the graphics modules and organized the top file. He also implemented the animation and worked on the filters and beat detection. Noah worked on the final version of the filters and implementing the matlab scripts for SOS autogeneration. He also implemented beat detection. We both worked on the final report website.
References
Direct Form Type I Filter Information, by Julius O. Smith
Rice page on Beat Detection Strategies
Description of resource-constrained beat detection on Arduino
Bruce in a Box, by Julie Wang, inspired Bruce-based project, we also used parts of her VGA code
Team
Say Hello.
Or email us at
cwa37@cornell.edu and nml45@cornell.eduAll work shown on this website belongs to us and may not be copied without our notification and prior agreement.