 Figure 2: Flow Chart
FPGA Code
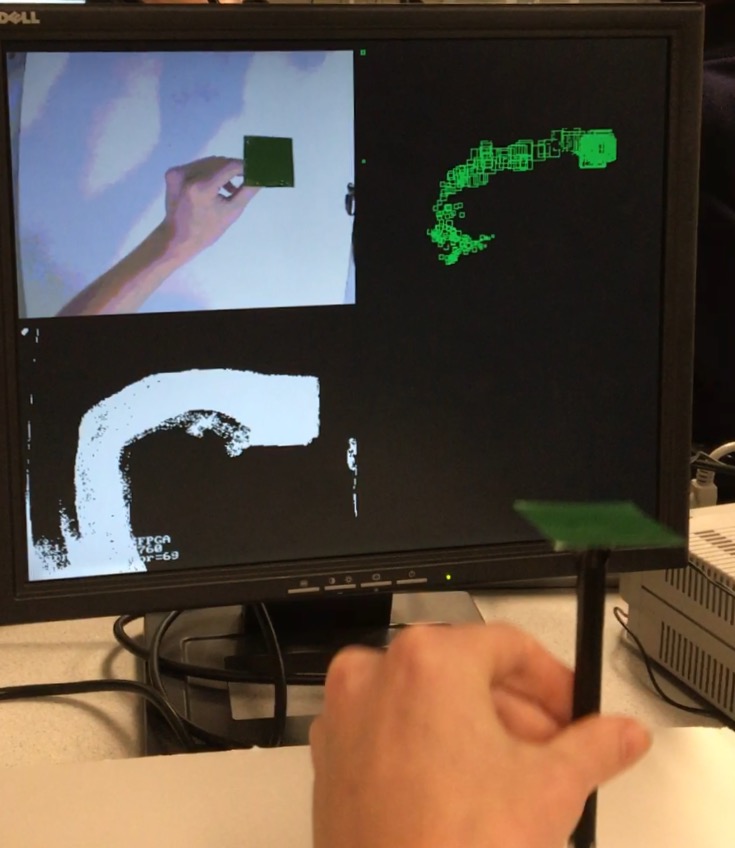
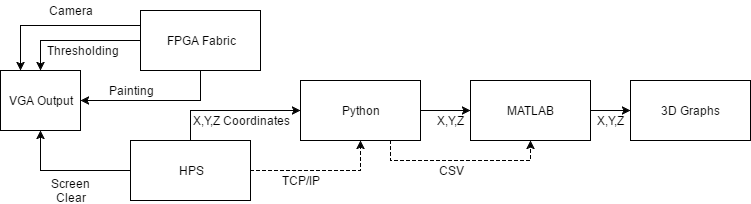
On the FPGA Side, our goal was to display video input from the camera, determine the coordinates of the stylus, interface with the HPS, and draw outputs to the VGA. In order to do this, we needed to set up our bus addresses to allow for reading from the camera as well as writing to the VGA. This bus addresses were the base address offsets from Qsys summed with the x and y coordinate to either read or plot. In addition, we used vga_x_cood and vga_y_cood to determine which quadrant of the screen to draw to.
The boxes displayed and the coordinates plotted were based on the centroid of all of the green pixels found. Green in this case was the color of the tip of the stylus. For centroid calculation, we first needed total number of green pixels from the camera at a single instant. In addition, we needed the sum of all x-coordinates and y-coordinates of these green pixels. On the HPS side, we divide the sum of x and y coordinates with the total number of green pixels found in order to determine the centroid of the x and y coordinates.
Green Pixel Detection
The input from the NTSC is 8-bit color. In 8-bit color, the three most significant bits (5-7) represent levels of red, the second three most significant bits (2-4) represent levels of green, and the two least significant bits (0-1) represent levels of blue. This allows us 8 total levels of red, 8 total levels of green, and 4 total levels of blue. In order to determine which pixels were green, we thresholded the video input with minimum and maximum intensities for each of red, green, and blue. These thresholds are inputted by the user on terminal, but the general goal of the thresholds are to minimize red and blue, and maximize green. However, due to noise from the camera, we have to still leave enough levels of red and blue so as to not limit the actual detection. After significant experimental testing, we found that thresholds of 0-2 for red, 2-7 for green, and 0-2 for blue were ideal for thresholding color. In our code, addition to wires for the threshold values, we held a flag determining whether individual pixels were green.
The thresholding was testing by observing the third quadrant on the VGA and observing whether all green pixels were indeed removed, and looking for white pixels at their locations.
Box Drawing
Our 3-D model on the VGA were boxes that were scaled based on the distance of the stylus from the screen. This distance is proportional to the number of green pixels found from the NTSC camera. In order to draw a box, we required two pieces of information. We required a center coordinate for x and y, and we required a radius that was scaled based on the number of pixels found. Since scaling and centroid calculation required division, this information came via PIO from the HPS. The radius determined the distance of the edges of the box from the center.
To draw a box, we created a condition to determine whether a pixel on the screen was part of the box. We created for different conditions based on the video_in coordinate that is being scanned to determine whether the coordinate is part of the right, left, top, or bottom wall of the box. If one of these conditions were met, then a green coordinate would be drawn in the second quadrant for this pixel.
Camera and VGA State Machine
Completing displaying the outputs required the use of a five-state state machine.
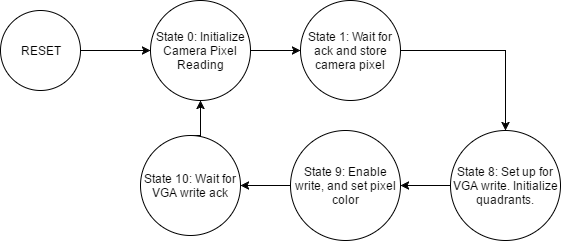 Figure 3: FPGA State Machine
Reset:
Upon reset, all variables are initialized to zero. Bus reading and writing enable signals are disabled. Drawing is set to upper left hand corner. The video input x and y coordinates that will be incremented are also set to zero. Finally, all accumulators are set to 0.
State 0: Initialize camera pixel reading
In state 0, we enable reading from the video input NTSC camera. The coordinate that is read is the video_in_bus_addr which is determined by the video input x and y coordinates. In this state, these x and y coordinates are incremented. The maximum video input x coordinate is 320 and the maximum video input y coordinate is 240. The y coordinate is only incremented when the x coordinate reaches its maximum. Whenever the y-coordinate reaches its maximum, the total number of green pixels is stored, as well as the total sum of x and y coordinates. These values are then reinitialized.
State 1: Camera read acknowledgement wait
In this state, we wait for the acknowledgement that the bus read has been completed. Once the acknowledgement is received, we store the color of the pixel found from the bus read, disable reading, and transition states.
State 8: Set Up for VGA Write
This state was separated from initial states 0 and 1 to mark that we are transitioning from input-mode to output-mode. In this state, we set up the conditions for the VGA write. If the pixel at the current camera read was green, we initialize our drawing at the third quadrant (for thresholds). This means that our base VGA coordinates are at x = 0 and y = 240. In addition, we increment the number of green pixels found and the sum of their x coordinates and y coordinates. If the pixel is on the edge of a box, as determined from the centroid, then we set the base VGA coordinates to the second quadrant (x = 320, y = 0). Otherwise, we will draw the camera pixel, in the first quadrant (x = 0, y = 0).
State 9: Initialize Write
In this state, we enable the VGA bus to write, and set the bus address found from the sum of the VGA base coordinates and the video input coordinates. In addition, if the coordinate from the camera was found to be green, then we set the pixel output color to white. If it is on the edge of a box, then the pixel color is set to green. Otherwise, the pixel color is whatever was found from the camera. Since the VGA base coordinates were set previously, these colors are drawn in their respective coordinates.
State 10: VGA Write Acknowledgement
In this state, we wait for the acknowledgement to return from the external bus after a pixel write. We then return to state 0 for the next pixel.
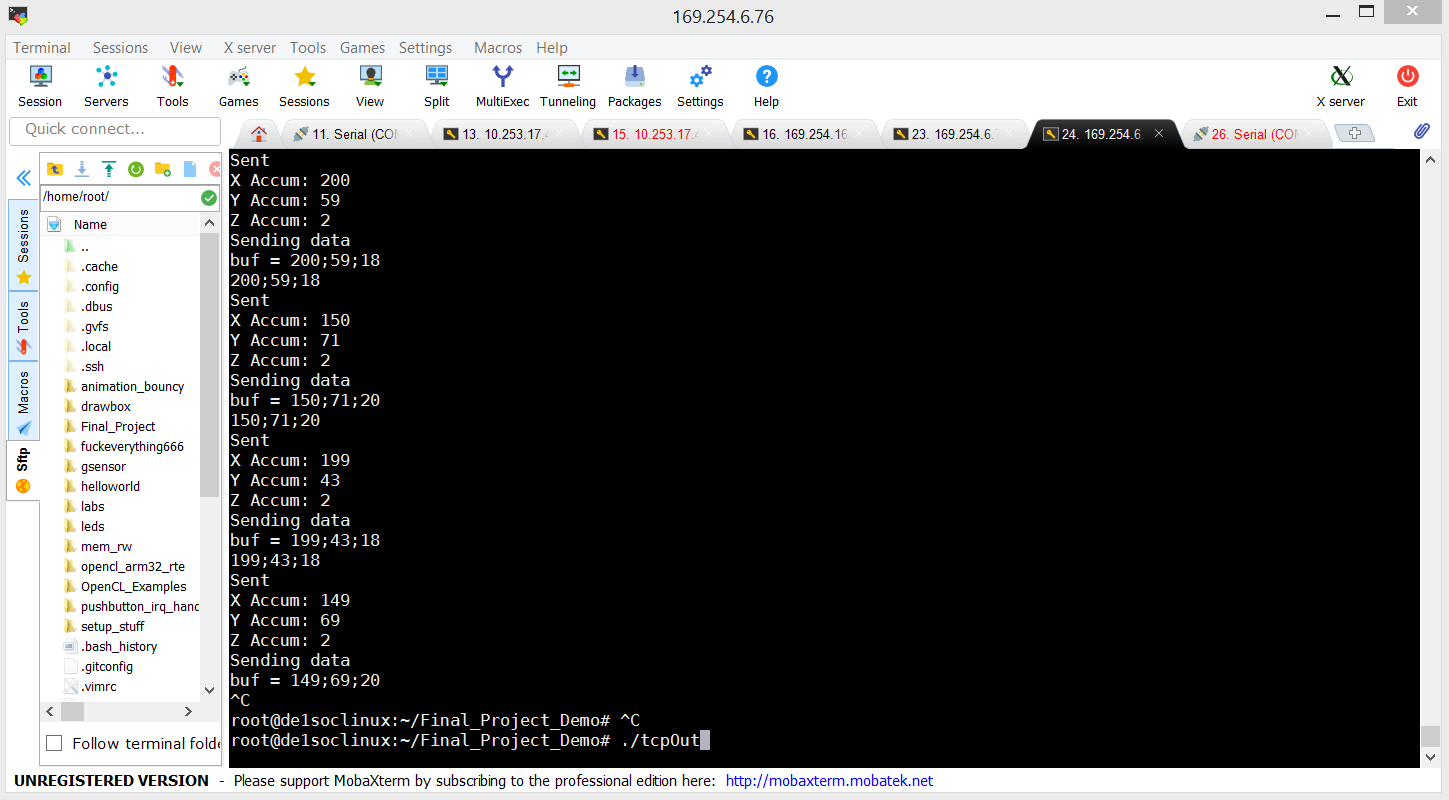 Figure 4: HPS Program Running
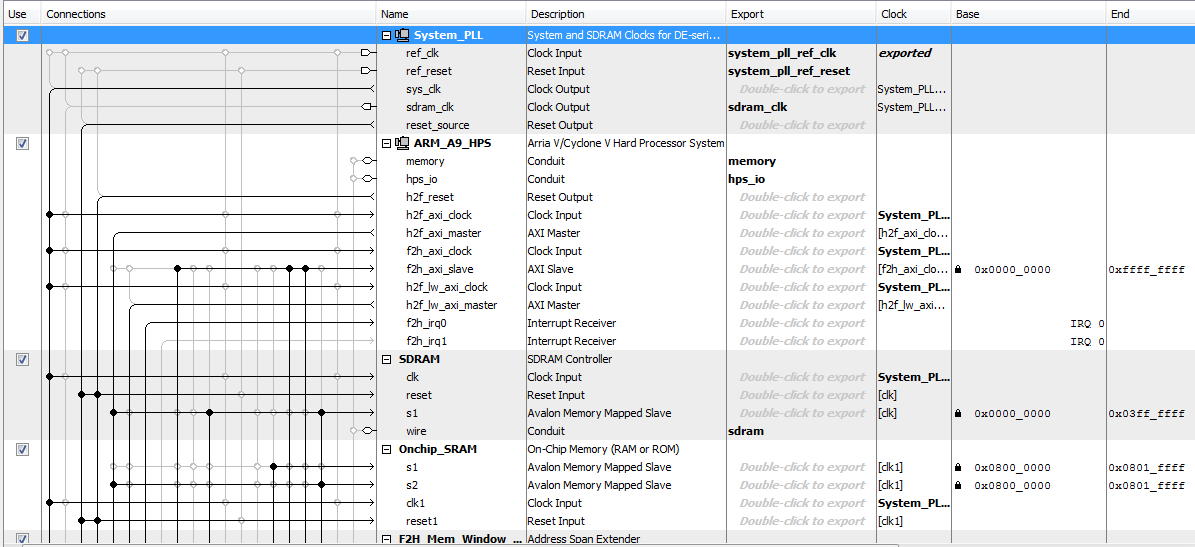 Figure 5: Qsys 1
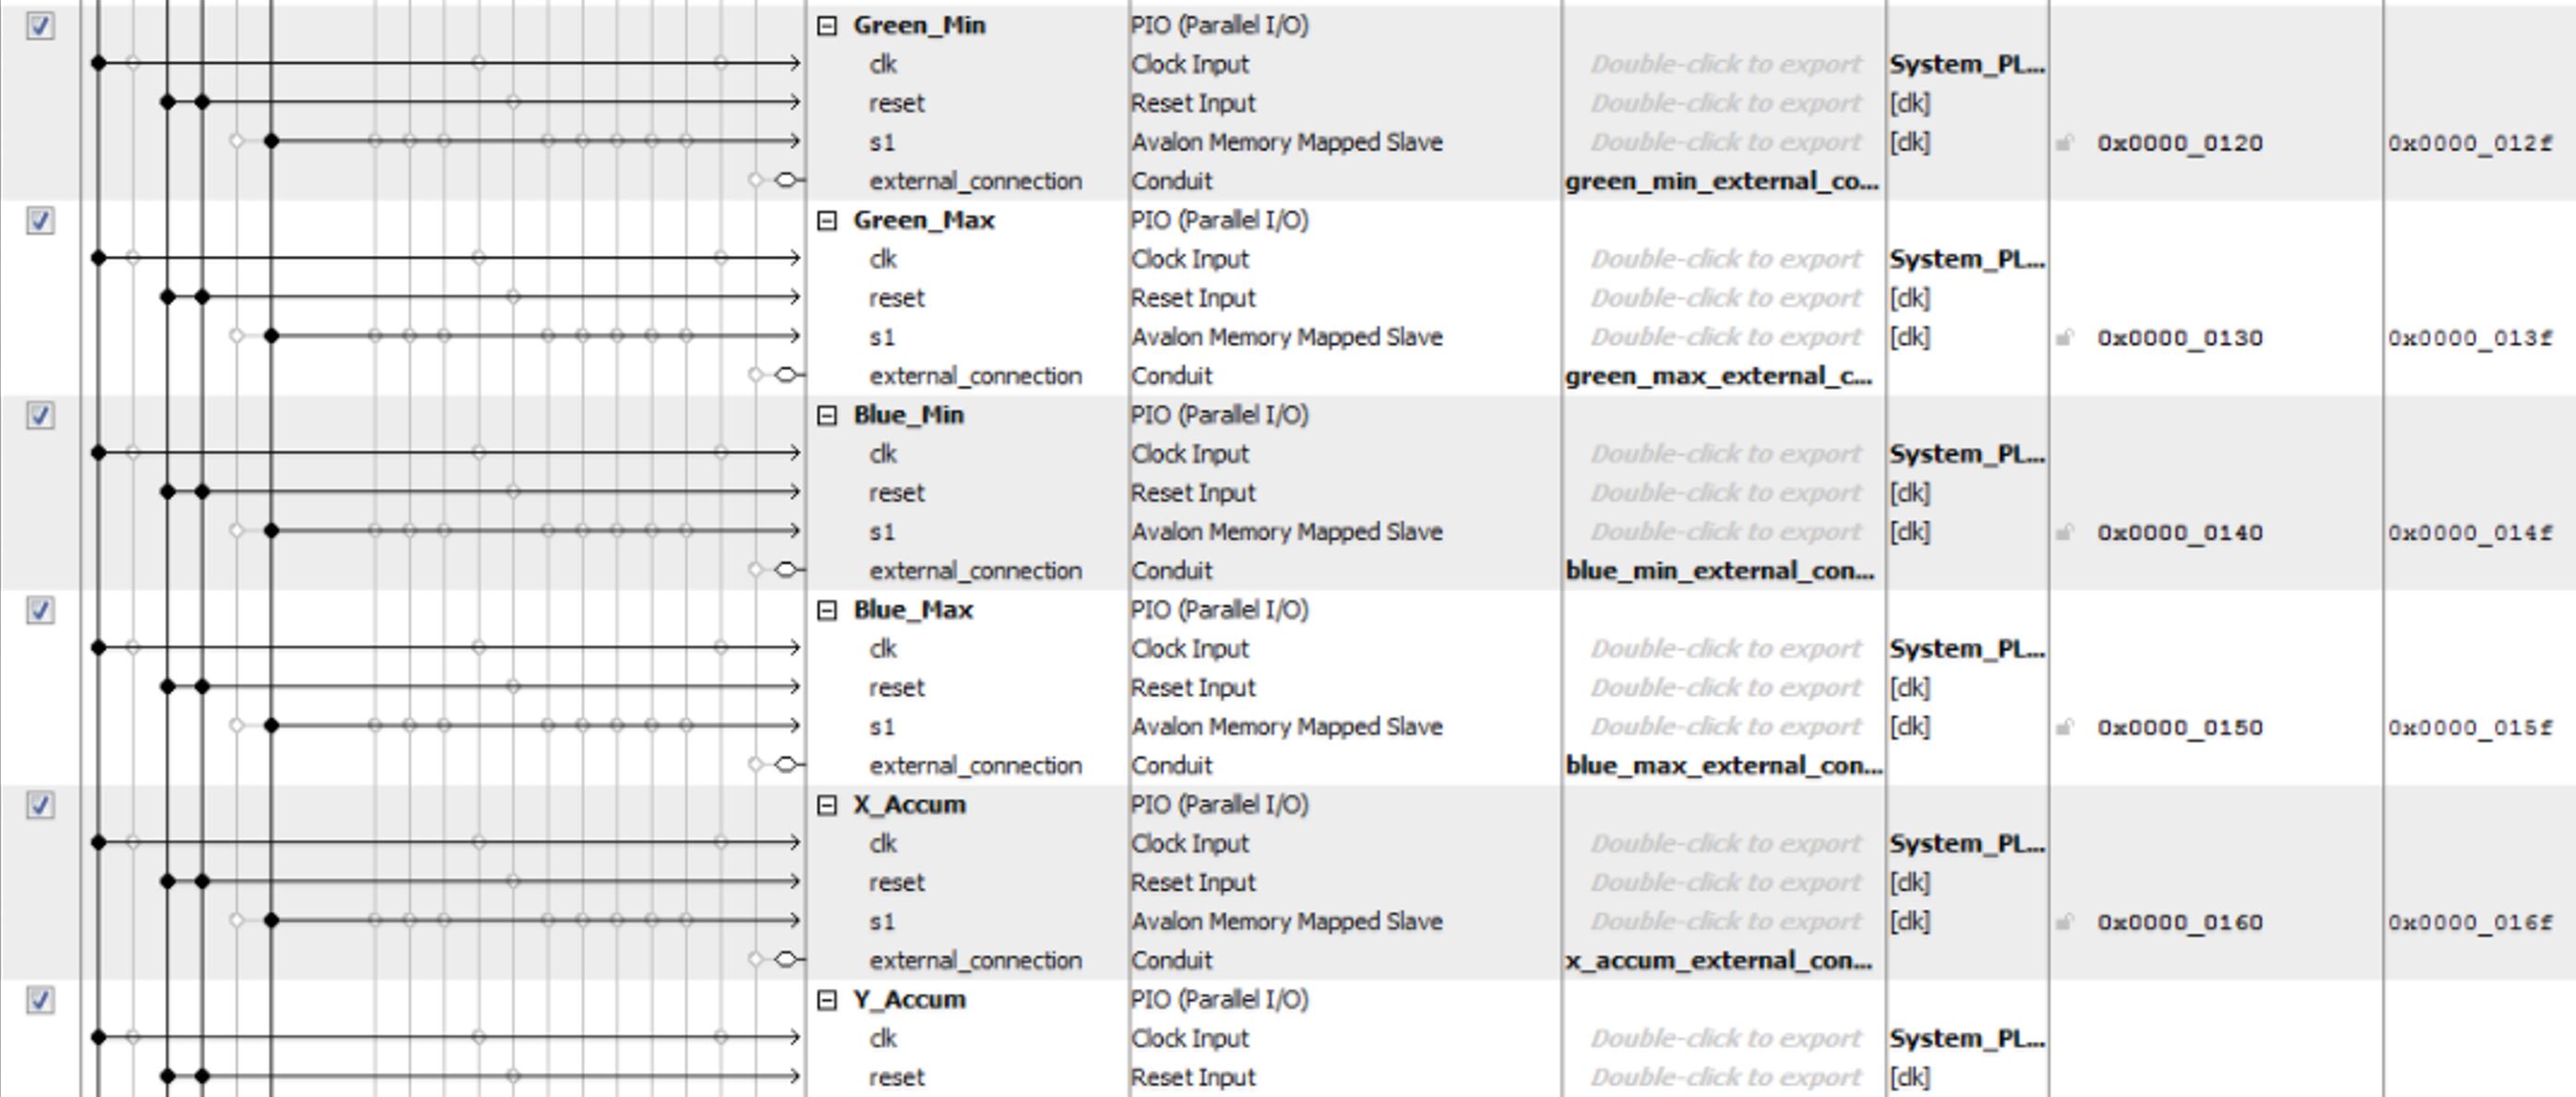 Figure 6: Qsys 2
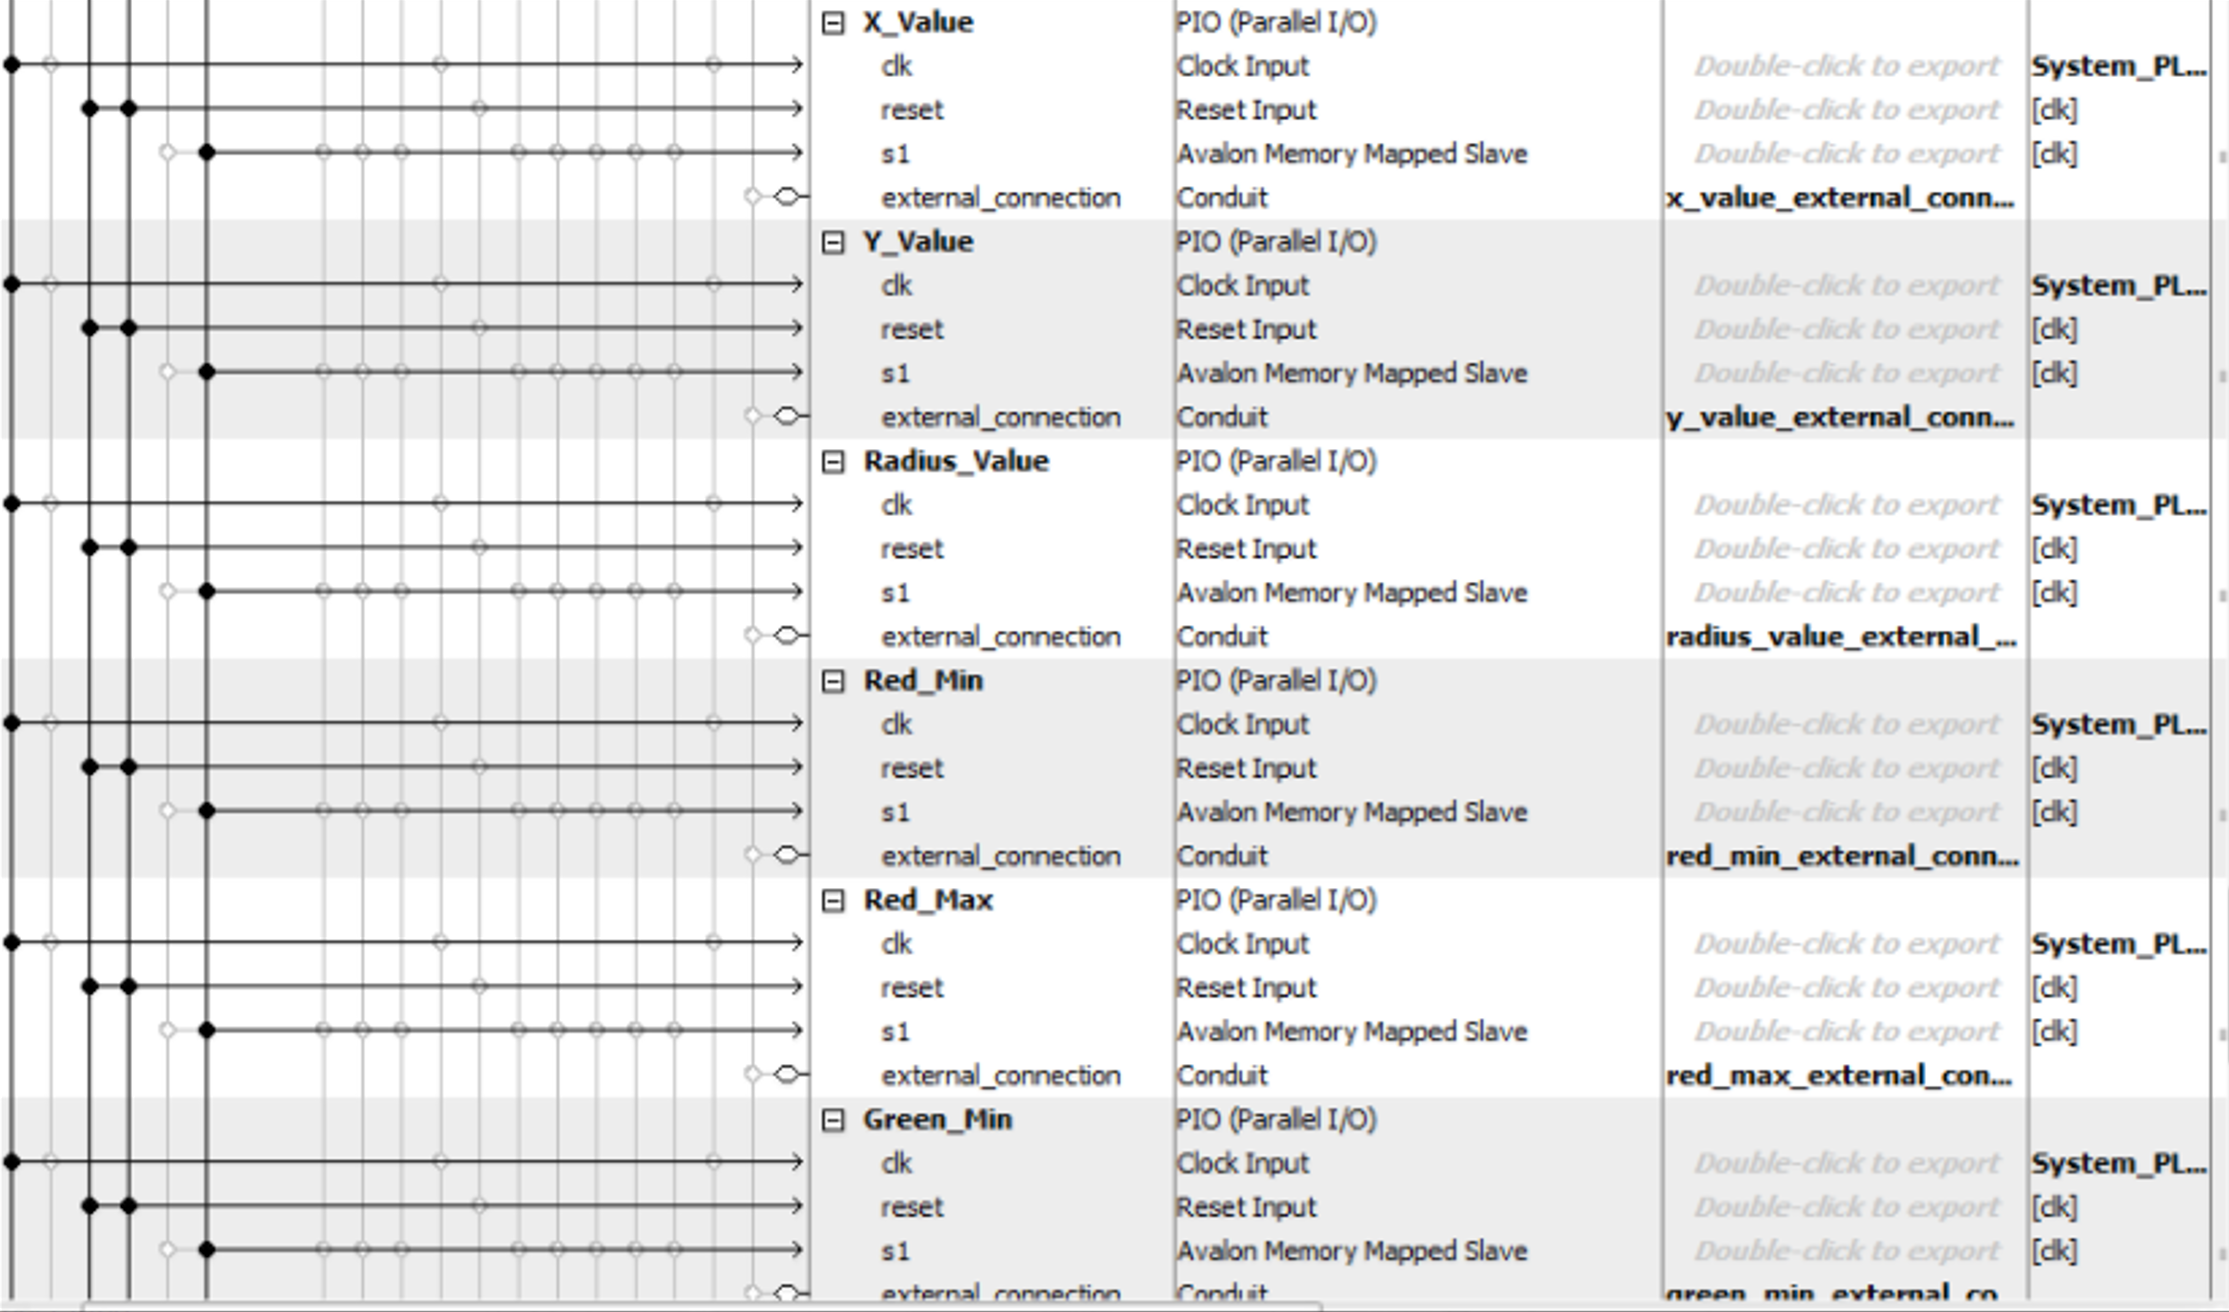 Figure 7: Qsys 3
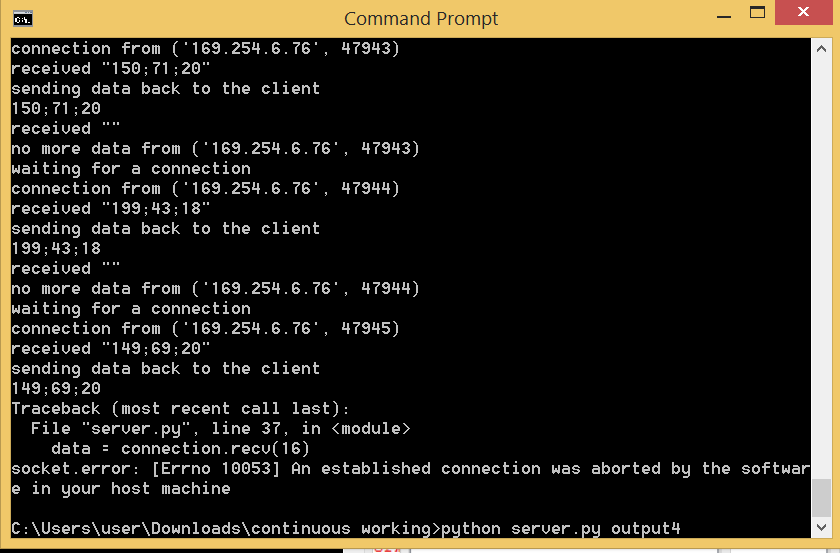 Figure 8: Python Server Running
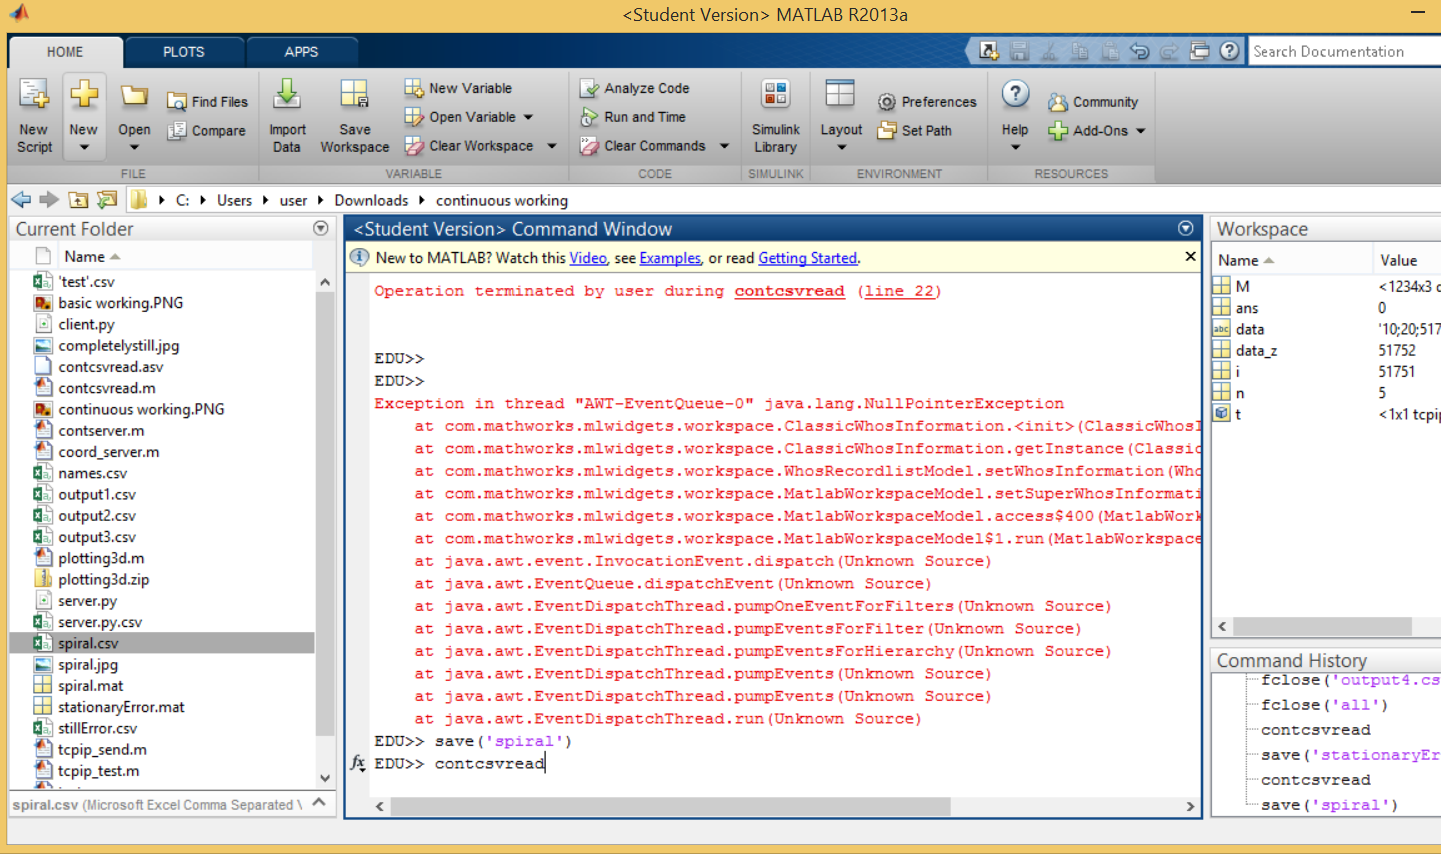 Figure 9: MATLAB Screen Capture
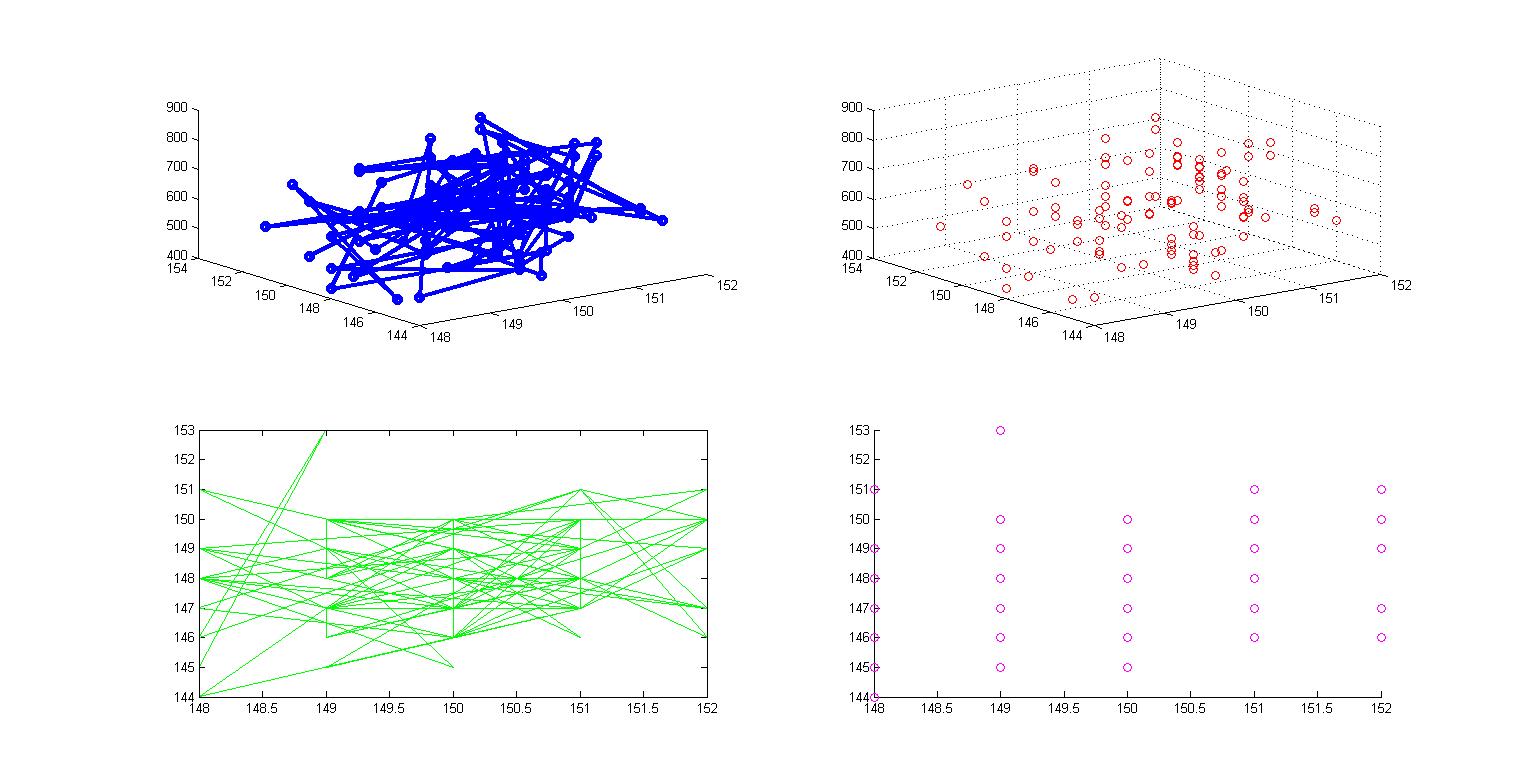 Figure 10: Error Checking for Completely Still Stylus
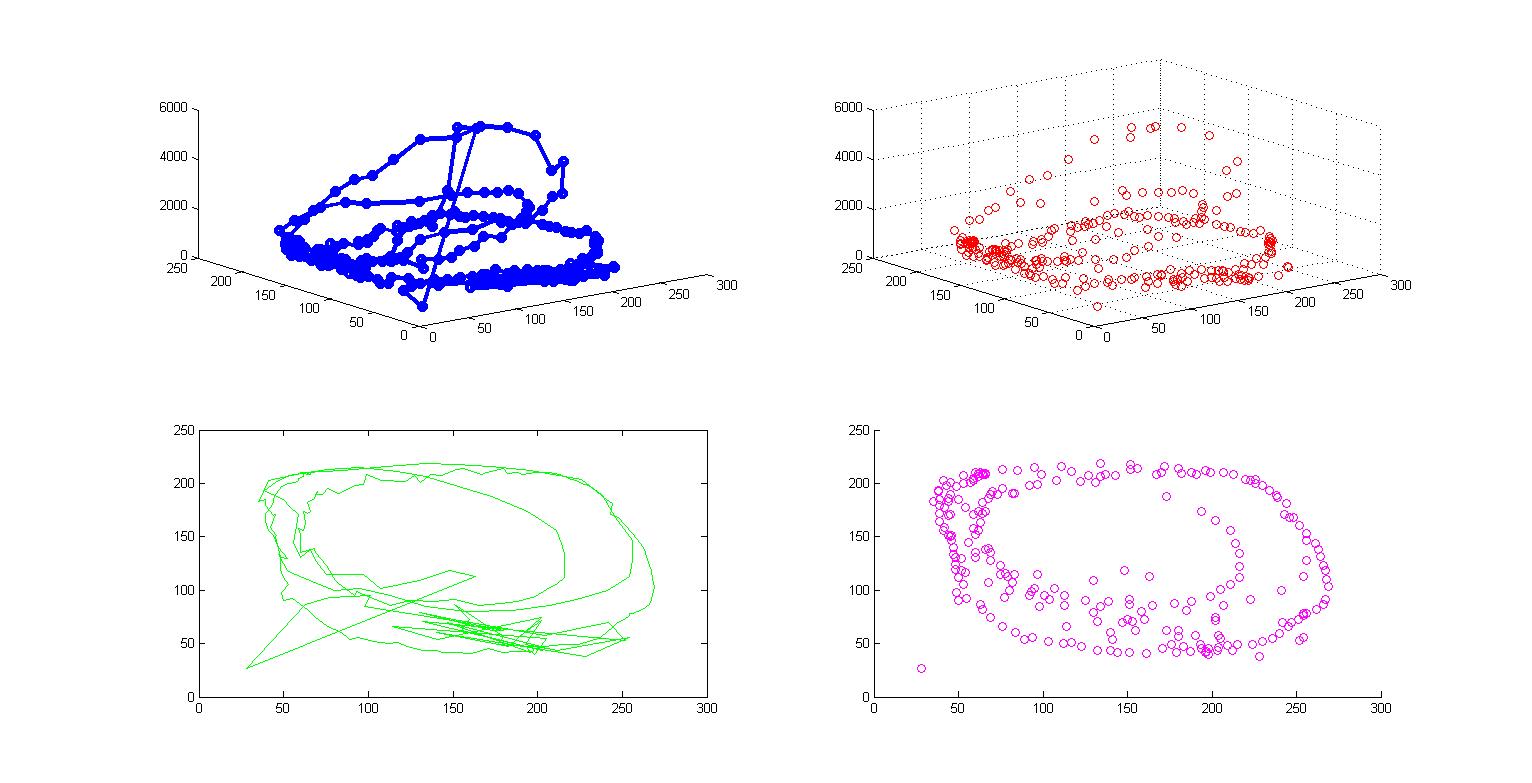 Figure 11: Spiral Drawing