EOD Simulator
High Level Design
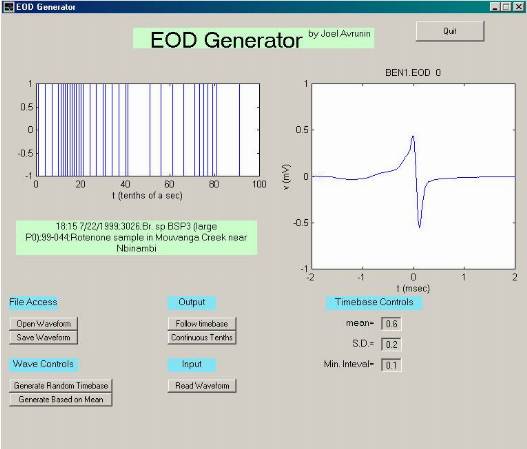 The user interface for the simulator is a GUI created with the MatLab GUI controls. Each control button calls a subroutine
within the program when pressed. Several buttons have been placed for future implementation, but are not active in this version
of the simulator (save, read). The interval pattern for the wave output is located in the upper left of the simulator. The wave in
shown in the graph on the right. Instances of the wave on the right are represented as horizontal lines in the graph on the left. Pressing
the button "Generate Based on Mean" will pop-up a menu for inputing statistical information on the signal, which will simulatenously be
output in the blanks and generate the intervals in the graph on the upper left.
The user interface for the simulator is a GUI created with the MatLab GUI controls. Each control button calls a subroutine
within the program when pressed. Several buttons have been placed for future implementation, but are not active in this version
of the simulator (save, read). The interval pattern for the wave output is located in the upper left of the simulator. The wave in
shown in the graph on the right. Instances of the wave on the right are represented as horizontal lines in the graph on the left. Pressing
the button "Generate Based on Mean" will pop-up a menu for inputing statistical information on the signal, which will simulatenously be
output in the blanks and generate the intervals in the graph on the upper left.


Webpage created by Joel Avrunin ('01).
Created November 12, 1999. Last modified December 13, 2000.