Lab exercise 1
Introduction to hardware and software
Introduction.
You will explore the function of the signal generator, oscilloscope (scope), prototype board, power supply, and digital multimeter (DMM). The software we will use to simulate and understand circuitry will be introduced. The goal over the next four labs is to build an electrical model of a beating heart.
Procedure:
You will need to apply for an ECE account to use these machines. Remember to store all of your files on a flash drive or on your Z drive.
Any information left on the local computer will be erased when you logout!
Quickly run through the proceedures shown in the electronics introduction. For more infomation read:
You can measure the voltage across any element in the circuit by setting up the scope math menu to subtract the voltages at the two inputs.
You can store oscilloscope traces on a USB flash drive. See manual.
The software we will be using to simulate circuits is LTspice from Linear Technology. This a free download. See also the LTspice users manual.
Assignment:
Note that in this and every lab assignment the verb build means to construct a circuit on the protoype board with actual parts.
The verb simulate means use LTspice to mathematically simulate the circuit.
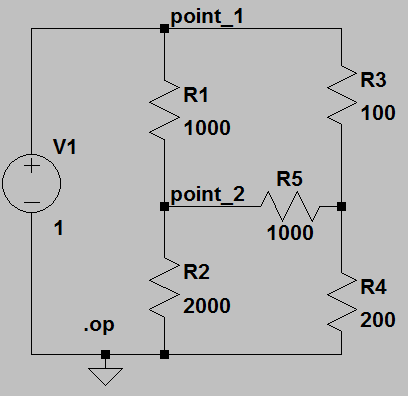
- Download the LTspice circuit TwoRs.asc and run it. You should see a summary panel showing the voltage at each node and current through each element.
- Modify the circuit to include another resistor from point_1 to ground and set the resistor value to 100 ohms. Run the simulation. What voltages/currents changed and which did not?
- Further modify the circuit as shown below, then run the simulation. What is the current through R5? Calculate what it should be and explain any difference.
- Download the LTspice circuit RC_sine.asc and run it. A blank waveform panel should appear. Click on the nodes point_1 and point_2 to add two waveforms to the waveform panel. Vary the frrequency of the sine wave voltage source from 10 Hz to 10 KHz in the following sequence: [10 20 50 100 200 500 1000 2000 5000 10000]. What happens to the voltage and phase at point_2 relative to point_1 as a function of frequency?
- Download the LTspice circuit RC_ac.asc and run it. A blank waveform panel should appear. Click on the nodes point_1 and point_2 to add two waveforms to the waveform panel. This analysis mode computes frequency versus phase and magnitude of the response for you! What happens to the voltage and phase at point_2 relative to point_1 as a function of frequency? Compare to part 4 above.
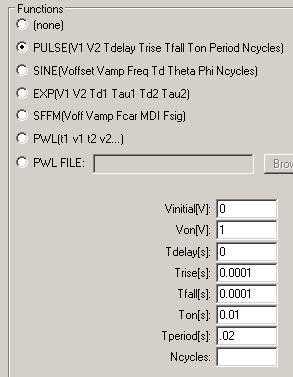
- Convert the sine voltage source in RC_sine.asc to a pulse source by right-clicking it and editing the dialog box to look like the image below. Run the simulation again. Estimate the rise time at point_2 as the time it takes for the waveform to reach 63% of its peak value. Compare this to the product R1*C1.
- Build the RC circuit you just simulated and measure the rise time using the scope. Remember that the accuracy of the resistors you are using is +/-5% and the capacitor is +/-20%, so the actual rise time could be as much as 25% different that the nominal RC product.
- Download the LTspice circuit Passive_axon_R.asc and run it. Plot log(Vnode) versus node number. If the voltage is dropping exponentially, then the plot should be a straight line.
- Build the passive axon, measure the voltages at each node and compare them to the simulation.
This exercise is considered backgound for the next several lab assignments. There will no written lab report from this exercise, but you will need to use these techniques throughout the semester.
August 8, 2011
Copyright Cornell university