Lab exercise 6
Operational amplifiers
Introduction.
Operational amplifiers (opamps) are one of the most widely used circuits in electrical engineering. This lab will introduce several uses for opamps including amplifiers and filters.
Procedure:
It is possible to use standard wav files as input to LTspice simulations. This allows you to input voice, music or ECG signals into your simulated filters before you build the filters and play the wav files through the computer into your actual circuit. You can get some ECG files from http://courses.engr.illinois.edu/bioe415/labs/ecgwav.html, but I have already downloaded them and added noise to them, which you will need to remove with a filter.
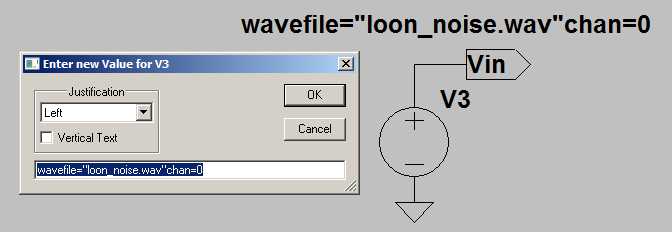
To add a WAV file input to a LTspice simulation, right click a voltage source, then in the DC value field enter: wavefile="ecgwav_noise.wav"chan=1. Note that every time you open the voltage module, the string is erased and has to be re-entered, BUT if you right-click the text instead, you can edit it (see below). More information on using wav files: http://ltspicelabs.blogspot.com/2006/10/using-wav-files-for-io-and-transient.html.
To save a waveform from a simulation as a WAV file, add a spice directive to the simulation by menu Edit>Spice directive..., then in the edit box enter .wave "filename" nbits, sample_rate V(node_name). Where nibts is usually 16 bits and the sample rate is 8000, 16000, or 44100. An example might be .wave "loon.wav" 16 16000 V(Vout).
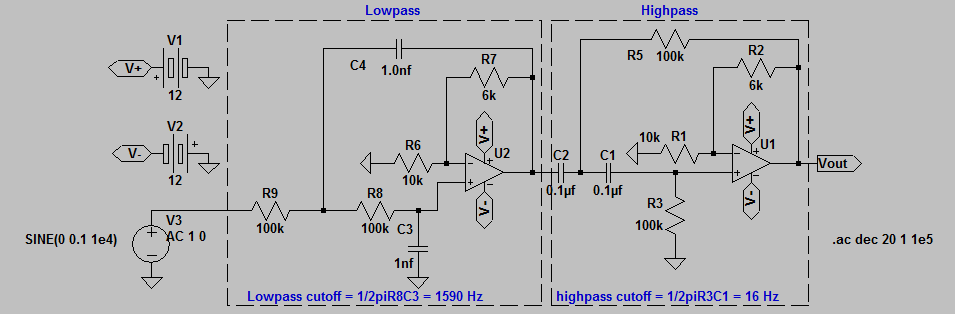
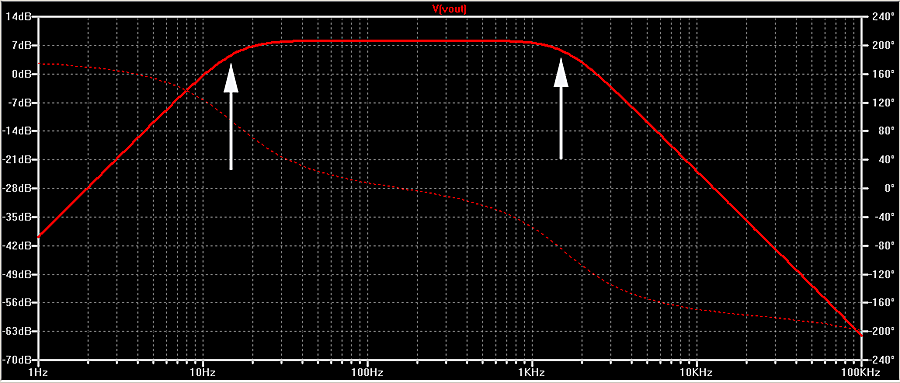
The file VCVS_bandpass_filter.asc displays the frequency response of a bandpass filter with cutoff frequencies at about [16 1600] Hz, marked by the white arrows. The vertical scale (on the left) is a log scale where 20db represents a factor of 10. More precisely displayed_db= 20*log10(amplitude_voltage_out/amplitude_voltage_in) at each different frequency. The dashed line is the phase shift of the sine wave as it passes through the two filters measured in degrees on the right-hand scale. Note for that correct operation R9=R8, C3=C4, C1=C2 and R3=R5.
- Vary the Rs and Cs and see how the cutoff frequencies change.
- Now change the anaysis method to transient (
Simulate>Edit Simulation Cmd... then in the dialog click the transient tab and choose a stop time.). Change the input voltage source to sine and set the frequency to 1600 Hz. According to the phase plot below, the pahse shift should be -90 degrees (the minus means lagging the input). Is it?
- From the graph below, at what frequency(s) should the input and output be in phase? Verify by simulation.
Assignment:
Note
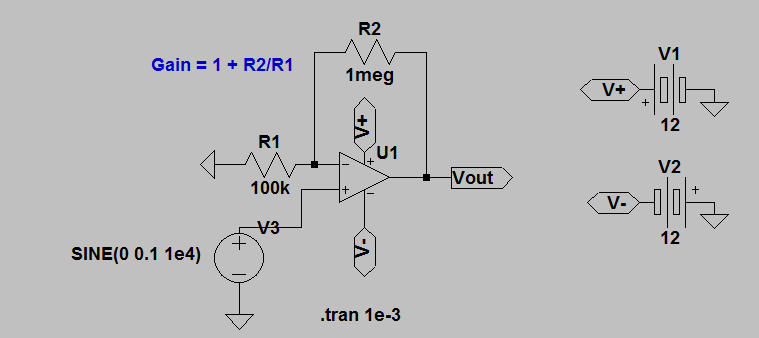
- Build the following noninverting amplifier circuit and show that the gain=11. At what (fairly high) frequency does the gain start to drop below the gain at low frequency? Plot log(gain) versus frequency. What happens to the phase-shift at high frequencies. Use the signal generator as the sinewave source.
- Simulate a filter which cuts off frequencies outside of the frequency range [500 Hz to 2KHz] of the song of the common loon. The recording loon_noise.wav is contaminated with wind noise, mostly below 500 Hz. Design a filter based on
VCVS_bandpass_filter.asc which takes a wav file of the noisy loon call and filters it with a high pass filter at about 500 Hz and a low pass filter at about 2.5 KHz. Save the result of the simulated filter as a wav file and listen to it (and demo to the TA).
- Build the circuit, using the computer to play the wav file and connect the computer audio output to your circuit. Connect speakers to the filter output to listen to the result. Demo to the TA before doing the next exercise.
- Modify the filter you built to remove 60 hz noise from an ECG signal ecg_noise.wav. Output the result to the scope. Notice that there is tradeoff of amplitude accuracy of the fast phase against noise level.
- Be sure to get lots of screen dumps and scope traces for your writeup.
October 24, 2011
Copyright Cornell university