Student evaluations of ECE 4760
The College of Engineering standard online evaluation form asks a bunch of questions about a course. The two questions which best summarize the course (in the eyes of the college) are questions 8 and 13 listed below. I have been tracking the numbers to see how the course compares from year-to-year. However, student free-form comments at the end of the form are much more useful in making the course better. Student participation was around 80% each year, but fell to ~50% in 2014, probably because of the shift to (easier to ignore) online forms.
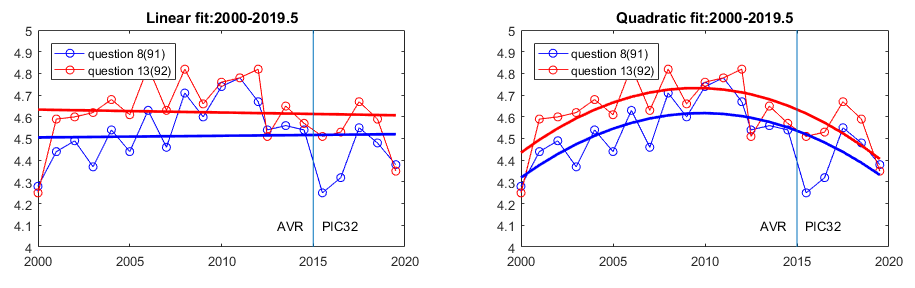
--The plots show data starting at 2000, the first year for which data is available.
The first assumes a linear fit, which is flat within the error in the data.
--
In 2000 the course used assembler. In 2001 the course converted to C.
--
If we assume a quadratic fit instead (to allow a peak below 5.0),
then we get
curves which suggest that course effectiveness is past peak,
but the dispersion in each measurement is probably on the order of the total range of the data.
--
Note also that the course changed from Spring to Fall, and was therefore taught twice in 2012.
Time points ending in 0.5 (after 2012) refer to Fall semester.
--
In 2015, the course started using PIC32 (vertical blue line). Scores dropped a lot. 2017 seems to be recovered.
%ece4760 ratings and scores
clear all
% 2012.5 == fall semester
year = [2000:2012, 2012.5, 2013.5, 2014.5, 2015.5, 2016.5, 2017.5, 2018.5, 2019.5] ;
year_no2000 = [2001:2012, 2012.5, 2013.5, 2014.5, 2015.5, 2016.5, 2017.5, 2018.5, 2019.5] ;
firstdata = 2000 ;
plotend = 2020 ;
q8 = [4.28, 4.44, 4.49, 4.37, 4.54, 4.44, 4.63, 4.46, 4.71, 4.60 4.74 4.78 4.67 4.54, 4.56, 4.54, 4.25, 4.32, 4.55 4.48, 4.38] ;
q13=[4.25, 4.59, 4.60, 4.62, 4.68, 4.61, 4.83, 4.63, 4.82, 4.66 4.76 4.78 4.82 4.51, 4.65, 4.57, 4.51, 4.53, 4.67 4.59, 4.35];
q8_no2000 = [ 4.44, 4.49, 4.37, 4.54, 4.44, 4.63, 4.46, 4.71, 4.60 4.74 4.78 4.67 4.54, 4.56, 4.54, 4.25, 4.32, 4.55 4.48, 4.38] ;
q13_no2000=[ 4.59, 4.60, 4.62, 4.68, 4.61, 4.83, 4.63, 4.82, 4.66 4.76 4.78 4.82 4.51, 4.65, 4.57, 4.51, 4.53, 4.67 4.59, 4.35];

mean(q8)
mean(q13)
mean(q8_no2000)
mean(q13_no2000)
figure(1);clf;

%================================================
subplot(2,2,1)
plot(year, q8, 'bo-')
hold on
plot(year, q13, 'ro-')
set(gca,'xlim',[2000 plotend])

[p13,s13]=polyfit(year,q13,1);
[y, deltay] =  polyval(p13,year,s13) ;
plot(year, y, 'r','linewidth',2)
legend('question 8(91)', 'question 13(92)','location', 'NorthWest')
[p8,s8]=polyfit(year,q8,1);
[y,deltay] = polyval(p8,year, s8);
plot(year, y, 'b','linewidth',2)

title(['Linear fit:2000-', num2str(year(end))])
set(gca,'ytick', [0:.1:5])
set(gca,'ylim', [4 5])
line([2015 2015],[4 5]);
text(2013 ,4.1,'AVR     PIC32')
%=================================================
subplot(2,2,2)
plot(year, q8, 'bo-' )
hold on
plot(year, q13, 'ro-')
set(gca,'xlim',[2000 plotend])


[p13, s13] =polyfit(year,q13,2);
[y, deltay] = polyval(p13,year, s13);
plot(year,y,'r','linewidth',2)
legend('question 8(91)', 'question 13(92)','location', 'NorthWest')
p8=polyfit(year,q8,2);
plot(year, polyval(p8,year),'b','linewidth',2)
title(['Quadratic fit:2000-', num2str(year(end))])
set(gca,'ytick', [0:.1:5])
set(gca,'ylim', [4 5])
line([2015 2015],[4 5]);
text(2013 ,4.1,'AVR     PIC32')
%=================================================
return
%===============================================
subplot(2,2,3)
plot(year_no2000, q8_no2000, 'bo-')
hold on
plot(year_no2000, q13_no2000, 'ro-')
set(gca,'xlim',[2000 plotend])

[p13_no2000,s13_no2000]=polyfit(year_no2000,q13_no2000,1);
[y, deltay] =  polyval(p13_no2000,year_no2000,s13_no2000) ;
plot(year_no2000, y, 'r','linewidth',2)
legend('question 8(91)', 'question 13(92)','location', 'NorthWest')
[p8_no2000,s8_no2000]=polyfit(year_no2000,q8_no2000,1);
[y,deltay] = polyval(p8_no2000,year_no2000, s8_no2000);
plot(year_no2000, y, 'b','linewidth',2)

title(['Linear fit:2001-', num2str(year(end))])
set(gca,'ytick', [0:.1:5])
set(gca,'ylim', [4 5])
line([2015 2015],[4 5]);
%=================================================
subplot(2,2,4)
plot(year_no2000, q8_no2000, 'bo-' )
hold on
plot(year_no2000, q13_no2000, 'ro-')
set(gca,'xlim',[2000 plotend])

[p13_no2000, s13_no2000] =polyfit(year_no2000,q13_no2000,2);
[y, deltay] = polyval(p13_no2000,year_no2000, s13_no2000);
plot(year_no2000,y,'r','linewidth',2)
legend('question 8', 'question 13','location', 'NorthWest')
p8_no2000=polyfit(year_no2000,q8_no2000,2);
plot(year_no2000, polyval(p8_no2000,year_no2000),'b','linewidth',2)
title(['Quadratic fit:2001-', num2str(year(end))])
set(gca,'ytick', [0:.1:5])
set(gca,'ylim', [4 5])
line([2015 2015],[4 5]);