For our ECE 4760 final project, we designed and built a bicycle dashboard which displays the cyclist’s pedaling power, speed, cadence, and distance to enhance training.
The major motivation of this project was to replicate a commercial product at a dramatically reduced price point. A commercial power meter costs around $1000 for just the instrumented pedal arm and does not even include the display price. The price of one of these instruments is exceedingly more than the majority of people spend on the bicycles. As a result these devices are really only available to professional cyclists as the cost is too prohibitive. While the price is very high, there are a large number of benefits to having this information. The power information can be easily integrated to obtain total energy exerted during a workout. An average cyclist only has access to distance and time information which they use to compare workouts. This method is inferior to a power measurement where the actual intensity of the workout can be quantified. An example of a use of a power meter is interval training. Being one of the most efficient training methods, the cyclist performs short bursts of high intensity training at set intervals with longer periods of easier recovering. With the addition of a power meter, a rider can quantify these high and low intensities and make sure that they are keeping the correct intensities across a workout as well as monitor progress over time.
High Level Design top
Rationale
The major motivation for this project came from Mark’s interest in cycling. This was the first idea we came up with as a group and as it sounded reasonable and achievable we decided to stick with it. This project had the direct benefit to Mark that he could train using target powers while not being broke as the cheapest meter available costs almost as much as his bike. In addition to being useful to Mark on his bike, Brian saw other similar uses for the project for the Baja SAE team in the future. The project could easily be adapted to monitor driveshaft torque in the Baja SAE vehicle to determine shock loading on jump landing loadcases under full throttle which is where we sometimes see failure. Almost all the project could be recycled for this, only replacing the display with a CAN transceiver to interface with the current data logger on the vehicle.
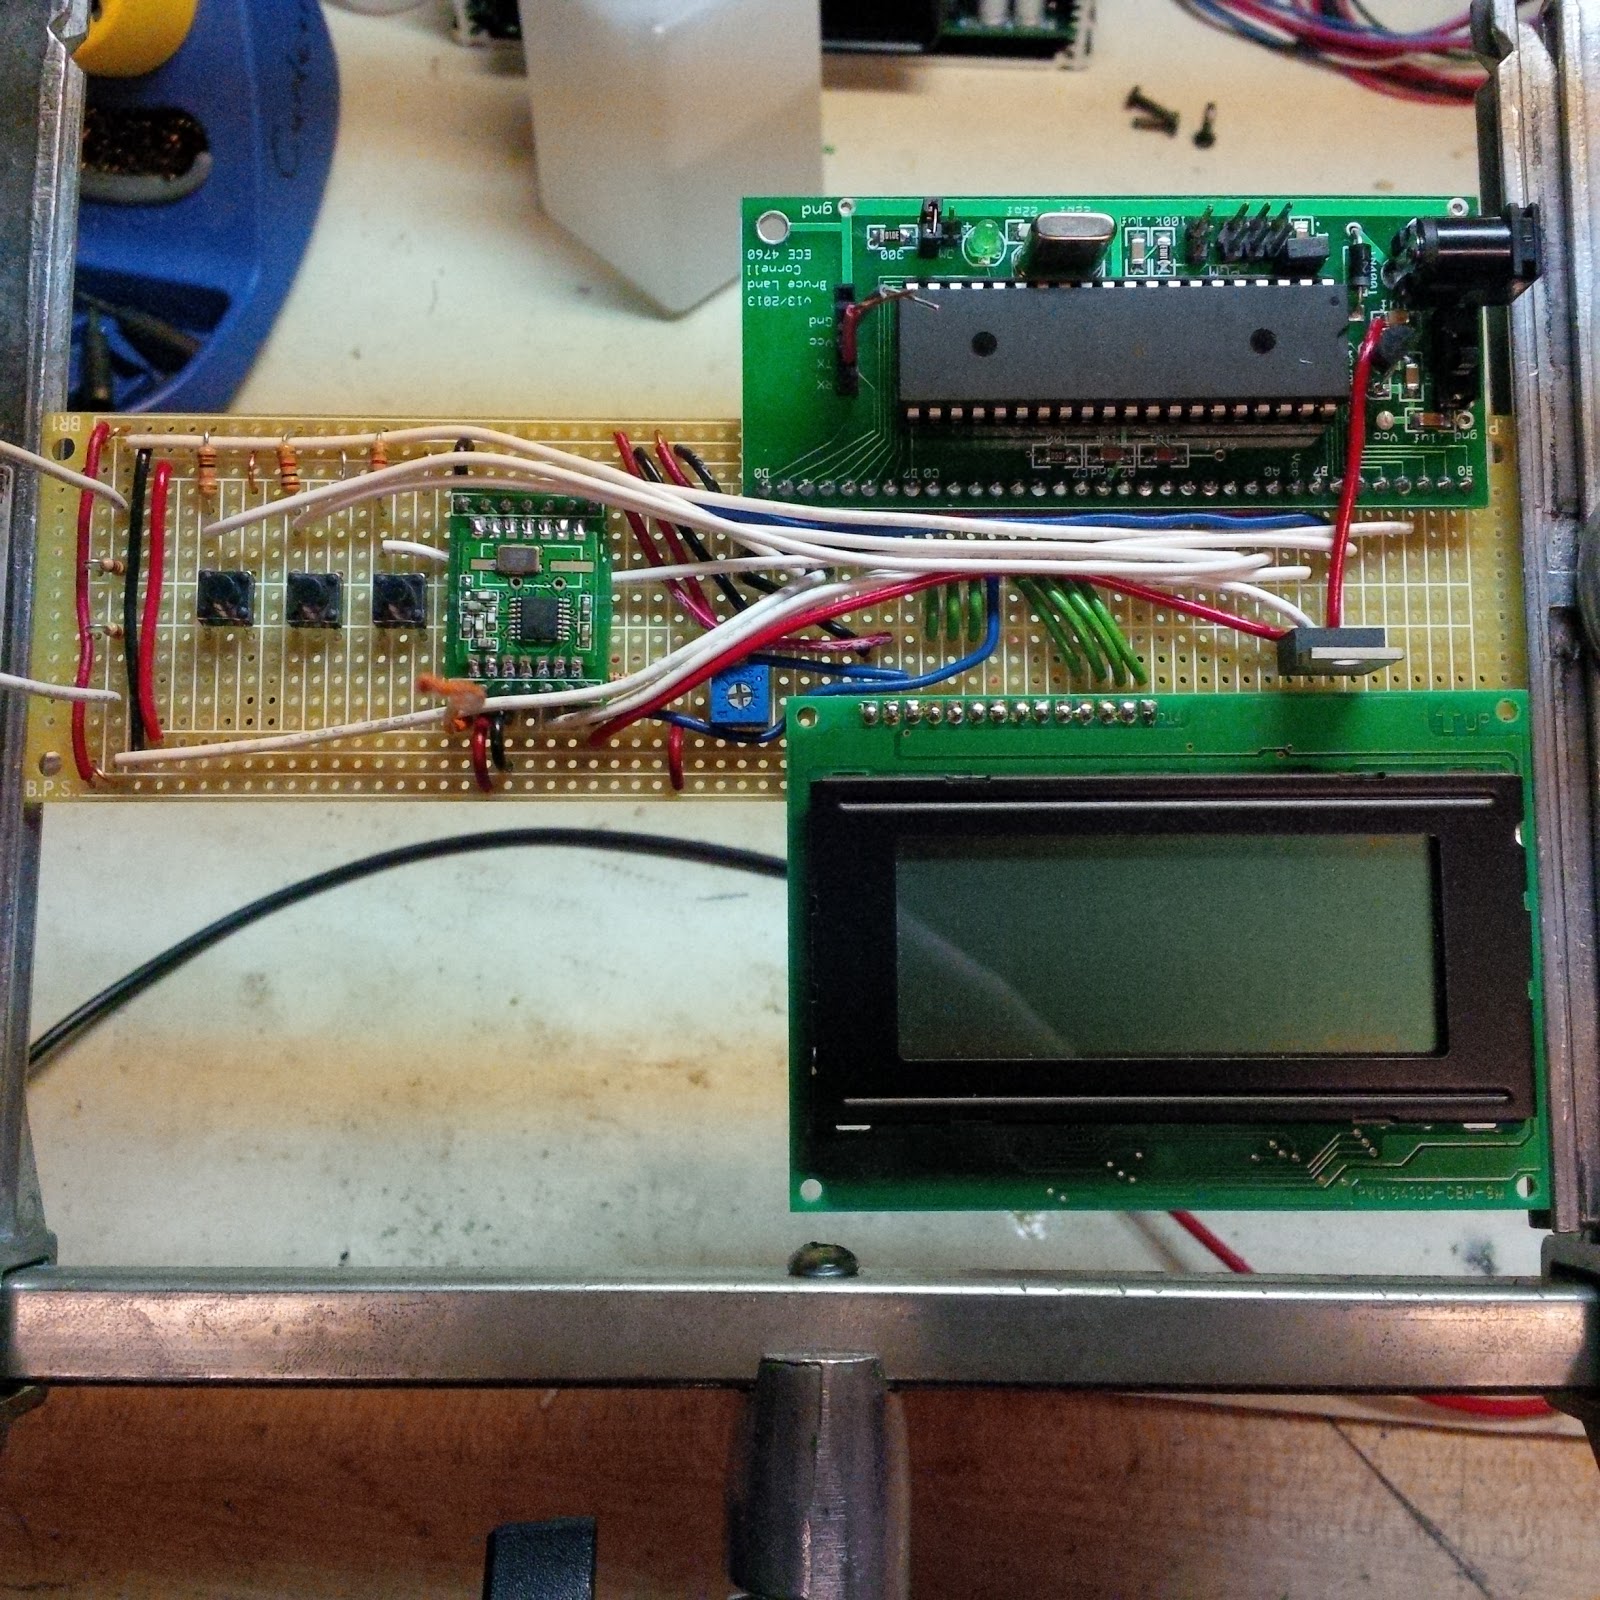
Dash display board
Logical Structure
The entire system is composed of two modules. One is the battery powered pedal arm module which measures the cyclist torque and transmits this wirelessly to the display module. The display module receives the torque data from the transmitter and also reads in pulses from the rear wheel and pedal arm to calculate distance, cadence, and power. Most of these processes run asynchronously and the display is periodically refreshed with new data.
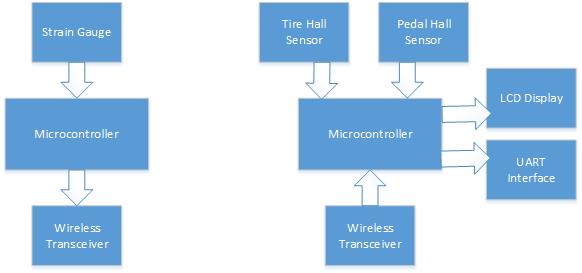
High-level hardware block diagram
We implemented the design in phases. First we designed the wireless transmitter board. This was a custom 1 sided PCB. The first thing we got working was sending bytes using hardware SPI. After we were confident in our ability to use SPI we began initializing the transceivers and sending bytes between modules. Once we got the transmitter sending bytes we figured out how to send a float between the two modules. Next was obtaining the actual torque measurement. A strain gauge was bonded onto a pedal arm and wired into the board’s amplification circuit. This circuit was debugged and amplification tweaked until we had a suitable output. The next step was to implement the receiver code and calculate wheel and pedal RPMs. Once we were receiving these values glitch free and verified this over the terminal using UART we started implementing the display. At this point all that was left to do was display our values in a readable format on the character display. In reality accomplishing these tasks was very difficult due to the limited debugging abilities of these microcontrollers and tricks of the wireless module and strain gauge.
Hardware and Software Tradeoffs
There were many tradeoffs to be made with the design. The biggest tradeoff was with the PCB design of the transmitter. Because we were making it in house we had to make a lot of compromises to make manufacturing easier. Component count was simplified which yielded lower SNR which we compensated for by adding larger moving average filters.
In an effort to avoid aliasing and avoid having to sample the ADC as much we added hardware cutoff filters to reduce the torque frequency to a few hundred hertz
Because the baud rate of the wireless modules was limited and transmitting wireless data consumes lots of power and we wished to rely on small batteries on the transmitter we decided to only transmit statistics of the torque rather than the instantaneous values
Additionally we used a software interface to send the data over wireless instead of a mechanical interface. Two such options would be a mechanical slip ring or a rotary transformer. Each of these solutions would have enabled us to eliminate all wireless connections and sample the data at a much faster rate. As we only needed the average torque value for power we chose to use the wireless transmitter as it is cheaper and simpler.
Dedicated hardware was used to condition the strain gauge signal as the ADC on the microcontroller had nowhere near the required accuracy. Also, the differential connections had a much higher common mode rejection than could have been achieved through digital filtering alone.
Background Math
There are many ways to measure or estimate the power the rider is transferring to the crankset. One generally has to obtain a torque or force in order to derive power. This can be done either by estimation or direct measurement. An estimation approach would involve measuring angular acceleration while knowing inertia or measuring linear acceleration knowing mass and integrating these measurements to obtain the torque or force. While these methods can sometimes be accurate, they are generally but inferior to direct measurement as they are only an estimation. Such devices exist that estimate power but they fall within a lower price range which was not the goal of this project.
As such we decided to directly measure the force exerted on the pedal arm. We can determine the force by measuring the strain on the pedal arm. A common method of measuring strain is by the use of a strain gauge. A strain gauge is applied to a material and when stressed, the resistance of the gauge changes according to a Gage Factor which is a property of the geometry of the gage and is given by equation 1.
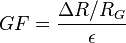
Equation 1
Where ᐃR is the change in resistance of the gauge and RG is the gauge resistance
Most gages have a gage factor of close to two. The gauge is applied to the top or bottom of the pedal in order to measure either the. tensile or compressive stresses in the arm. When the cyclist puts their weight on the pedal the pedal arm is stressed which creates a strain or flex in the arm. As the arm strains, the gauge changes resistance. The gauge is wired into a wheatstone bridge allows us to convert the change in resistance to a proportional voltage. This voltage is given by equation 2 since we have a quarter bridge wheatstone bridge with only one active gauge.
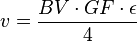
Equation 2
Where BV is the bridge excitation voltage

Figure 1: With strain gauge located at R2
This voltage is proportional to applied force on the pedal and a linearization can be done for any pedal arm geometry. Once the component of the pedal force acting normally to the arm is known, the crank torque can be found by equation 3.

Equation 3
This just factors in the lever arm of the pedal arm. The last parameter to measure is the angular velocity of the crank. This is done using a hall effect sensor and a timer to measure cadence. Equation 4 relates the number of timer counts into an RPM.

Equation 4
Finally, power in watts can be simply found as the product of our measured torque and angular velocity shown in equation 5.

Equation 5
Intellectual Property
There is a patent (US 7806006 B2) that shows a similar system for measuring torque of a crank arm and converting that to the power measurement. Their system is all self contained within the crank while ours it an exterior addition to an already existing crank arm. Our design also only measures torque on one side while the patent receives torque measurements from both crank arms.
We are also aware that there are many products already on the market designed to give power information back to the rider. The designs are third party cranks or pedals that have the gauges integrated or use some other technique to estimate power output, our design is a way for poeple to add thier own strain gauge to an existing crank.
Hardware top
Hardware Overview
Our choice of microcontroller was the ATmega1284p because this was familiar to us from class and we knew that the libraries for UART and the LCD code would work. Without much work, this should easily be able to be modified to use other 8-bit atmel AVR microcontrollers. A lower power device could be used to save battery life as long as it is still able to support the peripherals used.
The pedal arm transmitter has a few components. There is the switched mode power supply which is a buck converter stepping the battery voltage down to 3.3V to save power in the design to increase battery life. This also keeps all the logic levels the same. This one rail power everything on the board, the amplifier, micro, and transmitter. The microcontroller runs at a reduced speed of 8 Mhz because of the lower supply. The wireless transmitter runs off 3.3V as well. The wireless uses an SPI interface to communicate with the micro. We chose a hardware SPI interface for speed, one must be careful to add an external pullup resistor to the chip select line to avoid bus contention with the programmer though. The antenna was just connected to a 3” piece of wire as this is adequate enough for our short range.
The strain gauge circuitry is a little tricky. It consists of half of a wheatstone bridge being completed on the board and being fed to the inverting input of an instrumentation amplifier. This voltage is set at half the bridge voltage. The other half of the bridge is completed externally with a strain gauge and a completion resistor. This is fed to the non-inverting input. The amplifier has a gain set at roughly 200 times which was determined empirically and is based around the stiffness of the pedal arm and the forces applied to it. The amplifier finds the difference in the two voltages, cancelling out common mode bridge voltage noise and amplifies this difference 200 times. This value is then biased around half the supply voltage so as to be able to read positive and negative strain with respect to ½ Vcc. The output of the amplifier is fed to the microcontroller through an RC filter with a 100 Hz cutoff frequency.
Finished pedal arm
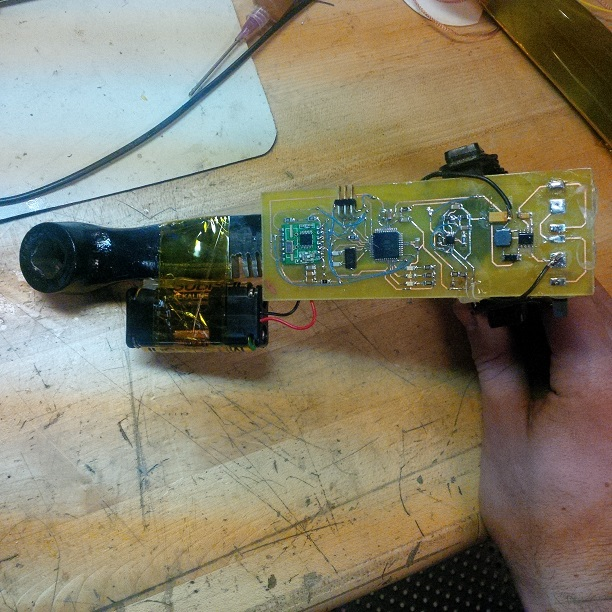
The wireless receiver and display were based around the ATmega1284 as well but in a different form factor. The design was put on a protoboard to be rugged but since it is not rotating around and had less space constraints a custom pcb was not designed. The receiver consists of the same transceiver operating over hardware SPI. Additionally there is a 16x4 character display connected over a parallel interface with contrast controlled through a potentiometer. There are also screw terminals to connect the hall effect sensors to the board. These sensors have a pullup resistor to power and under a magnetic field of the correct polarity the sensors pulls the output low. There are magnets glued onto the wheel spokes and the pedal arm which trigger the sensors every revolution

Crank-arm transmitter board w/ testing leads
The most difficult part of this project to replicate will most likely be the mounting of the strain gauge. We used a unidirectional gauge aligned along the pedals long axis on the top face which is in tension under applied pedaling force. This is a 320 Ohm gauge which reduces power draw slightly over a common 120 Ohm gauge. The pedal originally had no suitable surfaces to bond the gauge to so a flat was machined onto it on a mill. The flat also served to weaken the pedal by reducing the cross sectional area of the beam. Additionally, the pedal arm came from a very cheap bike and was built with a large factor of safety in mind. As a result of it being cheap, the arm was steel and not aluminum, which means it is much stiffer and will give a much smaller reading with the strain gauge. In an effort to counteract this the pedal arm was also thinned out on the bottom to raise the stress in the center of the arm. This was done with an angle grinder. The cross sectional area of the arm was almost halved as can be seen in the photograph.
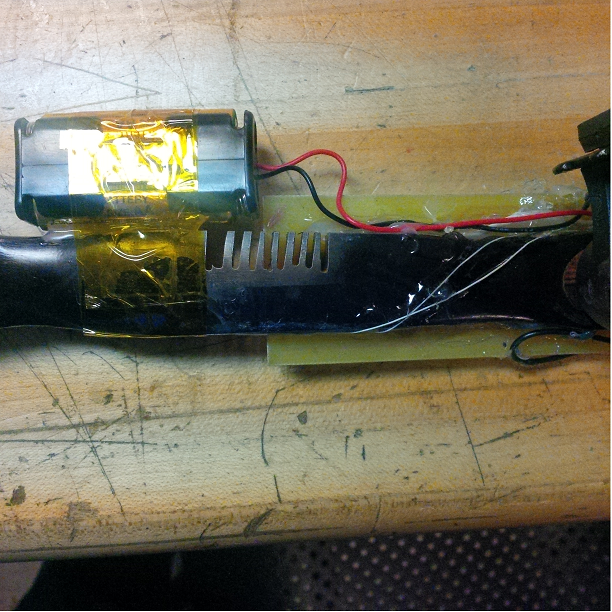
Feathered arm to decrease stiffness underneath the gauge.
The next step is to actually bond the gauge. Bonding strain gauges requires special care and attention. A strict policy has to be followed to ensure reliable bonding every time. Generally a kit is used which contains all the necessary degreasers, catalysts, pH indicators,neutralizers, adhesives, etc. These kits cost hundred of dollars and we cannot afford one so we were forced to improvise.

Strain gauge bonded onto the top of arm.
Here is the simplified method I came up with for bonding gauges:
- Sand the surface with increasing grit of sandpaper from 200 to 600 grit. This removes all machining marks and smooths out the surface for bonding.
- Remove all contaminants from the surface using rubbing alcohol and a lint free cloth
- Find a clean pair of tweezers and remove the gauge from the packaging.
- Set it right side up (with the solder contacts facing away from the sticky side) on a clean surface.
- Take a piece of Kapton tape and pick up the gauge off the clean surface with it making sure not to wrinkle it at all
- Align the gauge onto the clean workpiece in the final position.
- Peel up on the tape until the gauge is fully showing but the rest of the tape is still on.
- Take generic superglue and squirt a dab onto the base of the gauge.
- Take your thumb and squeeze the gauge back down flat pressing the glue across the entire gauge. Make sure not to wrinkle anything or else the gauge wont work
- Because we are too poor to afford catalyst at this point you should hold the gauge under your thumb for atleast a few minutes, I did a half of an hour.
- Wait a few hours atleast before you remove the tape to be sure the super glue has cured in time.
- Once the gauge has cured run very small AWG wire (I did 30) to the solder pads on the gauge and back to the board.
- 5 Minute epoxy the gauge to protect it will still allowing it to deform and also epoxy the wires down to prevent them from moving.
Software top
Overall Design
During the software design process there were a few processes that were tricky for us to get working. The first and most difficult was getting the wireless transceiver code working. The problems we encountered here was that to make sure you were transmitting correctly you need a working receiver and to make sure you’re receiving the correct information you need to know the transmitter is working. The programming guide for the transmitter we chose was not as informative as we would have wanted, however, we were able to find alternative sources of information about setting it up online.
The next problem encountered was how to send a float variable over wireless. After reading about the topic, Brian remembered that we could use a C Union to store a float and length 4 char array in the same memory location. Breaking the float into chars allowed us to send it byte-wise over wireless. This worked in our case because we knew that beforehand that the endianness of both microcontrollers were the same. If we were connecting to an unknown device, we would have had to find another way to encode the float in bytes so it would be able to be decoded correctly on the receiver side. This problem would easily be fixed if we had better debugging tools to be able to look into memory to see how the float was stored in memory when we first tried using pointers to access it byte-wise. Figure 2 shows a diagram of this.
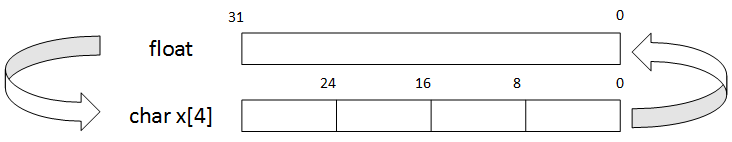
Figure 2: Converting float to send
The final difficulty was with the asynchronous nature of the program. On the receiver board all of the information is received on interrupts. There are the 2 Hall Sensors and the transmitter creates an interrupt each timer a byte is received. In addition to that Timers 1, 2, and 3 have overflow interrupts that trigger different counters or resets. There was a lot of setting up and making sure that everything was set up correctly with the timers and interrupts.
Reference design/code
We referenced the programming guide for the RFM12B written by Hope RF. This guide wasn’t completely clear to us so we searched and found another startup guide for the RFM12B with AVR (RFM12B and AVR — quick start). We modified this code to use hardware SPI instead of software, as well as triggering an interrupt when a byte is received instead of polling. We also removed the preamble and dummy bytes after we figured out they were not needed. The last small change is that we used 915 MHz instead of the frequencies used in the example code. Example code from the ECE 4760 website as well as past labs were referenced when needed throughout the process of building the dash.
We referenced a common site template that many groups have used in the past. This template originates back to the Human Tetris project from 2010.
Results top
Failed Attempts
At first we planned to use a half bridge strain gauge configuration for better temperature compensation and improved sensitivity. With this the gauges were not reliably responding to stress. We were not 100% sure what was causing the problem, so we decided to fix it by replacing the 2 gauges with one larger gauge. This was simpler and worded in worked in the end.
We planned to have the crank circuit be disconnectable to have the ability to remove the board and ride without it if needed. This removable connection was not reliable enough and caused changing of resistances that caused the bridge configuration to behave erratically when any wire was moved. To fix this we connected the gauge directly to the board and bonded the wires to the crank to stop movement.
Finally we planned on using coin cell batteries and a switched mode power supply, but the batteries did not yield enough run time. A battery pack with 2 AA’s was used instead.
Speed of Execution
We had no problems with the speed of execution of our design. The main factor is that all of the external interrupts are on the human scale of time. At 46 mph the tire will still only be going at 600 rpm. The micro is running at 8M MHz, so there is a huge amount of time between interrupts. Another way to make sure everything ran smoothly was to transmit the torque statistics instead of raw data. This allowed us to only transmit torque data at 4 Hz and not clog up either microcontroller.
Accuracy
With the timer prescaler set to 1024, each clock tick when counting the pedal and tire periods account for 1/7812.5 of a second. Our measurements range from 1-600 rpm and this accuracy is more than enough for the intended purpose.
Below are sample outputs from a short test. The values were averaged with a 10 sample MA filter to smooth the data. This whole test is done within the same gear ratio on an indoor trainer so the curves follow each other. While on the road these curves will behave differently.

Sample speed graph

Sample cadence graph
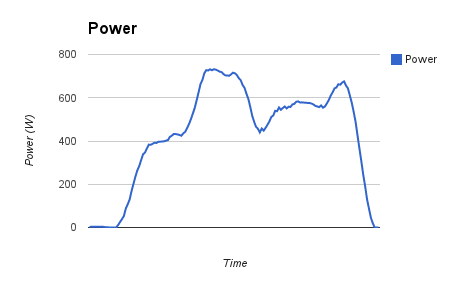
Sample power graph
Safety
Our design does not use any high voltages other than the 12V power supply used for the prototype board. These are all also running on low currents that do not pose a risk to the user. The main board could have also been run off batteries to limit the need for a 12V supply and make the whole design even safer.
RF and Noise Interference
Interference from the outside could affect our design in 2 ways. Other devices operating at the same frequency could interfere with our transmissions, and outside noise affects the ADC reading. We handled the first problem by setting a small frequency offset to greatly lower the chance that someone was operating at the same one. The second problem was solved by adding a shield to the board to reduce outside noise affecting the ADC.
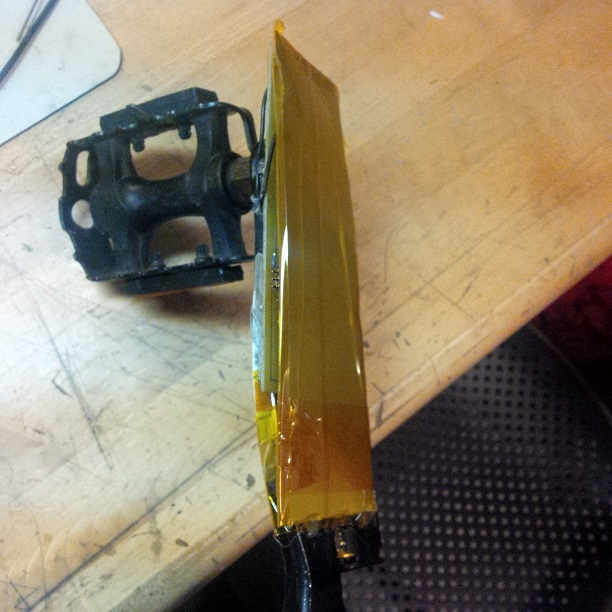
A piece of aluminum used as shielding between the bicycle and pedal arm
Usability
Anyone with the ability to properly apply a strain gauge to their crank would have the ability to create this dash and use it while training. There is not much else that someone would need to be able to use our design.
Conclusions top
Potential Changes
In the end, our design was a good proof of concept for making a cheap power meter and dash. It works as expected and provides fairly accurate information useful to any cyclist during training. There are some changes that we would definitely make if starting from the beginning again.
- Using better resistors to account for thermal resistance changes that affect the calibration for the power measurements. Along this same line of thinking, we would use trim pots to allow for betting zeroing of the bridge configuration. This would allow us to increase the gain and have a larger range of operation for strain measurements. We would also plan on using sheer gauges to protect them from the foot of the rider. We would also make sure that these gauges are matched to whatever material the crank is that the board is designed for.
- We would also plan on changing the power consumption of the crank board. Using a low power micro, such as an ATtiny, as well as adding code to enter a low power mode after extended periods of no use would allow us to extend battery life for a more desirable usage time. A goal of 200+ hours of active operation would be desirable.
- More changes would include getting a board printed out of house. This would allow us to make it 2 sided and fit it into a much smaller form factor. Adding an RF shield to the analog circuit from the beginning to protect from radiation would also be desired. Finally adding an actual enclosure to protect the board from the elements so it can be used outside.
Ethical Considerations
As with every project, conforming to the IEEE Code of Ethics is a priority throughout the project.
As engineers we are tasked with the responsibility for ensuring that the things we design will not cause harm to users. This should be true in een the most extrevme circumstances. For our project we had to weaken the pedal arm of the bike to increase the sensitivity of the instrument. In doing so we lowered the safety factor on the part. We made sure not to weaken it any more than it came from the factory by ensuring the weakened part was still stronger than the base of the pedal arm. This ensures that a rider of any weight and any impact load should not yield the arm, potentially causing harm to the user. Lacerations could be a possibility if there was a fracture or if the rider was going fast a sudden breakage could throw them off and make them crash.
There are no possible dangers with our product as it does not structurally compromise the bicycle however we could have a disclosure towards people regarding modifying their own bicycle cranks that although it will increase the sensitivity, it will weaken the part. There are no environmental concerns with this other than the lithium batteries we are using which are contained in the device.
We were as respectful of others as we could be in lab. Unfortunately our project was very loud as the bike and trainer made lots of humming noises. It was a necessity to test in lab since we did not have access to a programmer but we kept it to a minimum.
Our device displays information to the user while riding a bike so it was required to make sure it did not distract the user while riding. We make an easy to read display, and limited control to keep the users attention on the road and safe. Right now the dash protected from the elements so inside training would be reccomended, which is safer for the user.
Legal Considerations and the FCC
The frequency of operation (915 MHz) falls within one of the 3 unlicensed ISM bands (902 to 928 MHz) as stated by FCC Part 15. We are also transmitting at 4dB which is well below the threshold allowed. This frequency range is only allowed in Region 2 which includes the Americas. This specific design would need to be changed for use elsewhere in the world.
Appendices top
A. Parts List
| Item | Vendor | Part Number | Unit Cost | Quantity | Total Cost |
|---|---|---|---|---|---|
| Differential Amplifier INA331 | Digikey | XXX | 2.64 | 1 | 2.64 |
| ATmega1284P | Digikey | 1201 | 5.00 | 2 | 10.00 |
| AA Battery | Found | - | 0.60 | 2 | 1.20 |
| AA Battery Holder | Found | - | 2.50 | 1 | 2.50 |
| Hall Effect Sensor | Digikey | - | 1.80 | 2 | 3.60 |
| PCB | Fabricated | - | 1.00 | 1 | 1.00 |
| 16x4 Character LCD | Cornell Lab | - | 8.00 | 1 | 8.00 |
| Pushbutton | Found | - | 0.25 | 3 | 0.75 |
| 2" Solder Board | Cornell Lab | - | 1.00 | 1 | 1.00 |
| Protoboard | Cornell Lab | - | 2.50 | 1 | 2.50 |
| Power Switch | Found | - | 1.00 | 1 | 1.00 |
| RFM12B Wireless Transceiver | Ebay | - | 6.00 | 2 | 12.00 |
| Strain gauge | Found | - | 5.00 | 1 | 5.00 |
| 8 Mhz Oscillator | Digikey | - | 0.72 | 1 | 0.72 |
| Programming header 3x2 | Found | - | 0.30 | 1 | 0.30 |
| 10k Potentiometer | Cornell Lab | - | 0.50 | 1 | 0.50 |
| 5V Regulator | Found | - | 1.00 | 1 | 1.00 |
| Screw Terminals | Cornell Lab | - | 1.00 | 3 | 3.00 |
| Microcontroller Board | Cornell Lab | - | 4.00 | 1 | 4.00 |
| Total | 59.71 |
Created with help from HTML Table Generator
B. Source Code
All of our source code can be found here.
Schematic images can be found here.
C. Division of Labor
| Brian | Mark |
|---|---|
| Designing/building circuit board | Overall software architecture |
| Crank modification | Website construction |
| Software debugging | Software debugging |
Created with help from HTML Table Generator
References top
This section provides links to external reference documents, code, and websites used throughout the project.
Datasheets
References
Background Info
Acknowledgements top
We would like to thank Professor Bruce Land for teaching an amazing course, and the lab TAs, especially Alex Jaus, for all their help this semester.