Sonar Echolocation Ranger
Evan Kravitz (esk95@cornell.edu), Rajiv Kommareddy (rrk64@cornell.edu), David Yang (dhy9@cornell.edu)
Cornell University, ECE 4760, Fall 2018
Speaker and Microphone Holder Design
Testing/Debugging Methods and Observations
Intellectual Property Considerations
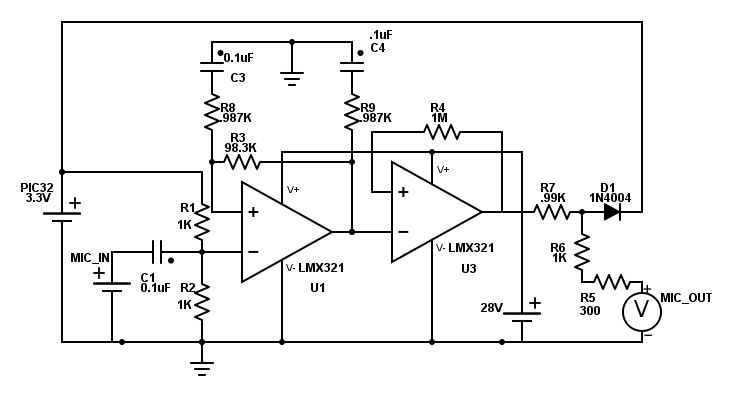
Schema 1: Microphone double-amplifier circuit
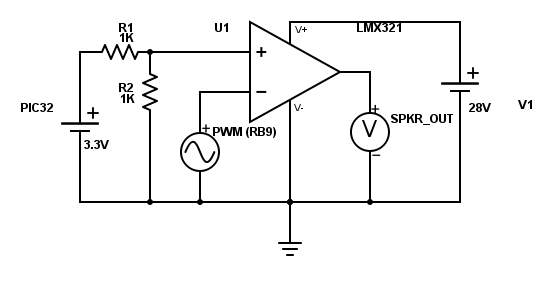
Schema 2: Speaker single-amplifier circuit
Appendix D (Budget Considerations)
The Sonar Echolocation Ranger (SER) is a biologically-inspired multimode echolocation system that can detect an object up to 1.5-2 m away and compute object distances within 土2 cm of accuracy. It displays a distance with a rudimentary virtual reality interface (distance mode), and can monitor a surface to detect and report any perturbations (perturbation mode). SER has possible applications is seismology, civil engineering, surveying and robotics. Using six transducers in total—three for the speaker and one for each of the three microphones—we outputted PWM pulses of 25 kHz at a pulse rate of approximately 33 Hz and used the time delays between the speaker output and microphone inputs to calculate our distance measurements.
We believe that the safety of those who use the SER is paramount. As such, it is important to always take the safety considerations into mind when using our product.
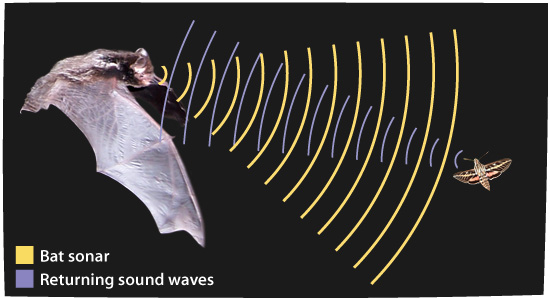
The inspiration from our project comes from animals who are able to use high-frequency tones to acquire information about their surroundings. Some bat species are able to contract their larynx in order to produce ultrasonic clicks which get reflected off surrounding objects.[1] Bats use the time delay to receive the echo as a measure of the distance an object of interest is (a nearby wall, insect, etc.). For our SER, we wanted to mimic the natural processes of bats in order to localize object distances, and to detect disturbances in 3D space. Furthermore, we wanted to make this technology highly accessible through a portable virtual-reality system.
Figure 1: Depiction of ultrasonic emission and reflection in bats.
Our project relies on sound to detect object distances and disturbances in 3D space. Sound is a longitudinal waveform existing in mediums such as air. The speed of sound at 20 °C is 343 m/s. One important property of sound waves is that the speed of sound is independent of the frequency of propagation, which means that echo times are independent of the frequency spectrum of the reflected sound. Although the speed of sound doesn’t depend on the frequency of sound, the ability for sound to reflect off objects greatly depends on the frequency of emission (as well as the object that reflects the sound).
When the wavelength of sound greatly exceeds the size of an incident object, the echo wave is small in amplitude and difficult to detect from a distance. This is because the whole waveform, due to its large length, is not able to get completely reflected off the object. However, when the wavelength is much smaller than the size of an object, the whole waveform is able to get reflected off an object. The equation  encapsulates the relationship between sound speed, frequency, and wavelength (
 is the speed of sound,
  is the frequency, and
  is the wavelength). Thus, in order to produce small-wavelength waves, it is necessary to increase the frequency of the sound. Ultrasonic sound waves have become popular in echolocation because of the high-frequency waves’ ability to reflect off objects, and is a reason why ultrasonic waves are used in our project. 25 kHz sound waves correspond to a wavelength of roughly 1.3 cm, which defines a rough lower-bound estimate of the sizes of objects our system can detect.
The ability for sound to reflect off objects is also dependent on the material of the object. For instance, most soft clothing fabrics are poor at reflecting sounds. This is because in soft materials, sound undergoes reflection instead of transmission. For our project, we intend to use SER to detect distances of hard objects, since the intensity of the reflection is higher for hard objects than for soft objects.
The rate at which the intensity of sound degrades as it passes through air also depends on frequency, as well as environmental properties of the air. Generally speaking, as the frequency of sound increases, its attenuation in air also increases. Due to this, we chose a relatively low ultrasonic frequency (25 kHz). Although higher frequency waves can be reflected off objects, the attenuation would be too large to render this frequency for echolocation viable.
Another theoretical area of interest for our project is the speaker and microphone design. In order to generate concentrated bursts of ultrasound in a specific direction, we had to study different transducer topologies. One important finding of our research was that equidistant phased-array transmission, wherein each sound source is separated by a wavelength, optimizes the amplitude of the central sound lobe (as well as minimizes its width). In order to exploit this property of sound propagation, we arranged our transducer in an equilateral triangle configuration where the distance of separation of the transducers was roughly equal to a wavelength.
The number of microphones to use for our project also has important theoretical consequences. If we were to use one microphone and one speaker, then we would be able to detect pointwise distances and pointwise perturbations. In other words, if the point that reflects the sound were to move, a single microphone would be able to detect this movement. However, one microphone would be insufficient for detecting if a face of an object were to change orientation. This is because the pointwise distance between a speaker and a single point on an object face can stay constant even though the object face is being rotated. Since it is necessary to use three echo times to determine planar movements, we use three microphones in our system. This gives us improved robustness in perturbation detection, as well as improved accuracy in distance measurement.
There are 3 main components to our project: software, circuitry, and hardware design.
The software component of our project interprets and converts the filtered and amplified microphone signal into object distances and perturbation predictions, produces the PWM speaker input, and handles the VR interface.
There are 3 main subcomponents to the circuitry module of our project. We have an amplification circuit for the ultrasonic speaker, a circuit for amplifying and high-pass filtering the microphone signals to be used by the microcontroller, and a circuit for managing power to the amplifiers and microcontroller.
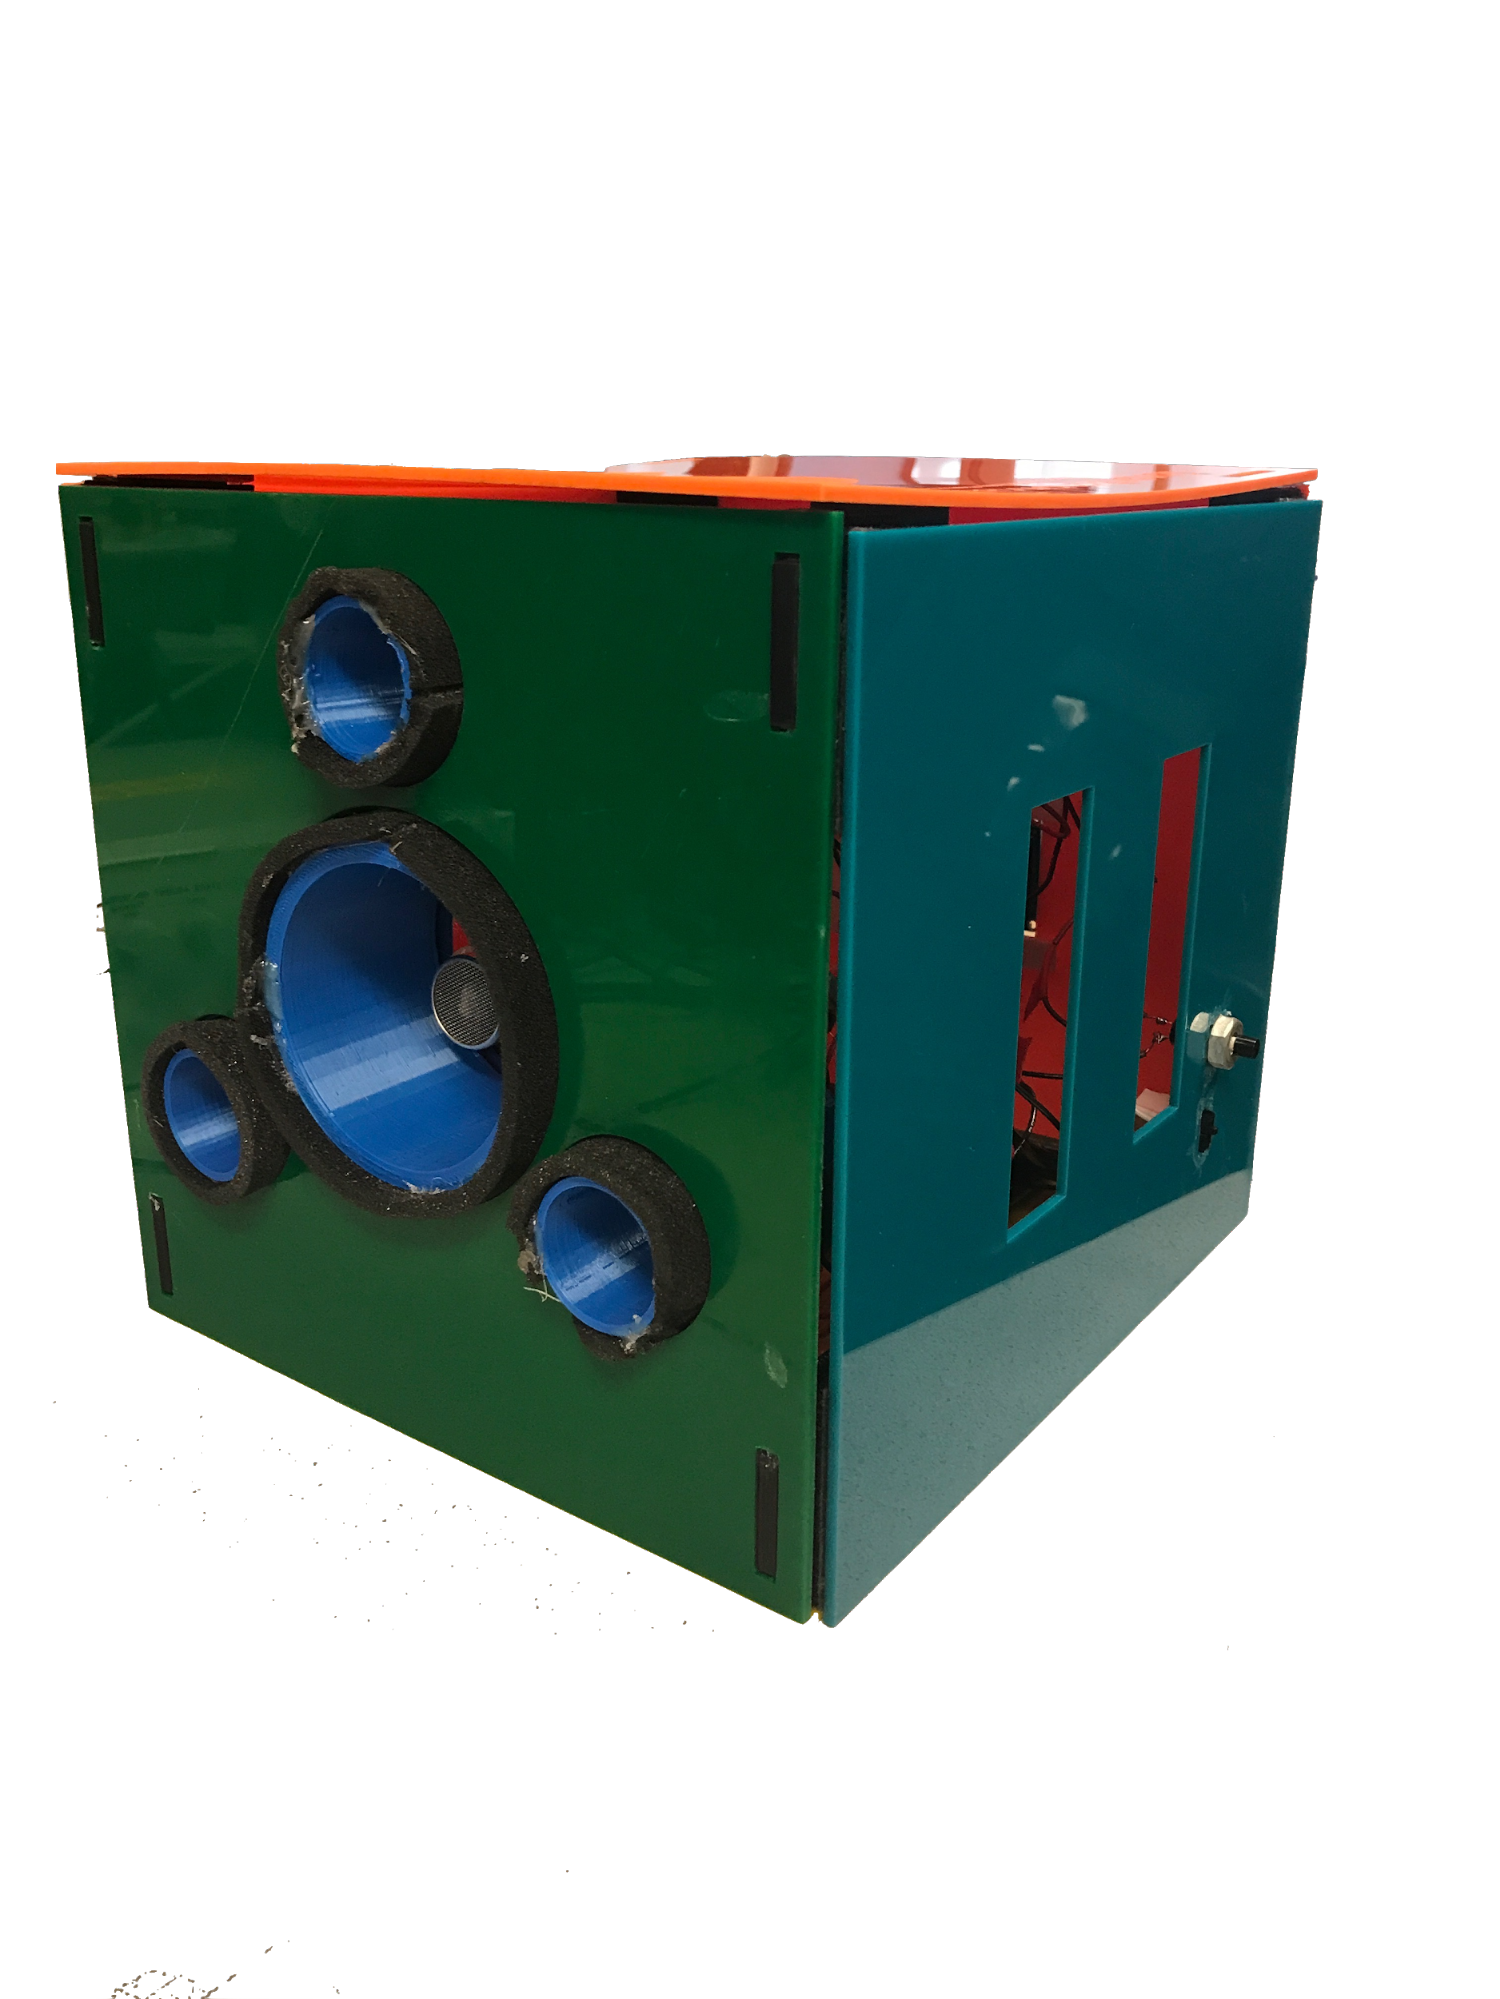
The purpose of the hardware component of our project is to house the electrical components, acoustically isolate the speakers and microphones, and concentrate the sound propagation into a narrow central lobe. We are able to house the electrical components and transducer holders using laser-cut acrylic walls. We use a 3D printed mount to securely hold the TFT against the back wall. To acoustically isolate the speakers, we used 3D printed cylindrical holders. The cylindrical holders prevent sound from traveling laterally. To improve sound isolation, we inserted foam around each of the holders. To maximize the central lobe of the ultrasonic wave, we arranged holders in a phased-array manner. We also 3D printed supports to fasten the walls together. Velcro was used to mount the circuit and microcontroller parts to the walls, and to allow seamless opening/closing of the side walls.
There were several stages of the project development where we had to consider the hardware/software trade-offs of different design decisions.
When designing the system for analyzing the microphone signals, we had to implement an amplification/filtration system that allows the ADC converter on the microphone to recognize voltage signals corresponding to reflected sound, while not picking up on voltage signals corresponding to ambient noise. This was most easily achieved by implementing most of the amplification and filtration in hardware. Specifically, we use dual-stage operational amplifiers to amplify the microphone signals, and RC high-pass filters to remove non-ultrasonic frequencies. Had we chosen to do the amplification and filtration in hardware, we would likely degrade the accuracy of the microphone data due to the small intensity of the raw microphone signal and resolution of the ADC channel. Furthermore, the latency involved in software-driven amplification and filtration might render such a method unsuitable for the hard real-time constraints of our project.
When analyzing the microphone signals in order to detect echos, we had to utilize a threshold system to determine whether a voltage value corresponds to reflected or ambient noise. We could have implemented a comparator circuit to achieve this task, but we instead chose to perform the thresholding in software. Thresholding the microphone signals in software allows for easier calibration of the threshold value than thresholding in hardware.
We found the PIC32 suitable for generating ultrasonic pulses. However, we needed to use an operational amplifier circuit to amplify the signals produced by the microcontroller.
The software component of our design is responsible for reading the ADC channels, measuring distances and predicting perturbations, driving the speakers, and controlling the TFT display.
At a high level, the system consists of two software modes (virtualRealityDot and detectPerturbation). Real-time microphone data collection is handled in a separate thread from the data processing and display threads. We also have a main routine responsible for initializing the peripheral devices and variables.
The thread mainly responsible for computing echo times and extracting microphone data to be used for perturbation detection is called protothread_control. This thread does different things depending on the mode.
If the SER is in distance measurement mode (virtualRealityDot), the thread will control the speakers and read the microphones in a manner that allows distances to easily be calculated in another thread. Essentially, the thread will update an integer array of length 3 that stores the number of timer cycles required for echos to be received at each of the microphones. Another thread, which doesn’t have the same hard real-time constraints, can readily use these values for calculating object distances. In order to calculate echo cycle times, the PWM width is set to 0 in order to turn off the speaker. This allows the sound from the previous pulse to complete its travel so that it doesn’t affect readings for the current pulse. The array micXEchoFound has all its values set to false to indicate that the echos for all three microphones haven’t been found. Furthermore, the array sumXVoltage, which sums ADC values for each microphone in calculating average ADC values, is initialized to 0. Moreover, the array numAboveThresholdIdx, which keeps track of the number of averaged ADC readings which exceed the threshold for an echo, is reset. voltageAverageIdx, which keeps track of the ADC value index in order to calculate averages, is also reset to 0. The threader yields for 15 ms to give enough time for the the speaker to be off. Prior to turning on the speaker, we reset the timer, which is used for measuring ultrasonic echo times. The speaker is turned on by setting the PWM width to half the length of the PWM period.
Next, there’s a while loop used to repeatedly read and average microphone values, check if thresholds are reached, and update the array echoXTime with echo cycle times. The condition for entering the while loop is that either there are microphones whose echo has not been recorded, or the number of cycles since starting the pulse exceeds the maximum storage capacity of the timer.
Inside the while loop, the software increments sumXVoltage for the microphones that haven’t received echos. voltageAverageIdx is then incremented by one.
Next, if voltageAverageIdx is equal to numVoltageAverages — a macro indicating the number of averages we wish to take on the ADC values, we compute new averaged ADC values and check if the microphone signals exceed threshold values. This section of code also updates the micXEchoFound array if a microphone signal exceeds the threshold numAboveThreshold times.
After the while loop terminates, there’s a section of code that performs the averaging of echo times so that final echo cycle times can be written to echoXTime. Note that this section of code is only executed if echos are found at all 3 microphones. There are two reasons for this. Firstly, if an echo for a microphone cannot be found, then there’s a strong possibility that the system is not functioning correctly either due to a functional shortcoming, system error, or user error. By only using data from microphones when all 3 microphones are working, we increase the quality of the data. Furthermore, we want all values in echoXTime to correspond to echos from the same speaker pulses, as opposed to computed echo times from different echo sequences.
Another thread uses echoXTime to calculate physical object distances in meters.
In this mode, the thread partitions the period of time immediately after initiating the pulse into several bins which contain average ADC values for the three microphones. This is done by first turning off the speaker for 15 ms, which is done by setting the PWM pulse width to zero. Next, the PWM width is set to half the PWM period length in order to turn on the speaker.
The next section of code is a while loop which is used to continuously sample, average and store ADC values until the timer reaches capacity. This is done by first capturing the timer value and then storing the 3 ADC values for each microphone into 3 local variables. In order to calculate which average bin an ADC sample corresponds to, we divide the the current value of the timer by the number of cycles in each bin, which is pre-computed.
If the current averaging bin is not equal to the last bin that was used, then the software updates prevFinalResponseAverages for the previous bin to be equal to finalResponseAverages. Then, finalResponseAverages for the previous bin is computed by dividing the accumulated (summed) ADC values by the number of averages we’re taking. lastBin is set to currBin since the bin has been incremented, and responseAverages and numSum are set to 0 so that the next round of averages can be calculated.
After this if statement, responseAverages are incremented by the stored ADC values, and numSum is incremented.
This thread is responsible for handling calculations that don’t have hard real-time constraints and for controlling the VR display.
If the system is in perturbation detection mode, this thread uses the arrays finalResponseAverages and prevFinalResponseAverages, which are generated in another thread. The thread iterates through all 3 microphones and all average bins. For each microphone, the code calculates the l-∞ norm of the difference between finalResponseAverages and prevFinalResponseAverages for a given microphone (i.e. two 1D arrays of average ADC values for different time intervals). The l-∞ norms of differences in bin values (the array of differences is diffArray) for each microphone are then loaded into the array micArray.In order to determine if there’s a perturbation, we take the square of the l-2 norm of micArrayand check if this value exceeds a predefined threshold.
We chose to use this method to determine perturbations since it allows for easy modification of perturbation sensitivity for different applications. Furthermore, this method allows echos produced from objects that are placed at different distances from the SER to be factored into perturbation detection. In addition, the use of 3 microphones enables our system to detect planar disturbances.
To calculate object distances, the thread first converts the averaged echo cycle times for the three microphones into meters which represent the distance over which the sound propagated. The distances are calculated by directly converting the echo cycle times into seconds, which is done by multiplying the echo cycle times by 8 (timer has a prescaler of 8), and then dividing this value by 40 million, since the clock frequency is 40 MHz. To get a distance value, we multiply the traversal time in seconds by 343 (m/s), the speed of sound in air. After this stage, we have traversal distances for all three microphones. To improve the precision of our distances, we average all three echo times and subtract twice the length of the transducer holder. This subtraction is done so that the distance calculated doesn’t include the length of transducer holders. By subtracting twice the length of the transducer holder, we’re able to correct the traversal distance so that it doesn’t account for the length of the transducer holders.
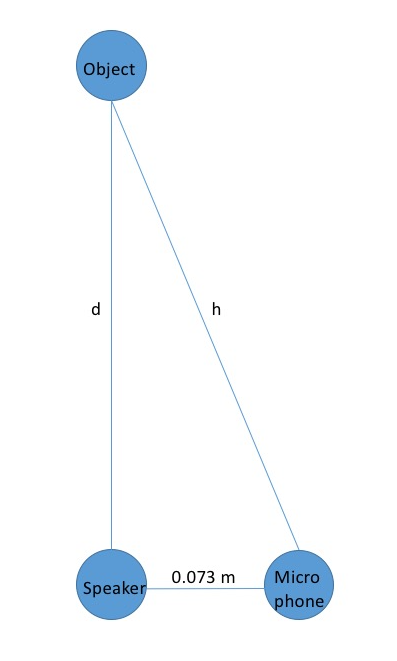
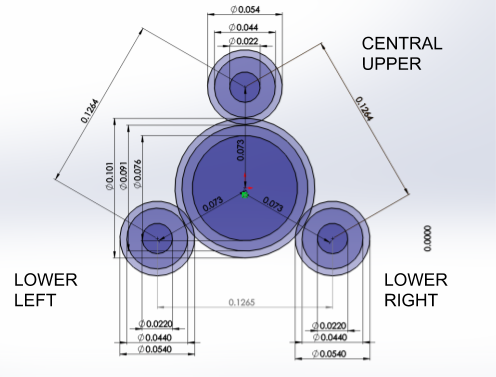
Now that the code has calculated a final sound traversal distance, it is time to calculate the separation distance between an object and the center speaker. Note that the traversal distance calculated is equal to  , where the variables
  and
and  are defined according to Figure 2. Thus, in order to find , the physical variable of interest, we compute
  . We found that using this formula produces a constant error in our distance measurement. This can be due to a constant time difference between when the timer and speaker are turned on, as well as the latency involved in executing the main while loop inside protothread_control. We correct for this error by adding a constant distance offset to the computed distance value, which we found to be equal to 8 cm.
Figure 2: Positional layout of speaker, microphone, and object.
The VR display interface was implemented with considerations for the useful range of the device. The minimum distance which can be detected is 0.00 m and we set the maximum distance, at least for the VR display, to be 1.30 m. Using these parameters, we derived a negative linear function which would map the objectDistance to the displayed circle radius. We set the two points such that when the reading is 0.00 m, the circle will be as large as possible on the screen, with a radius of 111 pixels, and when the reading is 1.30 m or greater, the circle will hit its minimum radius of 10 pixels. Using simple algebra and point slope form of a line, we derived the equation to be:

Additionally in the code we include that if the objectDistance is larger than 1.30 m while still being a valid reading, the circle radius will be set to 10 pixels as well. This design choice stemmed from the need to design the most useful display possible, and since the device would likely be used at close range, it would be wasteful to distinguish the difference in display at far distances at the expense of the ability to view the differences between the shorter distances.
When an objectDistance is marked as invalid by the program, the display changes to a small red circle with a radius of 10 pixels, creating a seamless transition from the circle being as small as possible to becoming displayed as invalid when the user incrementally moves the object out of range.
This circle is updated every time the objectDistance is updated, ensuring that the display follows with the natural timing of the rest of the system. To accomplish this without having the display from a previous iteration linger, we erase the previous circle by drawing a slightly larger black circle over it before we draw the next one.
This thread is responsible for printing out text to the TFT. This was done for debugging purposes, and for enhancing the VR experience. For perturbation detection, we print ‘true’ if there’s a perturbation, and ‘false’ otherwise. For virtualRealityDot mode, we print out the distance value. The text is overwritten by drawing a black rectangle over the text. There’s a 30 ms thread yield time at the beginning of the thread in order to allow other threads to execute.
This thread is responsible for debouncing the toggle button used to change the system mode. Inside a while(1), the thread starts by reading the digital port corresponding to the toggle button. The value of the digital port is saved in buttonState. If buttonState is not 0, then the toggle button is not engaged. When this happens, toggleMode is set to false. This prevents the thread from aliasing the digital input. If buttonState is 0 and toggleMode is false, then the thread has detected an initial change in the button. Once this happens, the thread increments the system mode and then mods by 2, which allows the thread to cycle through both modes. toggleMode is set to true so that the button isn’t aliased, the TFT display is cleared, and the global variables associated with both of the system modes are reset.
Our main routine initializes the peripherals and data structures that we use in our program. We first enable RB8 to be a input pin in order to be used with the toggle button. We also enable RA0 for debugging purposes. The PWM is configured by setting an appropriate period length for 25 kHz. The threads and the timer are also initialized in main. After this, the ADC channels for the microphones are configured, and cyclesPerBin is calculated to be used with perturbation detection. The arrays that are used with perturbation detection are reset, and the threads are scheduled.
Figure 3: Inside view of SER
The speaker circuit was designed so that the PWM signal produced by the microcontroller can be amplified in order to increase the SER’s effective range. Amplification is achieved by using an op-amp. The positive terminal of the op-amp is set to DC 1.62 v (achieved using a voltage divider). The negative terminal is set to the PWM wave produced by the microcontroller. The op-amp is powered by the 28V power line.
The microphone circuit was designed to amplify the microphones enough to pick up on faint echo signals while ensuring that noise doesn’t degrade the signal. Furthermore, the analog voltage inputted into the microcontroller cannot exceed 3.3 V. The current drawn by the microcontroller also has to be controlled. All these objectives are achieved in our implemented circuit. The raw microphone input is high pass filter with an RC filter before inputted into the negative terminal of an op-amp. Furthermore, the input voltage is biased at 1.85 V (via a voltage divider) since the microcontroller can only handle positive voltages. The op-amp is put into closed loop mode by having a 98.3 kΩ resistor between the input and output. The positive terminal is also connected to a high-pass filter. The output of the first op amp is fed into the negative terminal of the second op-amp. The negative input to the second op-amp is also high passed filtered. The second op-amp is also in closed loop mode with a 1 MΩ resistor straddling the input and output. To cut down on current draw, there’s a 0.99 kΩ resistor after the second op amp. A diode is then connected to the 3.3 V rail line (with the negative terminal connected to 3.3 V) to ensure that no voltage above 3.3 V enters the microcontroller. To further reduce current draw, the signal passes through 1300 Ω of impedance prior to entering the microcontroller ADC input.
The purpose of the power management circuit is to produce constant voltage 28 V rail line, ground line, deliver power to the microcontroller, and to allow a switch to turn on/off the entire circuit. We achieve these goals by placing 5 D batteries in series. The positive terminal of the first battery is fed into the input of the 5 V voltage regulator, which is used to power the PIC32, which then creates our 3.3 V power line.
To produce 28 volts, we use a zener diode circuit. The positive terminal of the last battery in series is connected to a 1 kΩ resistor, and then a 28 V zener diode is placed in reverse bias configuration between the bottom of the 1 kΩ resistor and ground. In order to ensure stability in the power line, we have a large 200 μF capacitor between the 28 V line and ground.
To create an on-off switch, we place a switch between the negative terminal of the first battery in series and the ground line used in our circuit. When the switch is closed, the ground line used in our circuit is shorted to the negative terminal of the first battery in series, allowing current to flow. When the switch is not engaged, no current flows through the circuit (i.e. the system is turned off).
We took a modular approach when designing the housing for the SER. Each component was designed in Solidworks 2018. In addition, we designed several “mock” components to ensure that we would have ample room to insert the circuit components, TFT display, and batteries. Because we did not intend for specific parts in our device to be permanently affixed, for components requiring very precise dimensions, such as the support struts, we allowed approximately 0.5 mm for tolerance. In the final assembly, the components were secured using polyurethane adhesive.
In the animation below, we show the exploded view of the SER. Note that the green box is a mock component for the Big Board, the white boxes are mock components for breadboards, batteries, and large capacitor; the black rectangular object is a mock component for the TFT display. In the final assembly, these components -- the protoboard, the big board, batteries, and TFT display-- were secured using velcro and duct tape. In particular, the TFT required an additional component in order to keep it in place.
Figure 4: exploded view of the SER
When first designing the speaker/microphone layout, we realized that the calculations would be easiest and the readings would be most consistent if we placed the microphone in an equilateral triangle, with each microphone equidistant from the speakers.
Once we mounted the microphones and speakers on a piece of plywood, we realized that the microphones were unable to read accurate values, as the microphone had an uninterrupted path to each microphone. Due to the large amount of noise and interference, we decided to create an assembly to contain the speakers and the microphones.
The assembly would not only prevent the speakers from having a direct path to the microphones, but also increase the strength of the emitted ultrasound signal. To accomplish this, we created 3D-printed “holders” which would help focus any received or emitted ultrasound signals, resulting in higher measured amplitudes. In addition, we insulated the speakers and microphones by hot-gluing foam to the outsides of each holder, to further reduce noise. Due to this modularization, we were able to upgrade our speaker assembly with two more speakers, amounting to a total of three speakers.
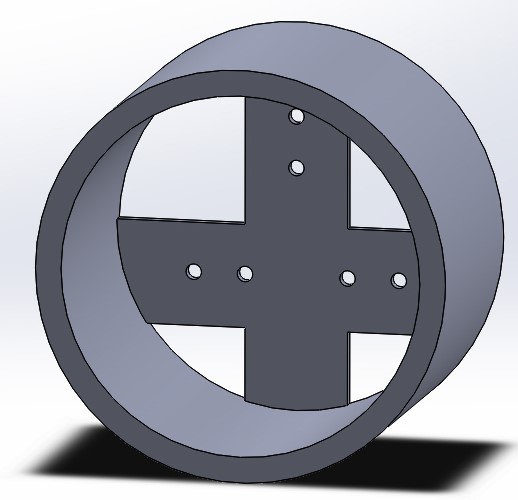
In order to make sure the microphones and speakers remained in place, we 3D-printed a “cup” which would keep the microphone holders relatively equidistant from the central speaker holder. We had designed the holders to have a 0.5 cm tolerance with the inner walls of the cup. The insulating foam on the holders increased the effective radius of each holder/transducer assembly, which allowed us to press fit the holders into the cup.
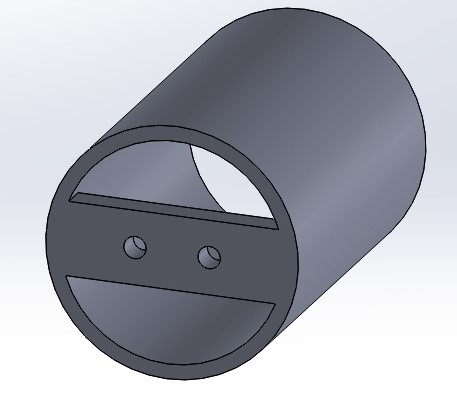
Figure 5: Microphone holder. The two holes in the bottom are through holes for the transducer wires.
Figure 6: Speaker holder. Note that there are three sets of holes, one for each transducer.
Figure 7: Footprint sketch of the microphone/speaker “cup.”
By making both our software and circuit very modular, we were able to efficiently isolate sources of error for debugging purposes. We began our project by first understanding how the transducers work, by reading the data sheet to find out which voltage and frequency to have across them to use them as a speaker, and by hooking them up to an oscilloscope we could gain intuition on the transducers’ utility as a microphone. In doing so, we found that we would need significant amplification on both the speaker and microphone side in order to get useful signals to use as inputs for the PIC32. We developed these circuits first on breadboards, and we tested each of them independently using the oscilloscopes, all while swapping out the various components and circuit layout until we were pleased with the readings. Only once we were satisfied with the amplifiers were we able to begin writing code to turn our data from the time delay between the speaker and microphone transducer signals into a distance measurement.
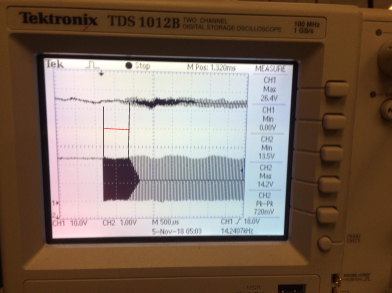
Figure 8: Sample oscilloscope reading for a microphone (top), the speaker (bottom), and the time delay for a pulse.
The code we planned to write, however, would rely on the assumption that our relative positions between our speakers and microphones will always be constant. Once we decided on a reasonable layout which would give us useful data, we designed and 3D printed a support which would hold all of our transducers in the proper relative positions. This involved taking measurements of the transducers which were not readily available online due to their casings. We found that we were at the mercy of the precision of our measuring abilities, when our first iteration of the 3D print did not quite fit properly with the transducers. Having taken note of everything which was incorrect in our first design, we created the second and final design discussed above. When we put the transducers back in and hooked them up to the oscilloscope once again, we noticed a significant amount of noise in our microphones. Since putting it into our 3D printed holder was the only thing we changed, we discovered that the noise was simply interference from the initial signal from the speakers being picked up by the microphone in addition to the signal reflected from objects which we intended to receive. To solve this problem, we surrounded the edges of the holder where each transducer was placed with a thin layer of foam to isolate them further, and ensure that the speaker signal would only be received by the microphones upon reflection.
Through simple trigonometric calculations, we were able to derive equations which we could use to display our distance values onto our TFT. Next, we could test whether these outputted values were accurate by comparing these to measurements made by a meter stick. We found that we were displaying a value which was consistently 8 cm higher than it should have been. Since this error was constant regardless of the distance measured, it was a simple fix in the code, where we could add an offset and resolve the constant error in our measured time delay, which was likely caused by it taking some amount of time for the data to be processed by the PIC32.
Once the design was proven to work properly, we had to make steps toward finalizing the physical connections between the components to eliminate the circuit as a source of error in the future. This proved to be a more difficult task than we had anticipated. We created a schematic and pin diagram based off of the working version from the breadboard, all the while carefully measuring values of all components, and built this design on a protoboard. While in theory the circuit should behave the same way as the original, we found that the element of human error caused problems to arise. In hopes that everything would work perfectly, we hooked the circuit up to the PIC32 and hoped that the TFT would display the same readings as before. This was not the case, and we were printing out nonsensical (large negative) values to the TFT, and we had to yet again probe our circuit to diagnose the problem. The oscilloscope readings showed us that the speakers were outputting the proper signal, and the first and third microphone were responding properly, so we had suspicions that the second microphone amplifier circuit was the problem. These suspicions were confirmed when we modified our code to not use the second microphone while generating our distance measurements, and found that the TFT went back to reading out reasonable values.
To solve this problem, we disconnected our protoboard and examined the solder connections. We noticed that although we couldn’t see any obvious places where two nodes were shorted, our amplifier circuit for the second microphone was conspicuously messier than the other two, so removing excess solder was the natural place to start. Unfortunately, we discovered this was of no help when we went back to test the circuit. After some time examining each node and confirming signals using the oscilloscope, we arrived at a point where we saw that the wires of resistors from two adjacent nodes were in contact, thus shorting out part of the amplifier and rendering it useless. Simply separating these resistors was all it took to fix the circuit completely.
The last consideration we had to make to finalize our circuit was how we would power it, since up to this point we had been using the power supply from the lab benches and the AC adapter to power the PIC32. We devised a circuit on a breadboard which involved five 9 V batteries in series, which at the highest voltage point was connected to a 1000 Ω resistor and then a zener diode straddling this point and ground to maintain a voltage of 28 V. As discussed earlier, we also included a voltage regulator connected to the positive end of the first battery (9 V node) and ground, which would produce a node at 5 V, which we could connect the PIC32 to. Upon connecting the circuit and running our code we yet again read out nonsensical values. We found noise peaks in our microscopes’ oscilloscope readings whose amplitudes were much larger than our intended input signals. It immediately became clear that this is why our code would not run properly, as it relied on the signal crossing a certain voltage threshold and averaging around that point, but if the noise crossed that value then our data became meaningless. We returned to probing all of our nodes and verifying whether the signals matched what we expected, and we noticed that our 28 V rail was not actually remaining constant. By adding in a large 200 μF capacitor which could handle high amounts of voltage, we were able to regulate the voltage at 28 V, which fixed our noisy readings when we went back to test the microphones on the oscilloscope.
We finally had the physical circuit working exactly how we wanted it to, based off of all of our probing, but the distance measurement displayed on our TFT was not consistently working, as we were getting sudden jumps and discontinuities. We figured out this problem relatively quickly, because if we knew for a fact that the physical circuit was correct, it had to be a software issue. The major piece of code which linked the software and hardware was the threshold which would indicate an object was detected. Since we were now working with a slightly different circuit and voltage than the circuit which had used the power supply, we had to update our thresholds for each of the microphones, which was done by yet again attaching the oscilloscope to each of the microphone outputs, where we then determined the maximum voltage the output could attain while no object was reflecting the speaker signal. The thresholds actually worked out to be the same value for all three microphones, unlike before.
We made similar adjustments for our perturbation mode, where we did rigorous testing to determine an appropriate threshold for the difference in consecutive averaged samples which would indicate a change in orientation or position in a detected object. This threshold was determined by essentially guessing two values, one which was too low and one which was too high, and using a binary search to close in on an appropriate value.
After attaching a simple push button and power switch to our final design, our project seemed to be complete, as it appeared to work perfectly. Several days later, we found that when we turned on our system, the TFT would flash as if it were on and then display a black screen. This was indicative of the system not getting enough power, which we confirmed again by probing our power circuit and finding the voltages to be lower than we expected. Removing all of the batteries and replacing them with brand new ones resolved this final problem.
We had initially planned to use the echo times from all three microphones to calculate the euclidean position of an object with respect to the speaker. This was based on the false assumption that because it is possible to determine the coordinates of a point in 3D space from the distances the point is from 3 other points (that form a unique plane), it is possible to use 3 echo times to determine the location of a object. However, we did not factor in the precision necessary to obtain such coordinates given how close the speakers are to each other. Furthermore, in order for object localization to work, the object would have to have be shaped in a very specific way in order to optimize the reflection of the sound. These factors made calculating the position of an object in 3D space an intractable problem given our design constraints.
Overall, we were quite satisfied with the performance of the SER. We assessed the performance of the distance measurement by comparing the measurement reading of the SER with the actual distance between the object face and the SER. Generally speaking, we were able to achieve 2 cm of precision. As the distance of the object exceeds a meter, the accuracy began to degrade. This is due to the sound attenuation effect making it more difficult to detect the echo.
The perturbation detection system was evaluated by inspecting the number of false positive and true positives. For our project demonstration, we chose a relatively high threshold, which means that only large perturbations are detected. Our project video clearly depicts the system properly working in this state. We also used our perturbation system to detect minor changes in planar orientation of objects by reducing the perturbation threshold. When we tested our system under these conditions, we found that when the SER was stationary, it was able to effectively detect small disturbances in position/orientation of object faces. However, if this thresholding system were used while the SER is being held, the system will register numerous false positives. Therefore, we chose to judge the effectiveness of the perturbation system when the threshold was properly set for the application. When the thresholds were set appropriately, we were able to achieve great success in detecting disturbances.
We found that several environmental factors impacted the performance of the SER. For instance, the position of the SER with walls, floors, and ceilings affects the acoustic signal received by the microphones. This is because the sound can get reflected off peripheral objects and be received by the microphone, which interferes with the microphone signal. Moreover, sound attenuation can change depending on the ambient temperature and pressure of the air.
Our final system was designed to have a simple, clean, and intuitive interface which could be operated by users of all cultures and literacy levels, as the interface does not rely on being able to read English. By manipulating the size of the circle as a linear function of distance, upon testing the device with various nearby objects the user can gain intuition on how far away an object is based off of this display. This is useful when the user would like to detect objects which they cannot see, for example when they are in the dark. Additionally, if the user would like to know the exact distance, they should be able to read the distance values since numerals are universal, assuming it is understood that our reading is in meters. The perturbation detection mode also mainly relies on visuals from the TFT, where the user can clearly see the circle on the display change from green to blue when there is a detection.
A physical requirement for the user is the ability to grasp the two side handles adequately enough to the lift it and point it at the object of interest, which would require them to lift approximately 3 lbs. The other crucial requirement is the ability to discern the difference between the colors blue, green, and red, and optionally yellow if the user intends to read the distance measurement.
As far as maintenance is concerned, the only thing required by the user is occasionally replacing the batteries. They are lined up along one side wall so that when the time comes to change them (which will become clear when the TFT ceases to display anything), it is as easy as possible for the user. The side walls are attached to the rest of the box via velcro, making them easily detachable. Additionally, the walls are of different colors, so it is unambiguous when they are instructed to remove the orange wall to access the five 9 V batteries which would need to be replaced.
All of the code for the threads run on our PIC32 was written by a member of our group and is therefore the full intellectual property of Evan Kravitz, Rajiv Kommareddy, and David Yang. Some code for interfacing with pins at a high level was taken from sample code written by Bruce Land.
The entire hardware design, including the circuit, 3D printed models for the holders, and laser cut walls are entirely proprietary and therefore subject to patent opportunities in the future.
Evan Kravitz and David Yang additionally intend to submit this design project for publishing as part of ECE 4920, with Rajiv Kommareddy giving consent with the stipulation of being acknowledged for partial design credit.
We, the SER team, have made our best attempt to comply to the IEEE Code of Ethics. Recall that the IEEE Code of Ethics[2] are as follows:
Possible safety concerns with regards to our device are as follows:
Therefore, when using the SER, please observe the following safety precautions:
Since our device only outputs sound pulses, which are not regulated by the FCC, we are not subject to any legal constraints.
By the disclaimer that use of our device near water is restricted, we are absolved from any legal action against us for any injuries incurred by a user violating the guidelines of use.
The group approves this report for inclusion on the course website.
The group approves the video for inclusion on the course YouTube channel.
The format for this bill of materials is as follows:
Quantity, (Part Number,) Description (Total Cost, (provided at no cost,) Vendor)
Total cost: $98.16 - $71.53 = 26.63 USD
Rajiv Kommareddy:
Evan Kravitz:
David Yang:
https://www.ieee.org/about/corporate/governance/p7-8.html
https://www.scientificamerican.com/article/how-do-bats-echolocate-an/
Figure 4760 (Left to Right): SER, Yang, Kravitz, Land, and Kommareddy
[1] https://www.scientificamerican.com/article/how-do-bats-echolocate-an/
[2] https://www.ieee.org/about/corporate/governance/p7-8.html
[3] The effect appears to be exacerbated for organisms capable of hearing aforementioned frequencies.
[4] This risk is greatly increased if the user has wet hands.