
Hardware
This page contains the following steps in the hardware design.
1. Pressure Sensor Mapping to input/output pins
2. Pressure Map connection to circuitry
3. Dart hit detection during video generation
4. Push Buttons
5. Standalone
Pressure Sensor Mapping
The dartboard contains 62 distinct regions (1-20), which include single hit, double hit (the outer ring), triple hit (the inner ring), bulls eye and double bulls eye (the regions in the center of the board). A double hit counts for 2x the points of the single region hit, and a triple counts towards 3x the points. The bulls eye is 25 points and the double bulls eye is 50 points.
It is pivotal that each region be individually identifiable. This is accomplished by the pressure sensor map. There are 10 input lines with 7 corresponding output lines. The pressure sensor map are 3 sheets of plastic, the top one containing the input pattern, a middle layer, and the bottom layer containing the input pattern. Contact is made when a round contact pad in the input comes in contact with a round contact pad in the output layer. The middle layer serves as a separation of the two layers, which contains holes where the output and input contacts line up. For a robust design, each double/triple region contains 2 contact pressure points, and each single region contains 4 points, which corresponds to the region's area. The figure below shows a typical pressure sensor map.
![]()
Hardware Figure 1.
The decoded inputs are given below. (Numbers include single, double and triple regions) Each input pin corresponds to a number on each half of the board, with the half line being a diagonal from 8-4.
|
Input Pin
|
Region
|
|
0
|
4's, 13's double bull
|
|
1
|
18's, 6's, single bull
|
|
2
|
1's, 10's
|
|
3
|
20's, 15's
|
|
4
|
16's, 8's
|
|
5
|
7's, 11's
|
|
6
|
19's, 14's
|
|
7
|
3's, 9's
|
|
8
|
17's, 12's
|
|
9
|
2's, 5's
|
The decoded outputs are given below. Each input pin corresponds to a double, triple, or single region for each half, 8-4 or 16-13.
|
Output Pin
|
Region
|
|
0
|
Triples 8-4
|
|
1
|
Doubles 8-4
|
|
2
|
Singles 16-13
|
|
3
|
Singles 8-4
|
|
4
|
Bulls, Double Bulls eye
|
|
5
|
Doubles 16-13
|
|
6
|
Triples 16-13
|
It is then possible to see that by knowing which input line generated the output on a specific line which region was hit. For example, if an input signal was known to pass through input line 3 to generate an output, then either the 20 or 15 region was hit. By looking at the output lines, since 20 is between 8-4 and 15 is between 16-13, it is possible to know the exact location.
Connection to Circuitry
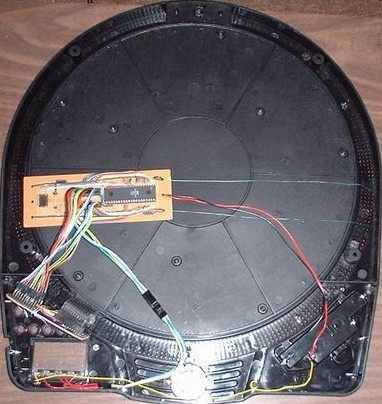
The next step is to make the physical connection from the pressure map to the circuitry. For the initial design the map was kept outside the dartboard for ease of decoding during testing. When the code could accurately detect each region, the map was placed back into the dartboard. The following pictures show the connection circuitry.

Hardware Figure 2.
The pressure sensor leads are the clear plastic pieces going into housing pins. There leads were then connected to wires going to the pins on the microcontroller.
Dart Hit Detection During Video Generation
Overview
Dart hit detection was perhaps the most difficult hardware control aspect of the project. With the added complexity of the video generation, we were limited in the hardware resources and time to poll the pressure sensor map. If there were no video generation using interrupts, we could have easily polled by having a fixed-time loop. Since video is probably one of the best features of our project, we analyzed the poll requirements and looked for tradeoffs.
Dart Hit Characteristics
We used an oscilloscope to see what an actual dart hit would look like. When a dart hits one of the regions of the pressure sensor, it causes a brief conduction between the metallic pads on the top and the bottom sheets. A 5V voltage was applied to all the pins of one sheet, and the oscilloscope detected the conduction on the pins of the other sheet. We threw real plastic tipped darts at the dartboard to simulate all types of user inputs. We observed that the shortest pulse was about 400us, and the longest pulse was about 4ms. On average, the pulse was about 2ms. We also discovered that a high velocity dart hit caused vibrations on other dart regions and triggered off incorrect regions. On average, the false trigger lasted for about 1ms.
Poll Timing
A useful aspect of having video generation is that it occurs at a very frequent time interval. The horizontal and vertical video line signals are generated at about every 63.5us. We decided to poll each of the 10 pins so that the 7 pin output can be easily processed as a byte in our code. In order to detect the shortest pulse, we needed at least two polls over five video line signals which would take 317.5us.

Hardware Figure 3- NTSC Horizontal Line (http://www.williamson-labs.com/480_tv.htm)
After analyzing the waveform in figure 1, we determined that polling can be done at the beginning and the end of the video segment as shown in Hardware Figure 4.
 .
.
Hardware Figure 4- Polling in Video Segment (http://www.stanford.edu/class/ee281/handouts/lab4.pdf)
Since there wasn't much time before and after the video segment, we had to make a tradeoff on the width of the video output. The video generation code by Bruce Land used nop's in the video blast macro to effectively widen the video output. The macro had 8 nop's and was called 16 times per video line. By getting rid of the nop's, we were able to gain 128 clock cycles or 4us at the cost of reducing the video output width by about a third. This was an acceptable trade-off and the best solution to polling.
Polling Scheme
In order to reduce unwanted noise that caused false triggering, we used pull-ups on the 7 pins. Each of the 10 pins was driven low one at a time. When a dart hit caused a short, one of the 7 pins would be driven low. The pull-up resistance and parasitic capacitance from the two sheets caused an RC constant. Using the oscilloscope, we determined that it took about 0.5us for a valid detection. This required a delay before reading the 7 pins. In order to get a very fine tuning for this delay, we called the delay function using the assembly code. Too much delay caused an overlapped with the video segment; too little delay caused an inaccurate detection.
Debounce
Since multiple regions can be triggered from a high velocity dart throw, debounced must be implemented to decide a valid hit. We know that a false trigger last for at most 1ms. If a region is triggered for more than three complete poll cycles, then we know that that region must be valid. This would require a minimum valid dart detection time to be 1.27ms. Therefore, we cannot detect the shortest dart hit. But the average dart hit was about 2ms, so this method works for 98% of the cases. That's why we implemented the bounce out button just in case the user threw the darts very lightly.
Push Buttons
Four pushbuttons were used in the design to allow the user to select game type, number of players, reset, switch to the next player during game play, and bounce-out the last dart throw. The hardware design for the push buttons was relatively simple. Each button was connected to a pin on the microcontroller. Each button was pulled high to VCC when a push of the button occurred. Hardware Figure 5. shows the implementation of the push buttons in the final design. The left most button is scroll down(menus), and next player(game play). The next button is scroll up(menus), and bounce-out(game play). The third button is enter selection(menus), and not used for game play. The far right button is a reset to main menu.

Standalone
The final aspect of the design was making the entire structure standalone. This would provide us the opportunity to use the dartboard in any location, with the availability of using any television with a video jack. The first step to the standalone was making the microcontroller standalone by adding the 16 MHz crystal, capacitors and resistors to the breadboard. The next step was to link the pins of the microcontroller to the pressure map, and push buttons. The video cord was then attached to the two pins for video generation on the breadboard. The final aspect was to add the dartboard's power source, 3 AA batteries. All these steps included soldering wires and electrical components into the breadboards.
The pictures below highlight the final version of the standalone board before the circuitry housing was added to enable the board to be wall mounted.
|
Hardware Figure 6. Battery Compartment |
Hardware Figure 7. Standalone Microcontroller |
Hardware Figure 8. Final Standalone overview.
Issues that did not work
The main issues that were encountered were de-bouncing the dartboard, memory allocation, and sound. It was discovered that a hit would trigger other regions to read a false hit. A few days were spent trying to figure out ways to eliminate this issue, which included trying to put a damping layer between the plastic sheets, complex coding to count output-input dart hit regions where the highest count would be the true dart hit region, and altering the force of the dart throw. It was then realized the dartboard could be modeled to a giant push button, and thus, a simple delay was added.
The memory allocation issue was focused around defining stings of characters for video generation. In order to create the games and menus many strings were created which consumed a large percentage of SRAM. Declaring some to flash was attempted, however there were issues calling the strings from flash which would generate flicker in some cases. The solution was to allocate more memory to SRAM in the compiler setup.
Sound was attempted by masking the input reads on port C with the sound generation pins. The result was an inaccurate dart detection. Thus, sound had to be scrapped due to a lack of available pins.

