High Level Design
1. Rationale
and sources of your project idea
We both have a strong interest in GPS
devices, but neither of us have taken the GPS course. The capacity of the
Mega32 would be too low to implement the algorithms to implement a GPS receiver
module. Also, testing such a device would be challenging to do in the lab. We
both own devices that track our speed, distance traveled, rate of displacement
but they do not possess and interface to map out our location on a given map.
The thought of creating a device that would work in conjunction with our
devices was the source of our project. Since we are limited by memory we decide
that the device would only display map data for the Cornell Campus rather than
all of
2. Background
Math
Once we collected data point from a GPS device to help us map the pixels on the screen to a specific location on the map, we needed a formula that would calculate a pixel given a given latitude and longitude. To derive the needed equation, we set a trend to the collected data and determined a linear equation relating a longitude values to an X-pixel coordinate and a latitude to a Y-pixel coordinate. These calculations can be viewed here.
3. Logical
structure
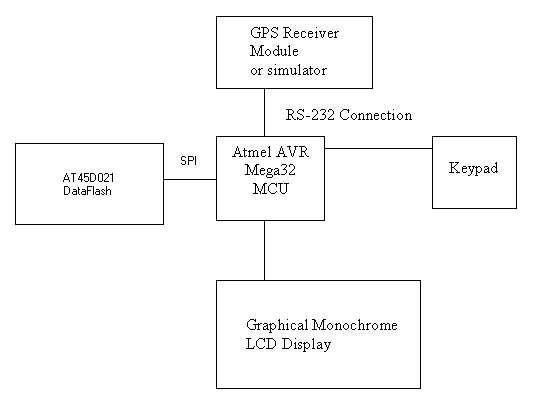
Our final project displays the location of the user on a monochrome LCD, with respect to the Cornell campus map. We take an adobe illustrator file of the Cornell map and convert it to SVG. From there we convert the SVG file to pure vectors. These vectors are sent to the MCU through a hyperterm and stored in the DataFlash using SPI (Serial Peripheral Interface). The GPS simulator then sends the latitude and longitude coordinates of the user. This coordinate is then converted to a pixel location on the screen and an image representing the user is displayed at that location.
The user interface allows the user to move the screen to the left, right, up or down by 100 pixel. If the map has now moved to a position where the user is no longer on the screen, the center button allows the user to redraw the map centered at their location. The user also has the option to zoom in on there location.
The block diagram for the device:
4. Hardware/ Software
Tradeoffs
The major tradeoff
for this project was that we wanted to display a substantial amount of map data
on the LCD. To do this we used the Atmel AT45D021 DataFlash in the STK500
board. As a result our device cannot operate in stand alone mode.
Another tradeoff was that we one timer interrupt for, polling the UART buffer, polling the button pushes and the rate at which the man blinks. Since timer0 was being ran at ¼ sec we need to hold the buttons to the user interface for at least that long.
Since our device would be unable to operate on stand alone mode, we used a 24volt power supply rather than using several 9V batteries to produce power needed by the LCD.
5. Standards
The standards we used were RS232, NMEA, and SPI.
RS232 is an asynchronous serial communications protocol. There is a transmit and receive line. Each signal begins with a low voltage shift as a start signal and raises to a high voltage after the specified number of bits to stop a packet.
NMEA is a standard message protocol used by GPS modules to transmit data. NMEA output is RS232 compatible. A baud rate of 4800 bits per second, 8 data bits, no parity and one stop bit must be used when interfacing with RS232. NMEA 0183 message sentences are in ASCII. They begin with ('$') and end with ('\r') and the data is separated by commas. The sentence may contain up to 80 characters, excluding (‘$’) and (‘\r’). For our purposes we only needed sentence RMC, Recommended Minimum Specific GPS/Transmit Data. This sentence contains date, time, latitude and longitude coordinates.
SPI is a synchronous protocol to allow data transmission over short distances. There is a Master and Slave mode, set depending whether the device is receiving or transmitting data. The Slave device receives clock and chip select signals from the Master.