Cornell University
Microcontroller Design: Spring 2006
Final Project
Self-Powered Solar Data Logger
By Abigail Krich
Wednesday 1:30 lab
|
|
Cornell University
|
|
Introduction:
My project is a self-powered solar data logger. Put out in the sunlight, it will measure the light level and log this to memory to be later downloaded to a computer. The system is powered by a small solar panel and battery.
Summary:
The solar logger I built uses a photodiode to measure the solar insolation level. It converts the analog signal from the photodiode to a digital value that is stored in flash memory. Every time the system logs a data point, it also logs the time and date so that the data can be analyzed in the future. The logged data is available for a user to download to a computer for analysis.
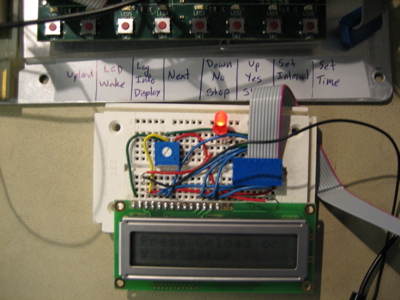
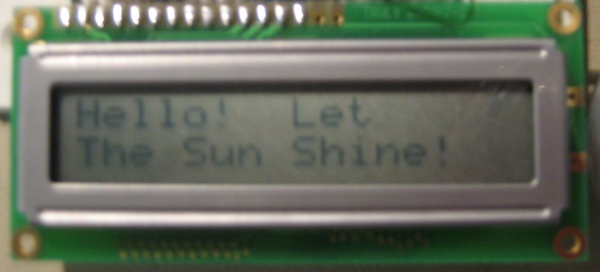
While the system is logging, real time data is displayed on a small LCD screen as well as information about the battery voltage, the length of time the system has been logging and the length of time it can continue to log before running out of memory.
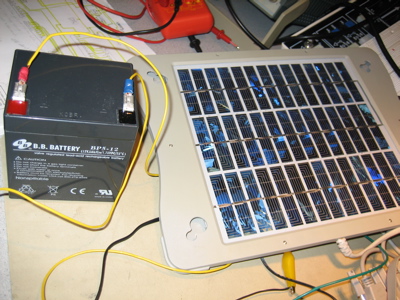
The logger has a dedicated solar charging system to provide the needed power. A very simple charge controller regulates charging of a small, sealed gel-cell lead-acid battery by a small solar panel. This charge controller is a simple on-off switch that disconnects the PV panel when the battery voltage rises too high.
The user sets the time and date each time the system is reset as well as the frequency with which data is stored. The user can also clear the memory or continue appending data to the previously logged data and extract logged data to a computer for analysis.
High level design:
Rationale and sources of project idea:
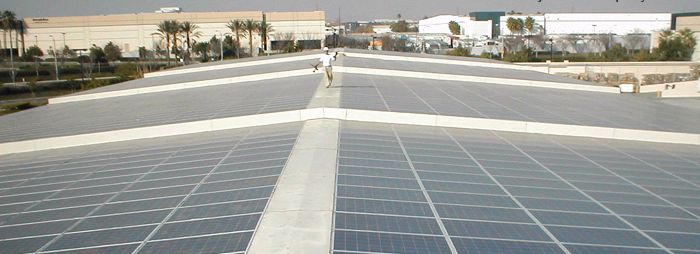
There are many reasons for logging solar insolation data for solar electric systems. When planning to install a solar electric power system, one must be able to predict the power output in order to determine the financial costs and benefits of the installation.
When planning an off-grid solar electric power system, the output must be closely matched with the load so as to provide sufficient power without considerable waste. The power output is directly related to the insolation level. While seasonal and annual average insolation levels for most major cities in the United States are available (http://www.solar4power.com/solar-power-insolation-window.html), cloud cover and other weather effects can be very localized depending upon the topography, making extrapolations from the large cities with established data to neighboring areas unreliable. In addition, this data is not available for every part of the world,
For a large installed solar electric system, one would typically install an insolation monitor to determine if the system is performing as expected. If the system output drops below the level expected given the insolation, an alarm would be set off to indicate that the system needs servicing.
Background math:
Power Needs:
Even without optimizing the system for efficiency, the power needs were very small. The absolute maximum power needs from the various components were
| Component | Current | Voltage | Power
| LCD | 1mA | 5V | 5mW
| ATmega32 | 15mW | 5V | 75mW
| Photodiode | 15mA | 5V | 75mW
| Total | 31mA | 155mW
| |
Program/hardware design:
Program details:
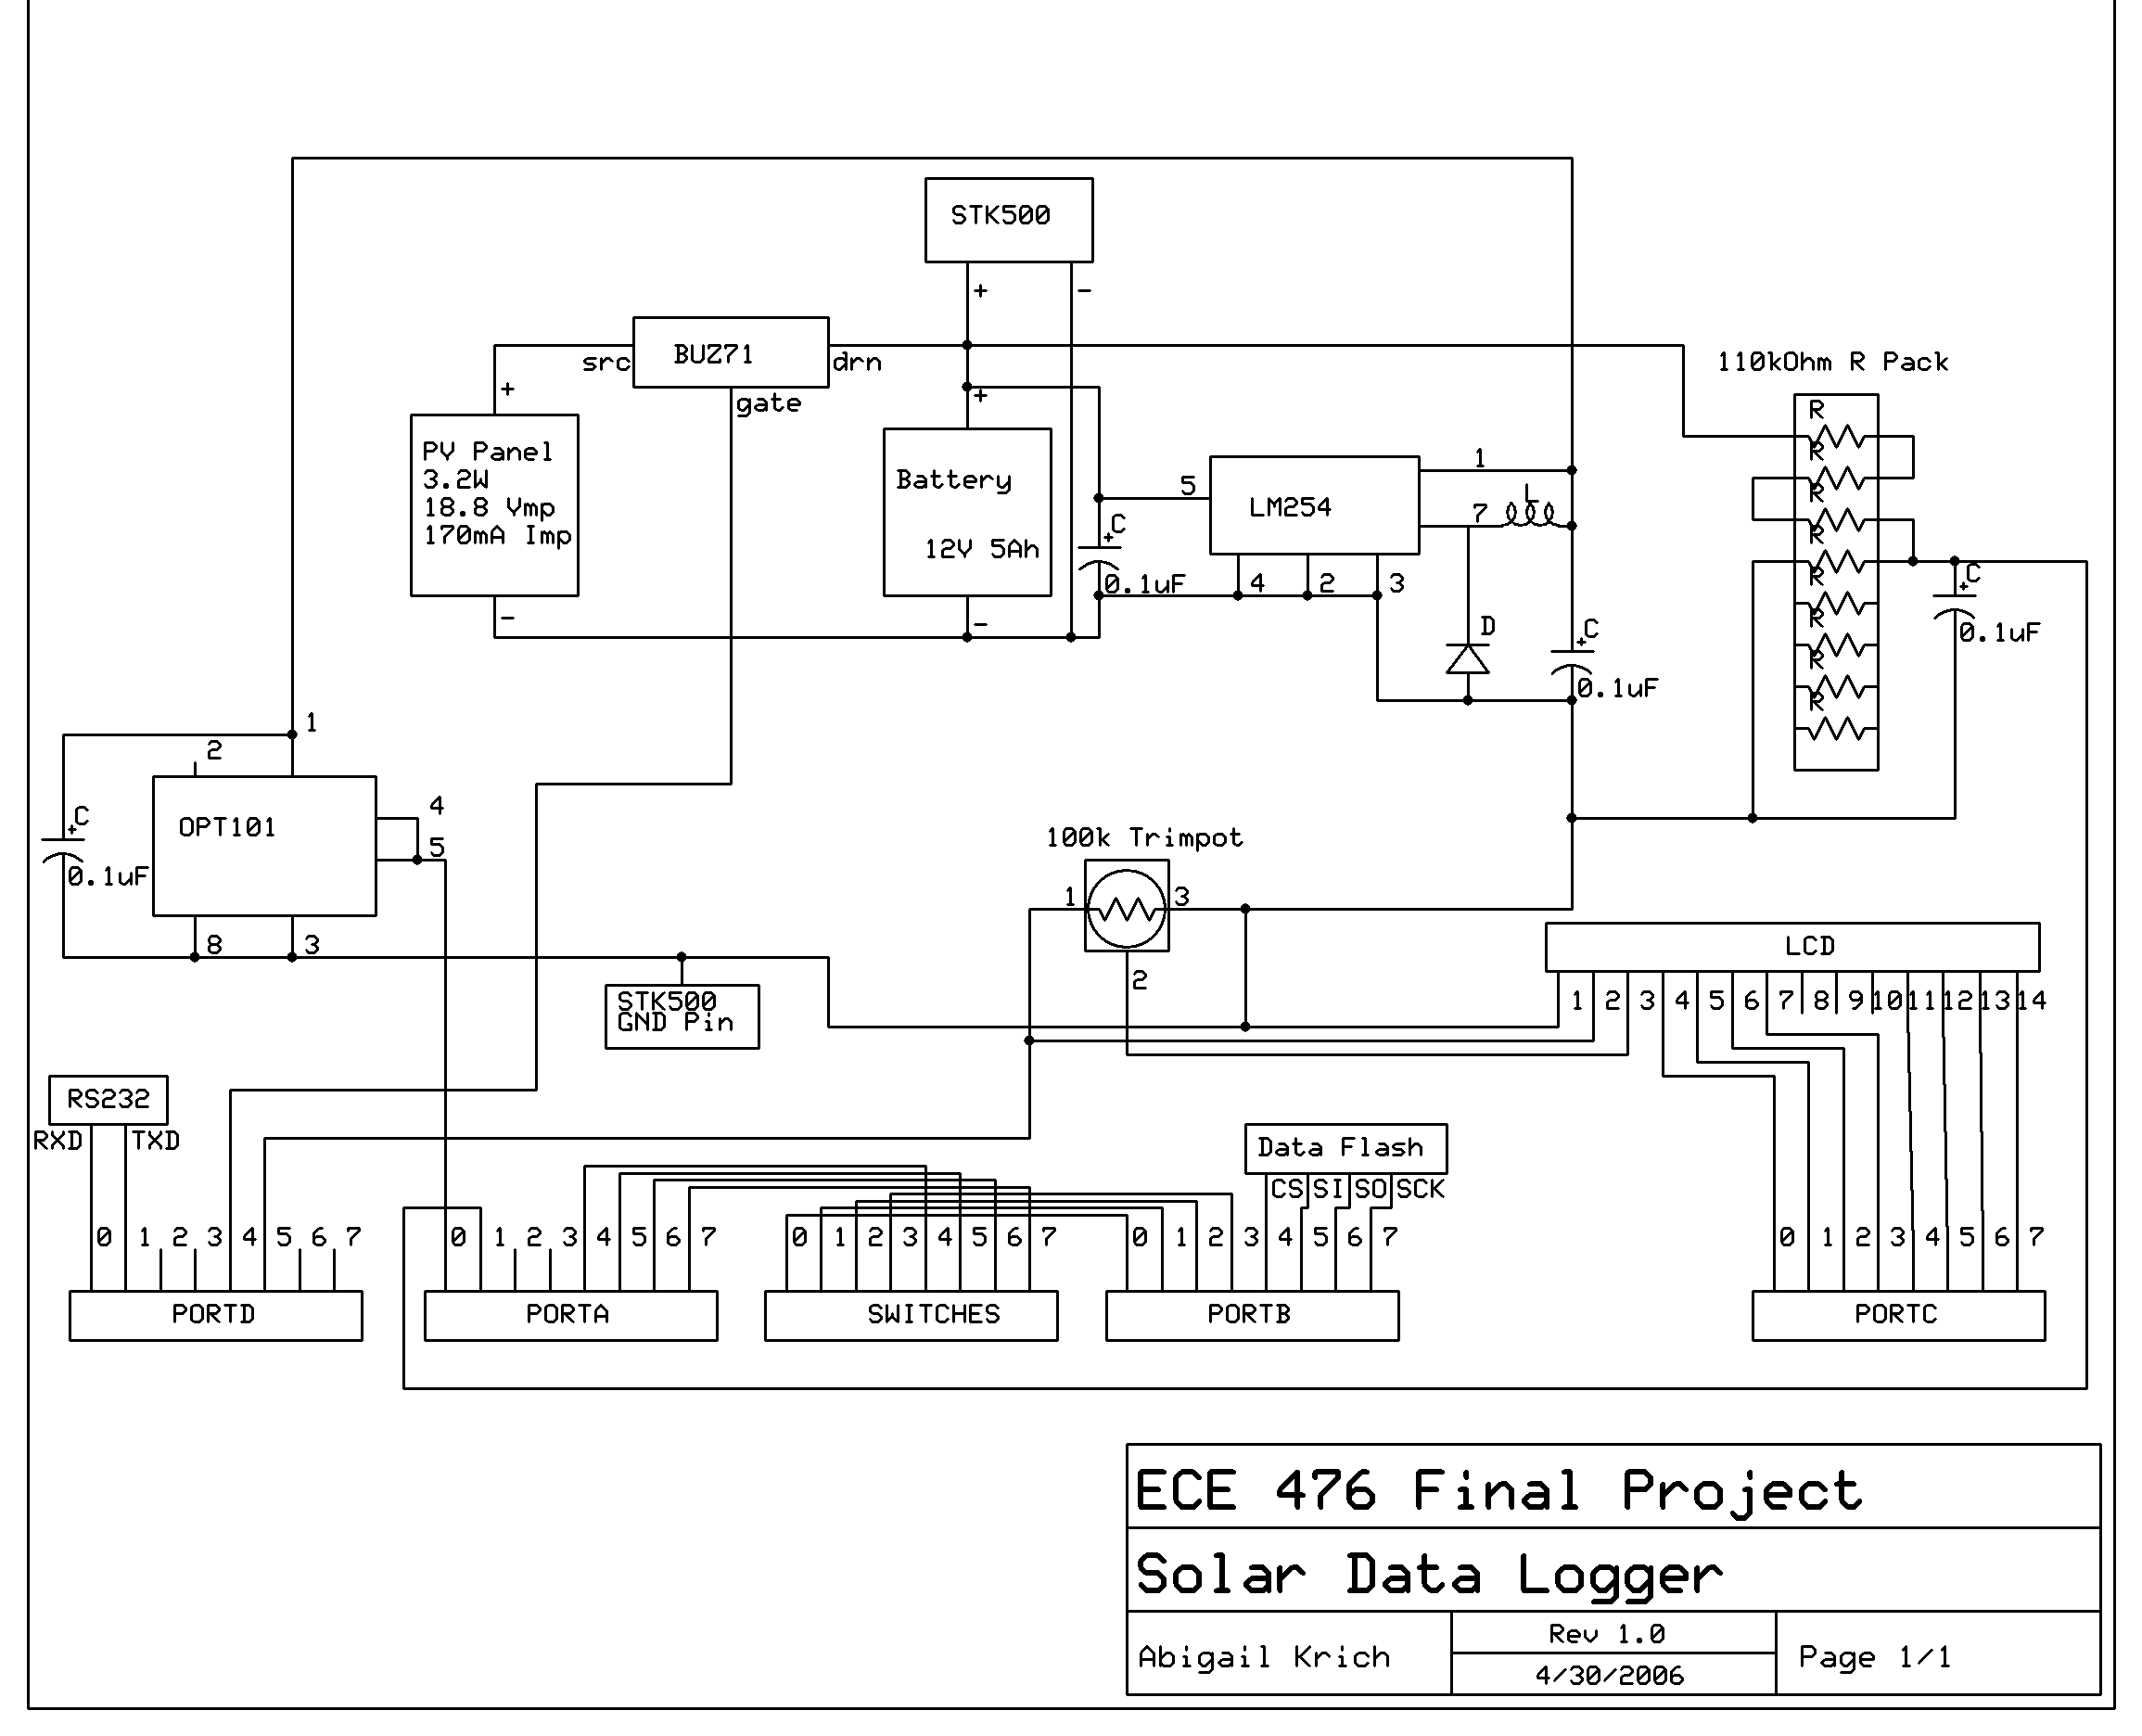
The data logger needed an external memory for storing measured data. The older STK500 have flash chips build into them, making this an obvious choice, but I did not have any instruction set for interfacing with the flash memory. The Big Red Map project by Shirlyn Jean-Louis and Chethan Pandarinath in the spring of 2004 used the flash memory and based on their code and comments I was able to learn how the flash interface worked. They used a program named dFlash, written by Terje Frostad of ATMEL Norway. I received permission from Jan Havard on the Atmel AVR Technical Support Team to use dFlash in my project as well. The dFlash program provides a set of routines to interface with the flash memory by writing to a 264 byte buffer. This buffer is then written to one of 1,024 264-byte pages of the flash memory.
The flash memory can be read either through a buffer or directly. Because the routines take byte size data as input, I had to break the insolation value, stored as an integer, into two bytes and then put it back together again when storing or retrieving it. Additionally, if the user calls for the data to be retrieved before the buffer had filled and written the data to flash, there would be no data to retrieve. It was thus necessary to write the buffer to flash just before the data retrieve routine was entered as well as when the buffer became full. It was also necessary to give the microcontroller a brief period to finish writing the buffer before the read command was executed or the same problem would occur.
One thing I did not realize that caused a considerable amount of difficulty was that PORTB.4:7 are used for interfacing with the flash. I had initially been using PORTB as input for the switches, but found that three of the switches did not work. Once we realized that dFlash was re-initializing these pins, I was able to switch these buttons to PORTA.
A core feature of the logging system was how it handled the data input. Initially the system only sampled the light level with the frequency at which the user wanted data stored. However, with logging frequencies of one minute to one hour, this did not allow a satisfying real-time display that showed changes in light intensity. Additionally, it allowed less accuracy if only one sample was taken per stored data point. Instead, the final system polls the light level five times in six seconds (every sixth second is used to poll the battery voltage). The program keeps a running average over each logging interval and stores this average to memory before beginning a new sampling interval. This frequency is more than twice the expected frequency of fluctuation in natural light intensity, a desirable feature of analog to digital conversion systems. It also allows for real-time data to be displayed to the LCD.
Natural sunlight ranges in intensity from 0 to approximately 1000 Watts per square meter. The photodiode used in this project puts out its maximum voltage at 10 Watts per square meter. With hardly any light striking the sensor, it reached its limit. It was thus necessary to attenuate the intensity of the light striking the photodiode to increase the range over which the sensor could differentiate intensity. Ideally, this would have been done with neutral density filters, but as these were not available, electrical tape was found to be quite effective. Once two layers of electrical tape were placed over the sensor, it gave reliable readings over the full range of expected intensities. The ADC in the microcontroller has a maximum value of 255, this needed to be multiplied by four to roughly convert the ADC reading to Watts per square meter. Ideally, this system would be precisely calibrated and the factor would be more precise than 4, but this approximation gave reasonable results with a range of readings from 0 to 1020 Watts per square meter.
Initially the program was written with each of the subroutines that updated a parameter sending its update to the LCD. This avoided updating the LCD more frequently than needed. However, when the code was incorporated to turn the LCD screen off when the system was idle, the system would freeze every time it went idle. The LCD sends and receives messages from the microcontroller. If the LCD is off when the microcontroller send it a message, it is not able to respond and the microcontroller hangs, waiting. The program thus had to be rewritten to prevent the LCD from being called when the LCD screen was turned off. Additionally, there was some difficulty with the LCD not making proper contact with the surplus whiteboard. When the LCD lost contact, it would cause the system to freeze. I thus added an extra new whiteboard solely to hold the LCD screen securely because I was not able to solder the borrowed LCD to my project. One other problem that was had with the LCD was when the STK ground was not properly connected to the system ground (the negative terminal of the battery). This happened during testing with the STK500 plugged into an AC/DC power supply. When the two grounds were not at equal voltages, the voltage across the LCD was not in its operating range. The positive voltage was coming from the STK port pin and the negative voltage from the battery negative terminal. Once the two systems were joined by connecting to the STK ground pin and then also powering the STK from the battery, the LCD resumed normal operation.
When the system is reset, allows the user the option of clearing the memory or appending to the existing data. In order to do this, the memory pointers had to be initialized only when the chip was programmed, not each time the system was reset, and stored in non-volatile memory. The ATmega32 contains 1024 bytes of data EEPROM memory organized as a separate data space in which single bytes can be read and written. The pointers to the flash memory and the log of how long the system had been logging were kept in EEPROM. If a different logging interval were selected upon system reset, it would be impossible to calculate how long the system had been logging unless a running tally were kept.
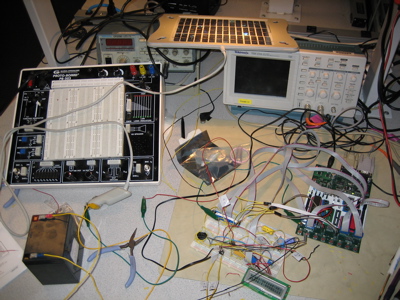
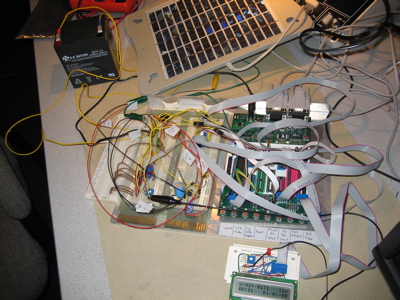
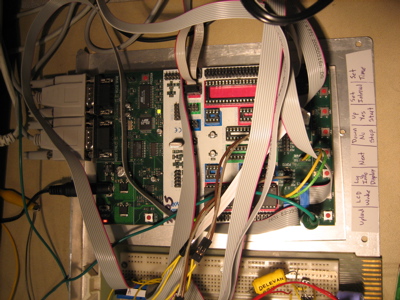
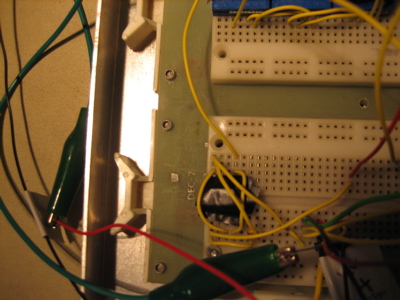
Hardware details:
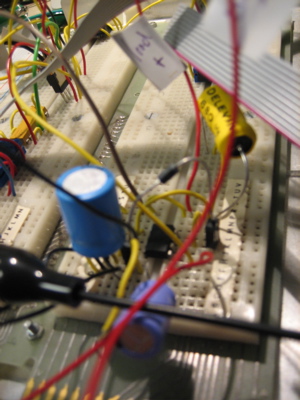
The system was built around the STK500 development board with on board flash memory, an ATMEGA32 chip, and eight built in switches. A BUZ71 was used to switch the charging circuit between the PV and battery on and off, regulated by a port pin. The PV panel was a 3.2W car battery charger made by Volkswagen that I owned prior to this project. The battery was a 12V 5Ah sealed gel-cell lead-acid deep cycle battery. This type of battery is the most cost effective when size and weight are not a concern but safety, ease of handling, and the ability to deep-cycle the battery are. The LM2574, a 0.5A, 5V step-down switching regulator (buck converter) made by ON Semiconductor was used to regulate the voltage from the battery to the level needed for the system components. This regulator had a typical efficiency of 72%, much higher than resistance-based voltage regulation. A 4x20 character LCD was used to display real time messages to the user. The OPT101, a monolithic photodiode and single-supply transimpedance amplifier by Texas Instruments was used to sense the incoming solar insolation level.
The ADC converter on the MEGA32 has a maximum input of 5V. In order to read the battery voltage, it was necessary to use a voltage-divider to guarantee the voltage seen by the ADC was within its range.
References of code written by others:
In addition to dFlash, cited above, my program utilized two interrupt routines written by Bruce Land, the ECE 476 professor. These were the transmit empty ISR and the non-blocking print routines. It also used the button debounce state machine he wrote and made available on the course website.
Things you tried which did not work:
There were many bugs in my program along the way, but at the time of writing this report, all were solved save one. When the STK500 is powered from the battery, its on/off switch has no effect. Whether the switch is in the on or off position, the STK500 remains powered on. To turn the system off, it must be unplugged. Oddly, with nothing changed in the circuit except for switching the STK to the AC/DC power supply, the switch functions properly.
Interesting difficulties that were solved along the way are described throughout this website.
Results of the design:
Speed of execution:
Upon testing the final design, I was unable to find any detectable concurrency or hesitation problems due to speed of execution. The system takes a reading from the ADC, input from either the photodiode or the battery voltage, once per second. This type of system is not highly demanding in terms of execution speed, and optimizing for speed was generally not of concern when writing the program. Due to the necessity of connecting the system to an RS232 cable to download the data to a computer, it was assumed that the system would be brought inside when the data was downloaded. Because of this, there was no need for the system to be able to continue logging new data while the download process was happening to provide an uninterrupted data sequence much longer than what could be stored in memory. It was determined that should a user need a longer time of data measurement, a less lower logging frequency could be used.
To prevent unintended programming while the system was asleep with the LCD screen off, the system only allows input from the LCD wake button when the LCD is off. Similarly, depending upon which stage of the program the system is in, it only allows input from the buttons relevant to that stage.
The messages on the LCD screen were intended to make the system as user-friendly as possible, guiding the user through setup and operation. Additionally, the user�s manual contains step by step instructions for using the system.
Accuracy:
When the battery was replaced by a variable power supply, the battery voltage readings, with a resolution of 1V, were found to be correspond with the voltage readings from the multi-meter over the range of voltages that might be seen from a 12V battery.
The data logger clock, with a resolution of 1 minute, was allowed to run for forty minutes. At this time it displayed no discrepancies with the clock on PC at the lab workstation.
The insolation readings were not compared with a calibrated pyranometer, but were reasonable for the light levels experienced. When light was completely blocked from the photodiode the reading would go to zero. When a bright light, roughly the intensity of sunlight was directed at the photodiode the reading was roughly 1000Watts per square meter. Bright sunlight is typically 1000Watts per square meter, so this was felt to be a roughly calibrated system. Were it commercialized or used for sensitive analysis, it would be important to calibrate it against a known light level or correlate it with a calibrated instrument.
How you enforced safety in the design:
The biggest concern when dealing with DC power, and batteries especially, is to avoid short circuits. The battery in this system is rather small, but still big enough to produce a dangerous arc should the terminals or leads be shorted. During the design and testing phase of the project, care was taken not to allow the battery to be shorted and to disconnect it whenever working on the circuit. As the circuit was built out, components were frequently checked for overheating and all relevant leads were labeled with their polarity and a voltage indication to prevent reversals. Were this system being commercialized, it would be a good idea to put caps over the battery terminals and a cover over the pins on the battery leads.
Interference with other designs (e.g. cpu noise, RF interference):
My project had no interference concerns.
Usability by you and other people:
Significant attention was put into the user interface to make it both simple to understand and use and to prevent a user from inadvertently changing something important in the system. Before a user cleared the memory or stopped the system from logging, a message was displayed asking for the user to confirm that they wanted to take this action. The system also blocked any buttons not immediately relevant to the section of the program being run to prevent improper button presses from stalling or otherwise confusing the program. The user�s manual was written to walk other people through the process of using the data logger.
Conclusions:
Analyze your design in terms of how the results met your expectations. What might you do differently next time?
I was very pleased with the final result of my project. There are many bells and whistles I would have ideally liked to have added to the logger were there more time, resources, or had I better coding and design skills. It would be interesting to see how efficient the system could be made and how small a solar panel could be used to power the system. It would also be interesting to log more information about the incoming light such as the intensity at various wavelengths and whether it was direct or diffuse light, as this makes a difference to the power output from photovoltaic systems. If I were going to actually use this system, it would be necessary to build a weather-tight enclosure for it, but as tested in the lab this was not necessary.
Ethical considerations. Refering to the IEEE Code of Ethics, specifically explain how decisions you made or actions you took in this project were consistent with this Code of Ethics.
Points five and six of the IEEE Code of Ethics relate specifically to improving the understanding of technology and improving our technical competences. Through this final project, I have developed and expanded my technical competence in areas where I had very little experience. As someone graduating with a Master�s of Engineering in Electrical Engineering, this course, and specifically this project, make me feel as though I have some right to claim this degree. All other coursework I have done has been pencil and paper or modeling based. Never having taken a circuits course, this was the first chance I have had since intro physics to build circuits and see them operate. As a practicing engineer with an electrical engineering degree, I feel it is vital for me to disclose my level of experience and expertise so that system reliability and safety is never compromised, yet I feel that this project has added significantly to my experience level. Even though this has been an intense and valuable learning experience, it has, if anything, opened my eyes to the complexity of systems designed today and the need for one to only undertake technological tasks for others if qualified by training or experience. Given the number of bugs and difficulties I found throughout the process of designing this simple data logger, it is mpressive to me that there are not more large system failures. With individual and collective experience comes protocol for testing and interfacing that has allowed complex systems to be successfully designed, yet it is vital that the designers recognize their limitations.
Legal considerations. For instance, if you use a transmitter, you must discuss the appropriate FCC legal restrictions.
There were no legal considerations for this project.
Appendices:
Appendix 1: Commented program listing
Commented code is here
Appendix 2: System schematic (Drawn using ExpressSCH)
Appendix 3: Cost details with all part numbers and their price (*or budget value).
| Hardware Description | Part Number | Price
| Development board | ATMEL STK500 | $15*
| Flash memory on board STK500 | | $0*
| MCU | ATMEL ATmega32 | $8*
| Salvaged whiteboards (2) | | $0*
| Header whiteboard for LCD: borrowed from Richard | | $0*
| 16x2 LCD Display | | $8*
| IC Photodiode Amplifier | OPT101P-ND | $5.50
| Battery sealed lead acid, 12V 5Ah | | $11.68
| 3.2W PV Panel: previously owned | | $0*
| Field effect transistor | Buz71 | $0*
| Schottky diode 20V 1A DO41 | 1N5817RLGOSCT-ND | $0.33
| High current inductor 680uH | DN4522-ND | $2.08
| IC step down switching regulator 5V .5A 8DIP | LM2574N-005OS-ND | $1.25
| Total cost: | $51.84
| |