|
Speech
Recognition Jukebox |
|
ECE 476
SPRING 2007 FINAL
PROJECT |

Matthew
Robbins and Arojit Saha
May 2, 2007
Table of Contents
Existing
Patents and Trademarks
Integration
of Hardware Components
For the Final Project in ECE 476: Designing with Microcontrollers,
Robbins and Saha developed a Speech Recognition Jukebox, comprised of a speech
recognition system that activated a simple music player. The speech recognition system was
capable of recognizing four commands and could cycle through a simple play list of three
songs. The jukebox could turn
itself on, begin play, move between tracks, and stop play all through user
voice commands.
In order to implement this design, Robbins and Saha needed to
combine several different hardware and software elements. A small microphone was purchased and
used to convert the human voice signal into a voltage signal. This alternating voltage signal was
amplified by 1,000 times using three LM358 operational amplifiers. Hardware frequency filters were used to
limit the frequency input and software frequency filters were used to parse the
signal into different frequency regions.
The values of the signal in these different frequency regions
helped to determine each individual word’s unique digital ‘fingerprint’. The fingerprints of important words,
such as commands for the music-playing element of the design, were stored into
the program. Each time a word was
spoken, the fingerprint of this sample word was compared to the stored
fingerprints to determine which command, if any, was spoken.
Recognized commands for the system are:
|
“ON” |
Turn
the music player on, play current song |
|
“END” |
Pause
the music player |
|
“SOON” |
Play
the next song |
|
“PREV” |
Play the previous song |
Table 1: Voice Commands Recognized by the System
Given the correct combination of commands, a simple music tune
would be played on the speaker of the television. A more in-depth analysis of the workings of both the
software and hardware sections of the design can be found below.
Speech recognition systems have been implemented in a variety of
different applications, most notably automated caller systems and security
systems. These systems have
progressed considerably in recent years and have the capability of performing
numerous tasks from simple user vocal commands. For the ECE 476: Designing with Microcontrollers Final
Project, Robbins and Saha’s ambition was to combine speech recognition
technology with music playback.
Robbins and Saha were inspired by the work of previous year’s groups,
whose work is cited in Appendix 5, which demonstrated that such a project was
realizable within the timing and hardware constraints of the ECE 476 Final
Project parameters.
The human hearing system is capable of capturing noise over a very
wide frequency spectrum, from 20 Hz on the low frequency end to upwards of
20,000 Hz on the high frequency end.
The human voice, however, does not have this kind of range. Typical frequencies for the human voice
are on the order of 100 Hz to 2,000 Hz.
Robbins and Saha would have hardware electrical filters that would pass
only the frequencies between approximately 150 Hz and 1,500 Hz and several
digital Butterworth filters that would work to parse this frequency spectrum
into smaller regions. Both of
these types of filters are discussed in more depth below.
But how often should one sample a signal that is oscillating at
these frequencies? According to Nyquist Theory, the sampling rate
should be twice as fast as the highest frequency of the signal, to ensure that
there are at least 2 samples taken per signal period. Thus, the sampling rate of the program would have to be no
less than 4,000 samples per second.
Also, the human voice moves a sound wave, which compresses and
decompresses the air as it moves.
As will be discussed below in the Hardware Design section, a microphone
was utilized to convert this compression wave into an electrical signal that
could be filtered, amplified, and analyzed.
The frequency spectrum of the human voice needed to be divided
into several sub-intervals to allow analysis of the specific frequency spectrum
of the word being spoken. Robbins
and Saha divided the frequency spectrum into seven (7) intervals using six
4-pole Butterworth band-pass filters and one 2-pole Butterworth high-pass
filter. The table below
illustrates the scope of each filter:
|
Filter |
Frequency Range |
|
Band-Pass Filter #1 |
150 Hz – 350 Hz |
|
Band-Pass Filter #2 |
350 Hz – 600 Hz |
|
Band-Pass Filter #3 |
600 Hz – 850 Hz |
|
Band-Pass Filter #4 |
850 Hz – 1100 Hz |
|
Band-Pass Filter #5 |
1100 Hz – 1350 Hz |
|
Band-Pass Filter #6 |
1350 Hz – 1600 Hz |
|
High-Pass
Filter |
above 1600 Hz |
Table 2: Frequency Range of Digital
Filters
The
Butterworth filter attempts to be linear and pass the input as close to unity
as possible in the pass band. In
the program design, the Butterworth filters manipulated the A/D converter
output into the frequency domain.
The code for both the high-pass Butterworth filter and the band-pass
Butterworth filter were written by Bruce Land and can be found on the ECE 476
course website. The band pass
Butterworth equation is as follows:
![]()
Equation 1: Band-Pass Butterworth
Filter
The
high pass Butterworth equation is as follows:
![]()
Equation 2: High-Pass Butterworth
Filter
After
deciding on the sub-intervals for the digital filters, Robbins and Saha wrote a
MATLAB function to find the b1, a2, and a3 coefficients for all seven
filters. The coefficients were
found using the butter()
function in MATLAB.
The output of the digital filters would help to formulate a
digital ‘fingerprint’ that was unique for each word. Five samples were taken from each digital filter, thus
yielding 35 total samples that would comprise the digital fingerprint of each
word. The fingerprints of the
dictionary words, “ON”, “END”, “PREV”, “SOON”, were stored in the software
program. Whenever the user input a
command to the system, this sample’s digital fingerprint would be calculated
and then compared to each of the dictionary words.
To compare the dictionary words with the sample, the program
calculated the correlation of the two vectors. The pair with the highest absolute value correlation was
chosen as a match. When an input
command word was recognized as a dictionary word, the control section would set
a series of flags that would update the state machine. This state machine would change state
on these flags being set and each state corresponded to a separate song being
played.
Robbins and Saha chose three songs to be played by the jukebox - a
Sonatina written by W.A. Mozart, “Ode to Joy” written by Ludwig van Beethoven,
and the Star Spangled Banner.
These songs were chosen because of their simple melody and easy
recognition. Using the audio
production code provided in Lab
4: Digital Oscilloscope,
shown below, these songs notes were converted into a format that could be
played on the television speaker.
|
Note |
C |
D |
E |
F |
G |
A |
B |
C |
D |
E |
F |
G |
A |
B |
C |
Rest |
|
Value |
239 |
213 |
189 |
179 |
159 |
142 |
126 |
120 |
106 |
94 |
90 |
80 |
71 |
63 |
60 |
0 |
Table 3: Conversion Table for
Musical Notes
(Bold
C corresponds to middle C)
The logical structure of the program is quite simple. The user will speak the desired command
into the microphone. The
microphone will convert this audio signal into an electrical signal, which will
then be filtered and amplified before being sent to the A to D converter. The program A to D samples the input,
and the output of the A to D converter is run through seven digital
filters. The control section uses
the outputs of the seven digital filters to obtain a working fingerprint of the
spoken command and compares this fingerprint with those stored fingerprints to
decipher which command, if any, has been spoken. Upon recognizing a user command, a state machine within the
control section will change state.
Each state of this state machine corresponds to a separate song being
activated. Thus, upon changing
state, a different song signal will be sent to the television audio connection,
enable music playback. A simple
schematic of the logical structure can be found below in Figure 1.
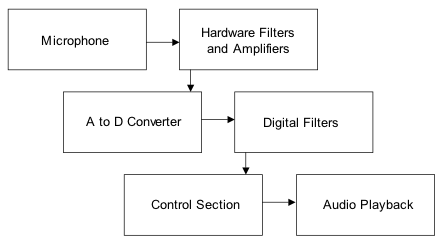
Figure 1: Logical Structure of
Speech Recognition Jukebox
To be able to execute all the commands in the program, there need
to be enough clock cycles. The
Mega32 clock runs at 16 MHz (16 million clock cycles per second). As the code requires that the A to D
converter be sampled at a rate of 4 kHz, all the code for the program must be
able to execute in 4,000 clock cycles (16 million / 4 kHz). Thus, the hardware must be able to work
in real time and not further limit the capabilities of the program. As the hardware is mostly comprised of
resistors and capacitors, and the LM358 is a relatively fast op-amp, there are
no concerns with regard to hardware affecting the software.
The only constraint remains that all the computations performed by
the program be able to fit it 4,000 clock cycles. The seven digital filters will consume the majority of the
clock cycles. Each 4-pole
band-pass Butterworth filter takes up 228 clock cycles and the 2-pole high-pass
Butterworth filter takes up 148 cycles.
Thus, all the filters together will consume 1,516 cycles. This yields almost 2,500 clock cycles
for the remainder of the code, which is more than enough space.
Existing Patents and Trademarks
Several phone and technology companies, notably AT&T and
Microsoft, have patented speech recognition technology. Robbins and Saha do not believe that
their design will infringe the rights of these companies’ patents as it will a
unique, novel and non-obvious approach to speech recognition using original
hardware and software design.
The
dataflow of the program begins with the output of the A/D converter. This value is stored in the variable Atemp.
Atemp is set in
the Timer/Counter 1 interrupt, which runs every 250 ms (4,000 times per second). Atemp is then passed to the seven digital
Butterworth filters using a function called setfilters(), which is also run in the interrupt. After the filters have been set, the
program enters the player()
function, which contains the state machine that runs the voice recognition
section of our program.
The
player() function is
broken up into six states: TAKE,
WAIT1, ON, END, AFTER, LAST. The
TAKE state is considered to be the off state of the jukebox. When button 7 is pressed on the STK500
board, the player turns on. The
user will have to press button 6 to use the voice recognition portion of the
state machine. Upon this button
being pressed, the state machine is in the WAIT1 state. In this state, the state machine is
waiting for the user to say the word “ON.” This signals to the state machine that the user wishes to
start the player. After the user
says “ON,” the state machine enters the ON state and begins playing song 1
(“Ode to Joy”).
Once
in the ON state, the voice recognition state machine has four possible
routes. If the user says “SOON,”
the state machine assumes the user wants to play the next song (song 2). If the user says “PREV,” the state
machine assumes the user wants to play the previous song (song 3). The user can also say “END,” indicating
the user wants to pause the playback of the song. Based on whether the user says “SOON”, “PREV”, or “END”, the
player state machine enters the AFTER, LAST, or END states, respectively.
In
the AFTER state, the state machine plays song 2. If the user says “SOON”, the state machine enters the LAST
state and plays song 3. If the
user says “PREV”, the state machine enters the ON state and plays song 1. In the LAST state, the state
machine plays song 3. If the user
says “SOON”, the state machine plays enters the ON state and plays song 1. If the user says “PREV”, the state machine
enters the AFTER state and plays song 2.
If at any time button 7 is pressed, the state machine goes back to the
TAKE state and the player has been turned off. A diagram of this state machine is found below.
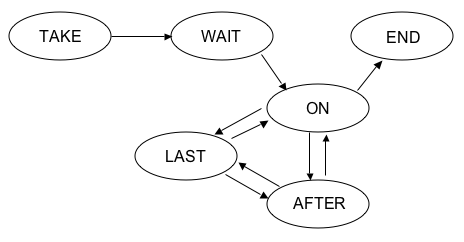
Figure 2: Diagram of player() state
machine
In
the player() state machine, the voice recognition system is always
running. The samples coming in
from the Butterworth filters are compared to a set of dictionary fingerprints. A correlation function is run to see
which dictionary fingerprint most corresponds to the sample. Whichever dictionary fingerprint
produces the highest (closest to 1) absolute value is most similar to the word
being spoken by the user. This
section involved the most debugging of our program. Initially, we had the user input in various dictionary
definitions at the start of the player() state machine.
However,
every sample is different and consistency could not ensured every time the
program was run. For this reason,
Robbins and Saha created a different program that saves words and outputs these
words in the Hyperterm terminal.
This program was used to create dictionary fingerprints and to store
them in SRAM. Robbins and Saha took two samples each for every dictionary
word. The inspiration for this
idea came from the Voice Controlled Car from the Spring 2006 semester of ECE
476, whose code is referenced in the Appendices.
Another
problem with the system that required considerable debugging was that initially
Robbins and Saha used Euclidean distances to relate samples to dictionary
fingerprints. However, this
approach was fairly inconsistent and did not work often enough to be
useful. This inconsistency was due
to the variation between samples.
While looking through the Spring 2006 semester of ECE 476, Robbins and
Saha saw the Voice Recognition Security System used correlation to relate
samples to dictionary fingerprints and had a increase in recognition rate. This group’s code is also referenced in
the Appendices.
Based
on their design, Robbins and Saha decided to try correlation and had an
increase in recognition rate. This
approach was proven to be more successful thanks to outputting the state of the
player() state machine to the Hyperterm terminal after a sample was spoken. Robbins and Saha also had problems with
recognition of certain words over other words. Several words were tried before deciding on the final list
including, “NEXT”, “AFTER”,
“STOP”, and “PAUSE”.
Hardware Design
As mentioned above in the High Level Software Design section, the
human voice is comprised of numerous different frequencies emitted as a
compression wave through the air.
In order to perform analysis on a vocal sample, this compression wave
would need to be transformed into an electrical signal using a microphone. The electrical output of the microphone
was filtered and amplified several times in order to produce a clean and
responsive voltage signal. Each of
the separate hardware components used to perform these tasks is discussed
individually below, followed by a discussion of each section’s integration and
specific design choices made by Robbins and Saha.
To convert the human voice
compression wave to a voltage signal, Robbins and Saha used a microphone
purchased a small microphone (Part#
423-1027-ND) from the Digi-Key Corporation. This microphone’s ground and output
connections needed to be soldered to the white board and the output was then
filtered using a high-pass filter.
As can be seen on the data sheet, this specific microphone had an
operating frequency range of 300 Hz to 6,000 Hz, which is an appropriate
frequency range for measuring the human voice. However, the signal produced by the microphone was so small
that it needed to be amplified considerably and is discussed below in the
integration section. Schematics of
the connections of the microphone and its circuit connections can be found
below.
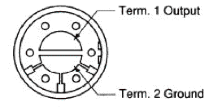
Figure 3: Schematic of Digi-Key
Part #423-1027-ND Microphone

Figure 4: Schematic of Connections
and High-Pass Filter
A high-pass filter is designed
to pass all frequencies above a predetermined cutoff frequency (fcHP) and to attenuate any
frequencies below this cutoff frequency.
Below the cutoff frequency, the output of a high-pass filter will
decrease by -20dB/decade, or by a factor of 10 for every order of magnitude
decrease in frequency. For a
passive resistor, the cutoff frequency is determined by the values of the
resistor and capacitor used. The
cutoff frequency is related to the resistor and capacitor values by the
following formula:
![]()
Equation 3: Cutoff Frequency of High-Pass Filter
In order to achieve the desired
filtering result, the resistor and capacitor must be arranged as shown in the
figure below:
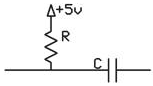
Figure 5: Circuit Schematic of
High-Pass Filter
A low-pass filter is designed to
pass all frequencies below a predetermined cutoff frequency (fcLP) and to attenuate any
frequencies above this cutoff frequency.
Above the cutoff frequency, the output of a low-pass filter will
decrease by -20dB/decade, or by a factor of 10 for every order of magnitude
increase in frequency. For a
passive resistor, the cutoff frequency is determined by the values of the
resistor and capacitor used. The
cutoff frequency is related to the resistor and capacitor values by the
following formula:
![]()
Equation 4: Cutoff Frequency for Low-Pass Filter
In order to achieve the desired
filtering result, the resistor and capacitor must be arranged as shown in the
figure below:
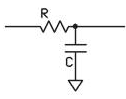
Figure 6: Circuit Schematic of
Low-Pass Filter
The non-inverting amplifier is a
three-port circuit, with two input ports and one output port. The two input ports, labeled (–)
and (+) on the circuit diagram below, are referred to as the non-inverting and
inverting inputs, respectively.
The inverting input is connected to ground through a resistor and the
non-inverting input is connected to the signal to be amplified. By utilizing a feedback resistor
between the inverting input and the output, the input signal to the
non-inverting input will be amplified.
The feedback resistor (Rf) and the grounded resistor (Rin) form a voltage divider with
the feedback voltage. The feedback
voltage can be written as follows:
![]()
Equation 5: Relationship of input and feedback voltage for a
Non-inverting Amplifier
The gain of this circuit,
expressed as Vout/Vin, can be expressed as (Rf + Rin)/ Rin, or Rf / Rin + 1. The resistor connected to the non-inverting input (R+) has no effect on the gain of
the circuit. The circuit
connections for a non-inverting amplifier can be found below.
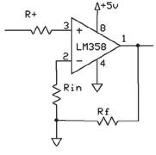
Figure 7: Circuit Schematic of
Non-Inverting Amplifier
Integration
of Hardware Components
A white board was used to
connect and integrate all the separate components of the hardware section of
the project.
In order to operate properly,
the ground and output connections on the microphone needed to be soldered to
two pieces of wire and then connected to the white board. This output connection was connected to
a high-pass filter with a 1 kW resistor and 1 mF capacitor, giving this filter
a cutoff frequency 159 Hz. This
cutoff frequency is low enough that almost all frequencies of human speech were
able to pass through to the rest of the circuit. The value of this cutoff frequency was important because it
ensures that the 60 Hz electrical noise was not included in the circuit.
The voltage signal produced by
the microphone was an alternating voltage (AC). However, this AC signal was very small and needed
considerable amplification to be recognized by the Analog to Digital (A to D)
converter. The microcontroller’s A
to D converter, discussed above in the software section, was set to assign an
output value from 0 to 255 for input voltage values between 0 V to 5 V, with
output value 0 corresponding to input voltage 0 V. Each unit increase of the A to D converter corresponds to
approximately 20 mV, meaning that the fluctuation of the microphone voltage
signal needed to be at least this large in order to be noticed by the A to D
converter. Upon inspection, an
amplification factor of 1,000 was most suitable for this voltage signal. Robbins and Saha used three LM358 operational amplifiers (“op-amps”) to
amplify the signal, with each op-amp amplifying the signal by a factor of 10.
It is important to note here
that the LM358 op-amp is not a rail-to-rail amplifier. It’s lower rail is 0 V and its upper
rail is 3 V, meaning it will not output a voltage signal above 3 V. To accommodate this design
constriction, the non-inverting input to the op-amp was set to 1.6 V, about
halfway in-between the op-amp’s rails, by using a 2 kW and a 1 kW resistor voltage divider. While testing the amplifier setup,
Robbins and Saha noticed that the amplifier amplified both the AC and DC
components of the signal, thus it was necessary to block the DC component of
the signal using a capacitor, otherwise the output would be on the order of
10*1.6V, which would have been above the output capabilities of the
op-amp. To ensure that only AC
signal reached the non-inverting input of the op-amp, a 1 mF capacitor was connected to the
voltage divider.
The input of the op-amp also
acted as another high-pass filter.
The resistive component of the filter is the Thevenin equivalent
resistance of the 1 kW and 2 kW resistors in parallel, 666
ohm. Using a 1 mF capacitor, the cutoff
frequency of this high-pass filter is 239 Hz, which was low enough that almost
all frequencies of human speech were able to pass through the circuit.
To create a 10x voltage
amplifier, a 10 kW and a 1 kW resistor were used in the non-inverting amplifier
set up described above yielding a gain of 11, which is approximately 10. Also, to ensure that only the AC signal
gets amplified, a 1 mF capacitor was connected from the 1 kW to ground.
This same amplifier arrangement
was repeated three times to enable the signal to be amplified by a factor of
1,000.
While testing the output of the
microphone on the oscilloscope, Robbins and Saha noticed a considerable amount
of high-frequency noise prevalent in the circuit. To attenuate this unwanted noise, a low-pass filter was added
to filter out this high-frequency noise.
A 1 kW resistor and .1 mF capacitor were used to give
the filter a cutoff frequency of 1,591 Hz. This cutoff frequency was high
enough that almost all frequencies of human speech were able to pass through
the circuit. Upon making this
adjustment to the circuit, the output of the microphone was a very clean signal
and responded well to any vocal or other audio input, as verified by the
oscilloscope. Below are a circuit
schematic for the microphone circuit and a picture of the actual one used by
Robbins and Saha.

Figure 8: Overall Schematic of Microphone Circuit
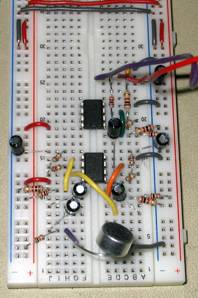
Figure 9: Picture of Microphone
Circuit on White Board
The circuitry for the television
circuit was far simpler. The
output for the audio was set as the PORTB.3 output pin. This output was connected to ground
using a 10 kW resistor. A
coaxial cable was connected to the PORTB.3 output pin and properly
grounded. This coaxial cable served
as the connection to the audio input in the back of the television. The television was set to TV mode and
powered on. With proper circuitry,
the tunes played by the jukebox were clearly audible. A picture of the television used in the audio playback section
of the jukebox is found below.
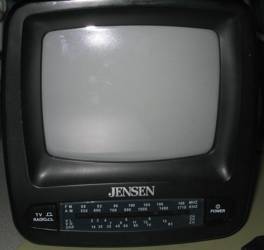
Figure 10: Picture of Television
used for Audio Playback
The
Speech Recognition Jukebox worked.
Upon prompting it with the correct series of commands, the television
audio speaker played the songs that were supposed to play and in the correct
order. The speech recognition
system did not always recognize command words, but after several repetitions,
it would proceed to the correct state and play the correct song. Erroneous words were input into the
system and were ignored, as is consistent with the design specifications. The speech recognition algorithm used
in the program was simpler than commercial algorithms. Due to concerns regarding the capacity of
the Mega32 microcontroller, these more complex algorithms were not used in the
project design.
The
music played was rough, but clearly recognizable as these popular songs. The Hyperterm terminal was kept open
and updated as the state changes, and the LEDs on the STK500 board also
provided feedback as to the correct functioning of the system. The system was disrupted occasionally
by background noise in the lab. A
laugh, cough, or other noise in the lab would sometimes affect the performance
of the system.
There
were no threatening safety concerns with the project. Both the microphone and television circuit were low power
and had no moving parts.
The
Speech Recognition Jukebox was coded for the voices of Robbins and Saha and
worked well for these users. A
fairly easy process could be used to incorporate any other user’s voice.
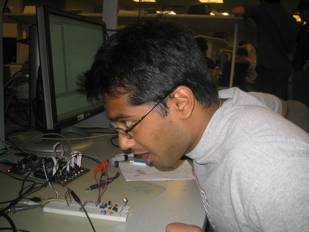
Figure 11: Arojit Saha testing the
Speech Recognition System
Hours
of coding and debugging resulted in a design that recognized several key input
commands and played music on the television audio speaker. In this regard, the program was a
success. However, when initially proposing
the project idea, Robbins and Saha had hoped to be able to incorporate a more
elaborate play list with more specific commands, such as a volume option. The speech recognition portion of the
program took far longer than anticipated as the algorithms needed to identify
which words were being spoken took considerable effort to perfect and were not
well conceived until later in the project. Given the opportunity to complete the project again, Robbins
and Saha would have dedicated more time and thought towards the speech
recognition algorithm design earlier in the project, which would have enabled
more options to be included in the later weeks of the project.
The
Speech Recognition Jukebox required Robbins and Saha to incorporate knowledge
learned in several ECE courses taken by both students. To develop the hardware circuit, they
needed to use circuitry design skills developed in ECE 210 and ECE 315. To work with the frequency spectrum of
speech and the digital filter design, the students needed to use skills learned
in ECE 220. In order to manipulate
the assembly code and C code, the students depended on skills they learned in
ENGRD 230 and ECE 314. The
incorporation of these separate topics and the complexity of the design of the
program demonstrate that the project was the appropriate level of
hardware/software complexity.
The
project worked to the specifications set by Robbins and Saha. To make the program work to these
specifications, Robbins and Saha needed to use almost all of the time allotted
for the final project. All
materials for the lab, including those purchased from external vendors, totaled
only $41.36, which was below the budget of $50 set for the lab. A detailed cost and itemized expenses
breakdown can be found in the Appendices.
The
only intellectual property considerations to consider are the patents
surrounding speech recognition.
Several phone and technology companies, including AT&T and
Microsoft, have speech recognition patents. However, Robbins and Saha developed their speech recognition
program independent of any designs specified in these patents. This unique and novel design would make
it possible for Robbins and Saha to patent their design. It is important to note that Robbins
and Saha used code provided by Professor Bruce Land for the digital filter
design and referenced code provided by previous groups for help in debugging
the speech recognition algorithm of the project.
In
accordance with the IEEE Code of Ethics, Robbins and Saha made several design
decisions. Robbins and Saha accept
all responsibility of any consequences of design choices during the creation
and testing of the ECE 476 Final Project.
Although no severe safety issues or environmental issues exist with the
current design, should any arise, it is our responsibility to disclose these
finding to the public. No
conflicts of interest exist and should they arise, we will disclose those
issues to the affected parties.
Robbins and Saha were honest and realistic in all claims and estimates
based on available data and did not engage in any questionable moral practices
with regards to bribery or coercion.
The aim of the project was to gain a better understanding of programming
with microcontrollers, as that was the goal of this course, but also to further
the understanding of speech recognition technology and be able to pass this
knowledge on to subsequent classes through the use of the course website. Any honest criticism of the work
performed by Robbins and Saha is encouraged and greatly appreciated. This feedback will only help to further
our knowledge and understanding of this subject. Robbins and Saha do not discriminate or judge people based
one race, religion or any other factors and avoid at all costs any injuries
inflicted upon others. Robbins and
Saha are pleased that they were able to complete this project in the allotted
time and were given the chance to give back to the ECE 476 community through
the course website and the posting of this final lab report.
Appendix 1 - Commented
Final Code
Voice
Recognition Jukebox Final Code
Appendix 2 - Circuit
Schematics
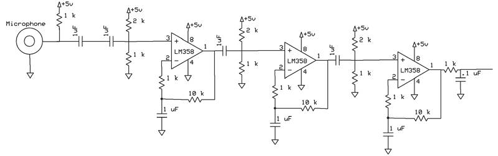
Figure 12: Overall Schematic of Microphone Circuit

Figure 13: Picture of Microphone Circuit on White
Board
Appendix 3 - Costs and
Itemized Expenses of Project
|
Item |
Unit Cost |
# Used |
Cost |
|
|
|
|
|
|
Atmel Mega32 Microcontroller |
$8.00 |
1 |
$8.00 |
|
White board |
$6.00 |
1 |
$6.00 |
|
STK 500 board |
$15.00 |
1 |
$15.00 |
|
Power Supply |
$5.00 |
1 |
$5.00 |
|
Digi-Key Microphone #423-1027-ND Manufacturer Part #MD9752NSZ-0 |
$2.36 |
1 |
$2.36 |
|
Black and White Television |
$5.00 |
1 |
$5.00 |
|
LM358 Operational Amplifier |
$0.00 |
2 |
$0.00 |
|
Resistors |
|
|
|
|
1 kΩ |
$0.00 |
8 |
$0.00 |
|
2 kΩ |
$0.00 |
3 |
$0.00 |
|
10 kΩ |
$0.00 |
4 |
$0.00 |
|
Capacitors |
|
|
|
|
1 μF |
$0.00 |
7 |
$0.00 |
|
.1 μF |
$0.00 |
1 |
$0.00 |
|
|
|
|
|
|
Total Project Cost |
|
|
$41.36 |
Table 4: Costs and Itemized Expenses of Project
Appendix 4 - Division of
Project Tasks
|
Project Task |
Member Responsible |
|
|
|
|
Software |
Robbins and Saha |
|
Digital Filter Design |
Saha |
|
Control Section |
Robbins and Saha |
|
Audio Playback |
Robbins and Saha |
|
Debugging |
Robbins and Saha |
|
Testing |
Robbins and Saha |
|
|
|
|
Hardware |
Robbins and Saha |
|
Microphone Connection |
Saha |
|
Filter Design |
Robbins |
|
Amplifier Design |
Robbins |
|
Television Connection |
Robbins |
|
|
|
|
Project Research |
Robbins and Saha |
|
|
|
|
Lab Report |
Robbins and Saha |
Table 5: Division of Project Tasks
(Bold indicates group member primarily
responsible)
Appendix 5 - References
used
Data sheets
Digi-Key Microphone Part# 423-1027-ND
Vendor sites
Code/designs borrowed from others
ECE 476: Designing with Microcontrollers website
Prof.
Land’s 2-pole Butterworth Filter code
Prof.
Land’s 4-pole Butterworth Filter code
Tor's
Speech Recognition reference code
Spring
2006 Voice Recognition Security System