You will produce a sine wave using the PWM output of timer1. The frequency will be set from a keyboard. A LCD display will show the peak-to-peak voltage and frequency of the signal determined from analog-to-digital (A/D) converter measurements of the signal. Timer0 will be used as the timebase for the A/D converter.
Procedure:
The PWM output should be lowpass-filtered using an RC circuit with a time constant at least ten times the PWM pulse-time. The A/D input is limited to 0-2.0 volts, while the output of the RC circuit will be centered around Vcc/2. Also, the A/D input impedance is only about 6Kohm. We thus need a circuit to:

The A/D converter input should be connected to the output of the op amp. See the A/D documentation for a schematic.
As in Lab 5,
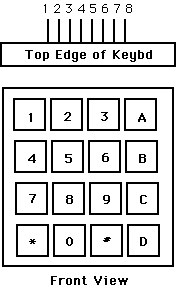
the Keyboard:
You will need to get user input from a keypad with the following
configuration.

Pin 1  -- row 1 2 3 A
Pin 2  -- row 4 5 6 B
Pin 3  -- row 7 8 9 C
Pin 4  -- row * 0 # D

Pin 5  -- col 1 4 7 *
Pin 6  -- col 2 5 8 0
Pin 7  -- col 3 6 9 #
Pin 8  -- col A B C D

(a) Each switch shorts one row to one column.
(b) Each pin should be connected to one
    bit of an i/o port.
(c) The i/o port pins will be used both
    as inputs and outputs. When they are inputs,
    they should have the pullup resistors
    activated.
As in lab 5, the Liquid Crystal Display (LCD):
LCDpin 	Connection
------  ----------
1	gnd - Port A
2	+5 volts - PortA7
3 	trimpot wiper
4	PortD6
5	PortD5
6	PortD4
7-10	no connection
11	PortD0
12	PortD1
13	PortD2
14	PortD3
Write a program which will:
V = x.xx yy

F = zzzz yy
to the LCD.
The x.xx
represents a four digit ascii number determined from the peak-to-peak
voltage. The zzzz represents the frequency.
The yy represents
one of two strings: "V " or "Hz".
When you demonstrate the program to a staff member, you should exercise the keyboard commands and show that the measurement displayed on the LCD is correct. The TA will probably supply a waveform for you to analysis.
Your written lab report should include: