“A safe and quick way to measure someone’s heart rate.”
Elevator Pitch
For our final project in Electronic Bioinstrumentation, we extended our knowledge from previous labs and added to what previous labs had required in order to design a dry contact (gel less) electrode ECG sensor. The idea for this project is to provide a safe and simple method of measuring someone’s heart rate without any electrode gel. This idea was chosen because of our previous labs which measured EMG and ECG from wet contact. This intrigued us to pursue an ECG project that would require a user to just touch a metal bar without putting on electrodes or gel.
High Level Design
Goal
The goal of our project was to design and fabricate a low cost ECG. The rationale behind this project was to utilize cheap materials for a low cost ECG that could be used to measure a person’s heart rate. Our interest in further developing our previous labs about ECG was a key influence in doing this project. Since the idea behind this project was a treadmill heart rate monitor, the main goal for this project was to safely detect a heart rate without any wet contact. Sources for this project idea were academic papers on the IEEE site, our professor Bruce Land, and previous labs that spurred interest in doing an ECG related project.
Background Math
Background math needed for this circuit design required the ability to calculate frequencies, filtering and gain, and the max current able to pass through a human body. For the first, most of the frequency calculations were done in MATLAB with their built-in features. For filtering and gain, math needed was specific formulas to calculate the frequency cut off and gain. For example, for the low pass filter, the frequency cutoff is 16 Hz and therefore the capacitor needed was 33,000 pF and the resistor needed was 300 kOhms. To calculate the gain, we had to choose an RG value that could provide a big enough signal strength to analyze when passed into the NIDAQ. This all mostly requires arithmetic and basic algebra to find component values in order to achieve the wanted gain, frequency, and filtering.
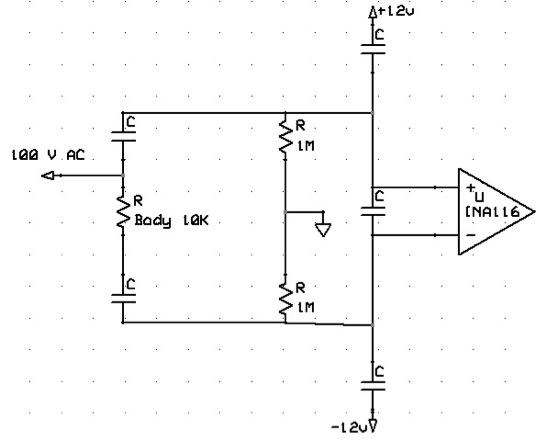
The diagram below depicts the front end of our circuit in the case where the user contacted a 100 V AC power supply with one hand. The voltage must pass through the body (10 kOhms) and a 1M ohm resistor in order to reach ground. Since the 1M ohm resistor dominates, the current can be calculated by I = V/R, where V is 100 and R is 1000000. This gives a current of 100/1000000 = 0.1 mA passing through the body. According to a Dartmouth study on the physiological effects on electric shock, you need 1 mA in order to feel any sensation at all, meaning that the user would have to come in contact with a 1,000 V AC power supply to feel anything. Painful shock occurs at 10 mA or contact with a 10,000 V AC power supply. And death can occur at 100 mA or contact with a 100,000 V AC power supply.
Block Diagram
The logical structure of this ECG design can be seen in the block diagram below. This displays the general main set up of the core control of this ECG circuit.

The signal is passed in through the dry electrodes (the metal bars) and with that, in order to ensure safety, capacitors are the first component in the circuit to provide input conditioning. Shortly after that the signal needs to be amplified and filtered, and then digitally processed and filtered again to show a cleaned up version of one’s heartbeat.
Trade-offs and Issues
Issues that arose were noise from surrounding metal pieces that could throw off the input signal or distort it. In addition to the electromagnetic interference, there were minor tradeoffs or issues that arose in hardware and software.
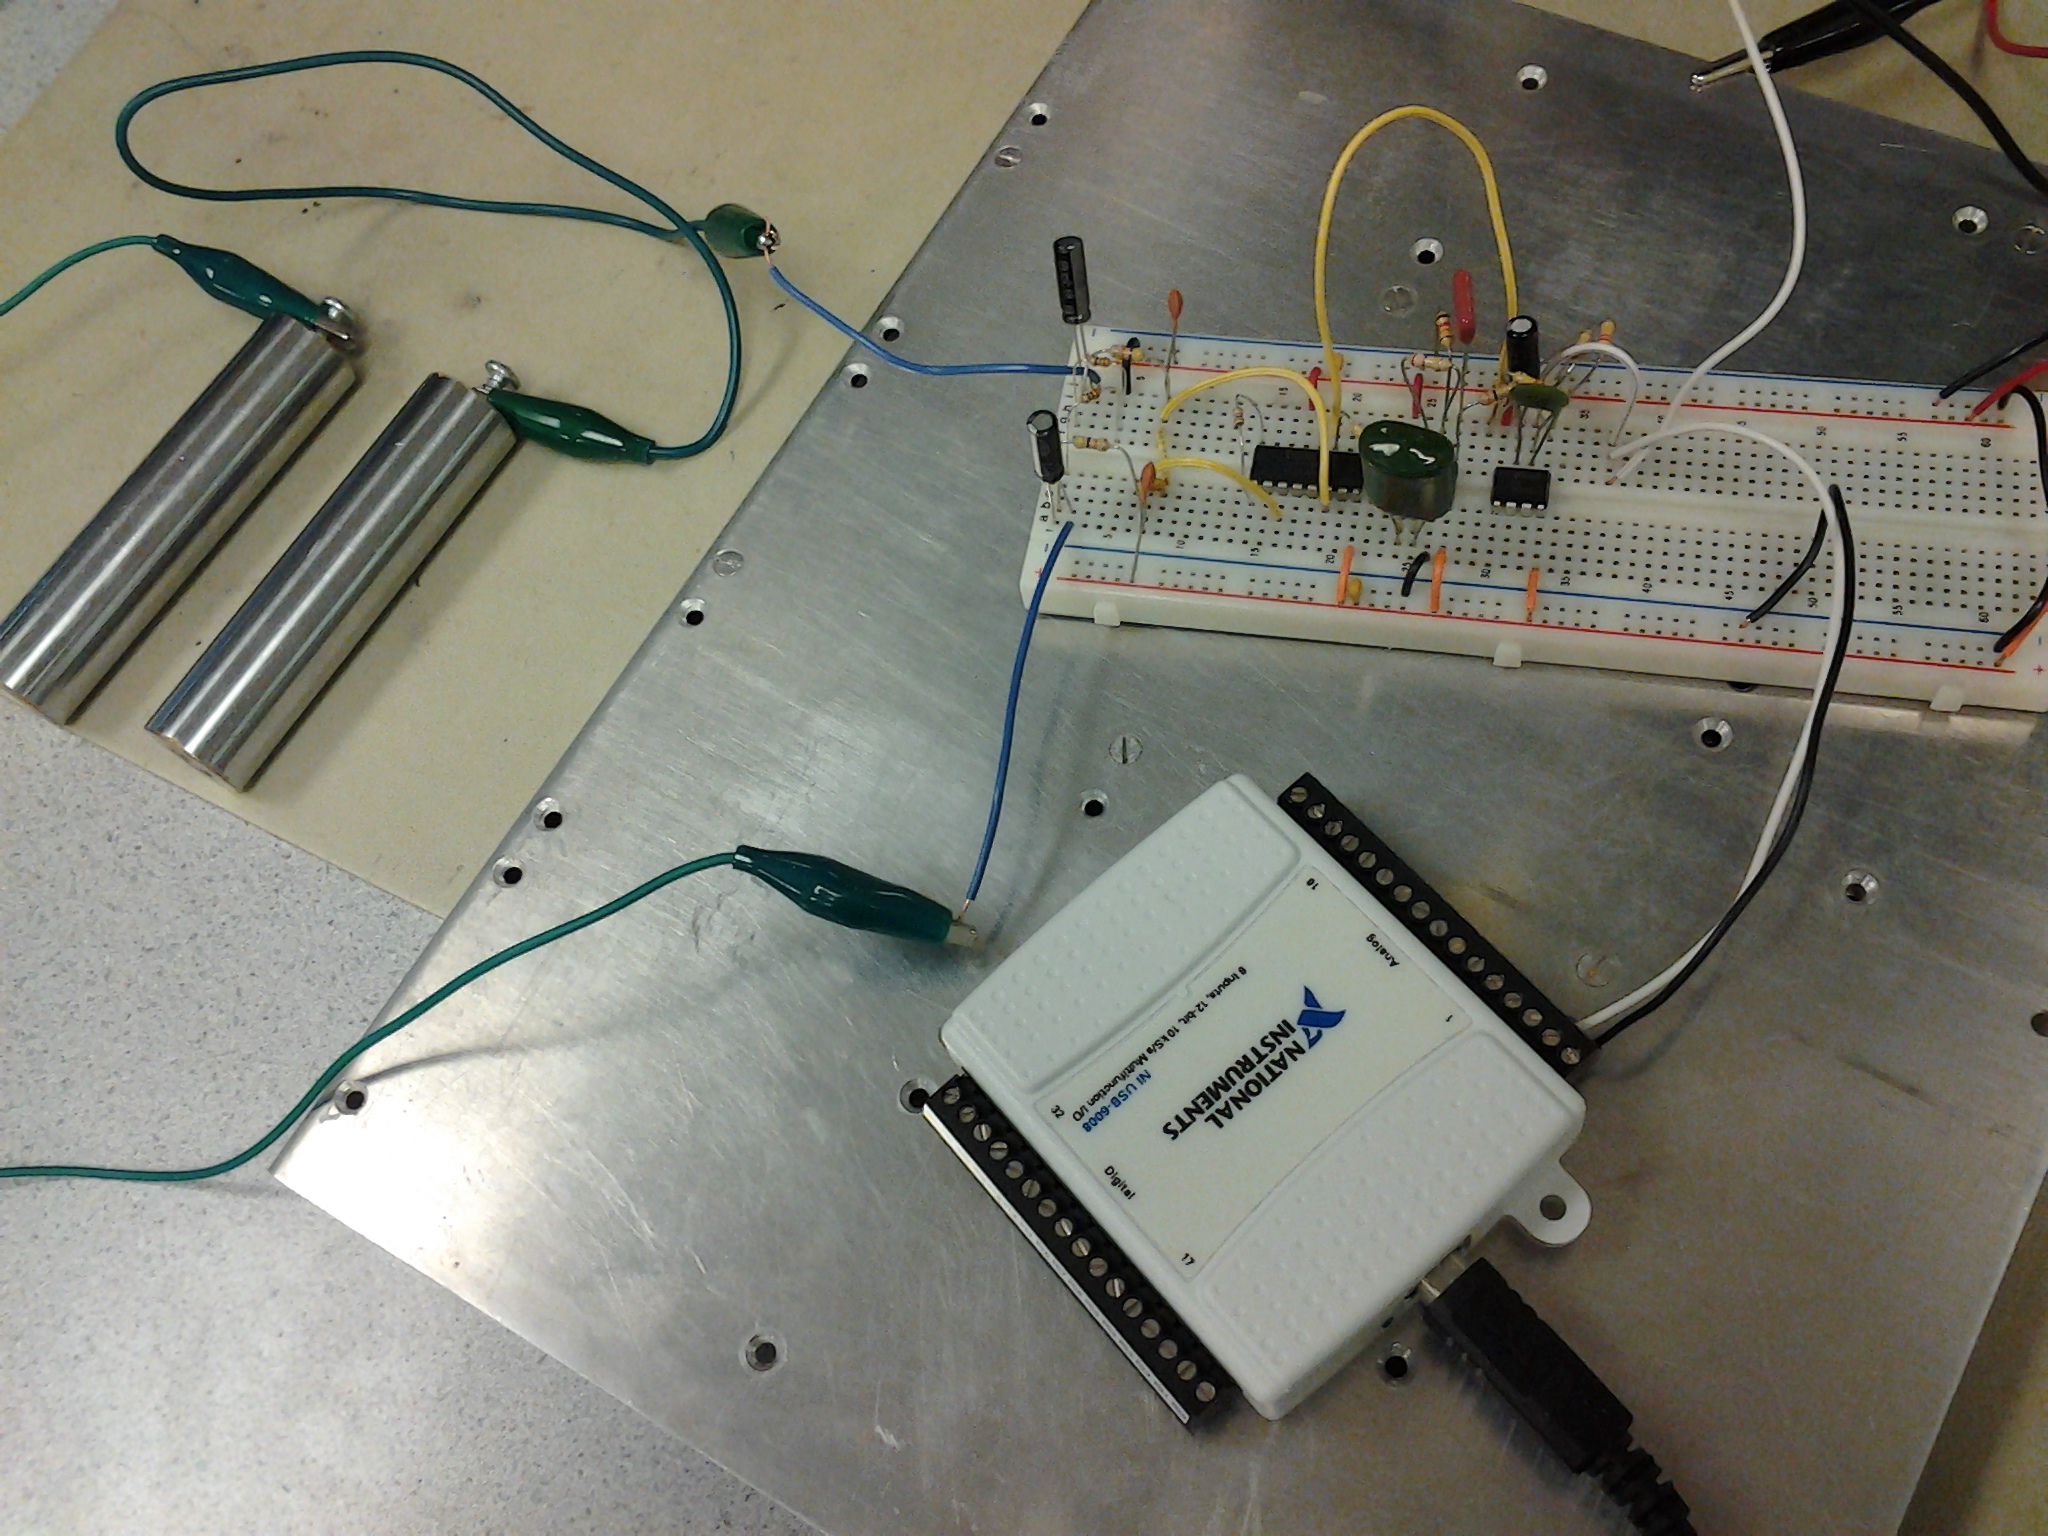
Hardware trade-offs were scarce. A minor trade-off is since we are using metal bars and exposed hardware on our breadboards, we sacrificed appearance for convenience. This is a trade-off because during testing we needed the hardware to be exposed for easier access in order to change the amplification (RG value).
We were only forced to make one significant trade-off in the implementation of our program. In order to be truly real time, the program must update every time a new data point is taken. This is impossible for our system because the filtering and computations take more than 1 ms (sample rate is 1000 Hz). Because of this we are forced to grab samples of size 100 accumulated over the last 100 ms and then plot them. This gives our system a 100 ms delay. In addition to making the system not perfectly real time, the sample size of 100 causes the plot to move by 100 ms every update, this makes it look less continuous than if it were updated every sample. However, in practice these tradeoffs are hardly noticeable to the user. A user can’t even notice the 100 ms delay, and in some ways it makes the system more believable since it takes about that long for a person to recognize their own heartbeat. Also, a update time of 100 ms gives a framerate of 10 fps, but since the change is small between frames (only a 100 ms shift over 5000 ms), it looks quite continuous.
Patents/Copyrights/Trademarks
There are patented ideas out there for heartrate systems that are incorporated into treadmills. One example is LifePulse, a digital heart rate monitoring system. However, these patents and copyrights implement their separate technologies to digitally filter noise. While the ideas may be similar, the solutions for these vary.
Legal issues that may arise with this project mainly revolve around the safety and security of the patient or user. This being said, our product is safe because of the blocking capacitors which cause DC-isolation along with the limited current passing through. From our calculations, since the voltage must pass through the human body at about 10 kOhms and there is already a 1 mega ohm resistor to ground, this means that there is at most 0.1 mA passing through the body. See background math for a more thorough explanation. In addition to this, it is secure in that nothing is being logged or recorded and therefore as the heartrate is calculated, previous heartbeats and heartrates are being overwritten in real time. Therefore, there is no stored information to affect user's privacy.
Program & Hardware Design
Software
When the program is initially run it first runs initialization steps before entering the data reading and display section. These initialization steps include initializing variables used in the program, defining the input device, setting up the GUI, initializing the plots, and initializing data collection. Initializing the variables is simple, and most of the variables are set to values that give the best results, while others are just initialized to 0 or empty vectors. It is important to note that the bpmstaticprev and bpmstring variables are initialized to 80. This tells the program that initially heart rates near 80 are reasonable. If the subject has a heart rate much less than or much greater than 80 the program will readjust accordingly. The realtime variable is also initialized to 100, this sets the sample size used during data collection. Since the input device is set to sample 1000 times per second, a sample size of 100 means that a new sample is grabbed every .1 seconds. The input device is also defined. A few important properties to note are the inputtype and samplerate, which are set as ‘singleended’ and 1000 respectively. Singleended ensures that the NIdaq (input device) is reading data relative to ground, while a samplerate of 1000 sets the sampling frequency to 1000 samples per second. Next, the GUI is generated. All the GUI controls and labels are initialized in this section, and the layout can be seen below:
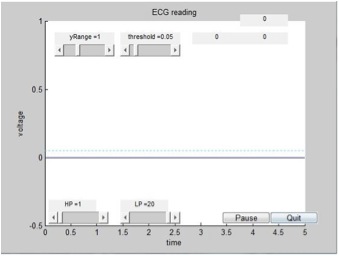
Once the GUI is initialized, the plots of the ECG waveform, Pan-Tompkins plot, and threshold line are initialized. Finally, in the last step before data collection and the display begin, the program starts the sampling of the input device in a way that peekdata may be called continuously without restarting the device each time. The program then pauses for one second so that enough data can be collected to build the first plot. After this the program begins collecting and displaying data and results.
Until the user presses the Quit button, the program continuously loops through a while loop in order to collect and display data. There are several important steps in the loop. The first step is sampling the data from the input device, once this sample is captured it is placed at the end of the vector of values to be displayed. This vector is then shifted to the left, dropping the number of values equal to the size of the sample that were at the front. This vector is not yet ready to be displayed. It now goes through a high and a low-pass filter. The cutoff frequencies of these filters are settable in the GUI. After passing through the filtering stages the vector contains transients at either end (these transients are a result of filtering), these transients are removed so that they do not interfere with BPM calculations. Finally, before it is ready to be displayed, the vector is multiplied by 10 times the absolute value of itself. This serves to amplify the signal and make it more visible on a plot.
The next step is to calculate the heart rate of the signal in beats per minute (BPM). To do this, the program takes the processed signal and runs the Pan-Tompkins algorithm on it. This requires two simple steps. The first is to square the signal so it consists of only positive values, and the second is to convolve it with a rectangle. The result of this process is used to determine the locations of the beats.
Once this is achieved, the program uses the user set threshold to find the rising edge of each beat. It is important that this threshold be high enough so that only the rising edges of beats will cross it. Once the locations of the beats are determined we run them through our heart rate calculating algorithm to determine the heart rate in BPM.
This algorithm was by far the most difficult piece of the program to write and it is quite complex. It is important to note first that the algorithm is run only once every .5 seconds, or every fifth time through the while loop. The first step is to compute bpmstatic from the period of the two most recent beats. Once this is determined it is compared to the most recent valid heartrate calculation (stored as bpmstring(end)). If it is near enough to this value (heart rates do not change rapidly) then it is considered valid and is added to the bpmstring vector. The bpmstring vector contains all “valid” heart rate readings. If the new bpmstatic value is not close enough to the previous value then the last value in bpmstring is taken as the heart rate and re-added to the bpmstring vector. Finally, if the bpm reading is outside the range [30,180], it is tossed. Once a “valid” heart rate has been determined and added to the bpmstring vector, the outputted value for heart rate is calculated by averaging the last twenty values in bpmstring, the number of values used can be increased to give a more stable reading or decreased to give a more reading more responsive to heartrate changes. Finally, the heart rate reading is displayed on the GUI.
Once the heart rate has been determined, the program plots the updated versions of the ECG waveform, the Pan-Tompkins waveform, and the threshold waveform. The user can suppress this update by pressing the pause button and can resume real time display by pressing it again. The program then updates the current time (rounded to the nearest second) that the program has been running. The standard output can be seen below with no filter adjustments to improve signal quality:

The filter adjustments built into the GUI allow the user to customize the filter cutoffs to themselves. After adjusting the filters, the signal from the same person as above looks like this:
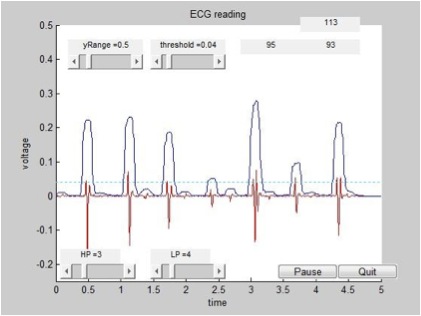
Finally, index is increased by the size of the sample so that timekeeping is consistent and there is a pause so that each loop takes exactly 100 ms (this value is determined by the variable realtime, which also determines the size of the sample).
The program will continue looping through this process until the user presses the Quit button, at which time the program exits the loop, closes all figures, and deletes the input device.
Hardware
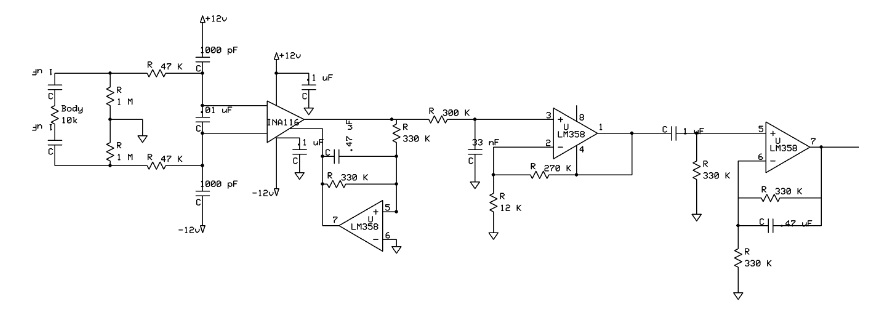
The hardware for this project was separated into several stages to ensure that retrieving the signal would be safe for the user and also ample amplification could be made to pull a readable ECG signal. The first stage was the conditioning stage which ensures user safety through DC-isolation by connecting the dry electrode signals directly to capacitors and resistors initially. The capacitors help with DC-isolation and provided a DC offset correction while the resistors limit the current passing through. This input conditioning stage is followed by some differential amplification to provide a stronger signal to analyze in Matlab.
Directly after DC isolation, we take the signal into a differential amplifier, the INA116, and with an RG value of 1 kOhm, we obtain an initial gain of 51. By using the INA116, we have a low bias current amplifier which is needed to allow for the high impedance signal source. From the differential amplifier, there is an additional feedback loop to help prevent the differential amplifier from saturating.
Following this step, the signal is put through a bandpass amplifier to test cutoff frequencies and to also pass the signal through additional filters. It is first put through a low pass filter with a gain stage and then following that a high pass filter. This bandpass amplification is used in order to meet certain specifications such as a system’s cutoff frequency and to also bring up the gain by a factor of 10. With these stages done, the signal is now strong enough to digitally analyze. The signal is then passed through to the NIDAQ to go through digital filters and data analysis.
What we tried that didn't work (software and hardware)
Initially, we referenced a different paper and tried to build a non contact EEG/ECG electrode system that could work based on using copper plates as capacitive. This method and conductor proved to be not as strong as we needed the signal to be and therefore more research was needed. We eventually found a different paper that required the INA116 and worked extremely well. The circuit of the new reference paper was much more straightforward and better described in its paper. In addition to this, we found new conductors that provided a much stronger signal. With both of these, the hardware issues were resolved and the conductance from the metal bars provided a large enough signal to be analyzed, processed, and filtered through the circuit's filtering and digital filtering.
Most of the software used was derived from a previous lab we had in this course. Therefore most of the issues that could have arisen such as filtering out the signal too much were already resolved previously. Therefore the software portion of this lab only needed some tweaking with the new input signal. The only issue that arose and proved to be very troublesome for the software was for different people, the signal strength varied a great deal and therefore at times, the filtering needed to be majorly modified. Essentially, different people required different filter cutoffs to get the best signal possible; because of this we couldn’t hardcode the filter cutoffs into the program. To overcome this, we implemented scrollbars in the GUI that allow the user to adjust the filter cutoffs as needed. Another issue we faced was inaccuracies in our heart rate measurements. Originally, missed beats would greatly affect our outputted heart rate. Our first attempt to combat this was to not miss beats, but we eventually realized there’s no way we could not miss any beats, so we developed a scheme to ignore missed beats. This ended up working extremely well.
Results
Execution
Our program executes in a loop which repeats every 100 ms. This gives a relatively seamless real time look to our display while leaving enough time to complete all our calculations. In addition, it is fast enough that responses to adjustments to values using the GUI can be almost instantaneously noticed.
Accuracy
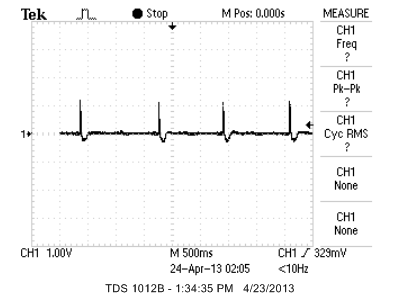
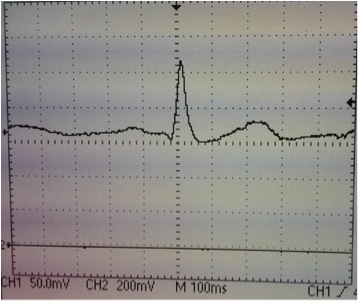
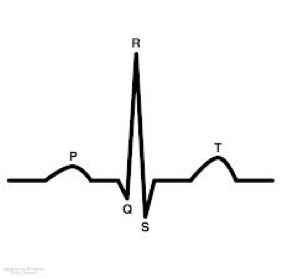
Since there is no ECG in lab, it was difficult to test how accurate the results are. However, when running the system, we would calculate our pulse from the oscilloscope readings to see if the readings from the Matlab program were close to what we expected. In the vast majority of cases they were, however the signal strength varied greatly between people, and some weak signals were difficult to get an accurate reading for. In general, it is hard to assure accuracy since the average person’s resting heart rate can vary by as much as 20 BPM between beats. In addition to accurately measuring a person’s heart rate, the hardware is able to get a relatively noise free QRS complex that contains P, Q, R, S, and T waves. Of the two pictures below, the first is a QRS complex averaged over a few beats using our hardware and the second is the accepted standard image of a QRS complex.
Other Issues or Interferences
There is no interference with other people’s designs for this project. The only interference that could occur is if the metal bars came in contact with another conductor attached to ground such as our metal plating that the circuit’s breadboard rests upon.
Safety
Our circuit in addition to executing well and being accurate is also very safe. In the beginning of our circuit, we have blocking capacitors as the initial stage. This first stage causes DC-isolation and also limits the current passing through. We calculated (see background math) that a person would need to contact a 1000 V AC power supply to even feel a sensation, a 10000 V AC power supply to feel pain, and a 100000 V AC power supply to be exposed to a lethal amount of current. To put this in perspective, long distance transmission of electricity through power lines is done at the scale of 100000 V. In addition, because of the capacitor between the body and ground negligible current will arise from connections to DC power supplies.
Usability
The ECG system is very user friendly. The two bars are light and easily fit in the hand. The system is robust enough that many hand orientations work for getting a signal (although some work better than others). The user is not required to grip the bars tightly.
Conclusions
Overall, this project met our expectations and we achieved what we hoped to achieve. By making a dry contact ECG and obtaining a strong enough signal, this project gave an accurate heart rate of a user in a safe and non-messy way. The simplicity of this device makes it very applicable for use and with the materials easily accessible, this device makes it easy to build for a cheap cost. Estimated cost of the hardware is $15.
Things that we may have done differently in this project, time permitting, would be to connect this to a battery source and incorporate a microcontroller with a small television so that it could be portable. Or another modification could be to improve the signal processing in Matlab to ensure even more accuracy and better time frames for retrieving the user’s data. We would have also liked to have packaged our system to make it more aesthetically pleasing and portable.
IEEE and Ethical Standards
We tried our best to adhere to all the IEEE standards and the IEEE Code of Ethics when designing this project. None of them create any constraints on our project.
By following the IEEE Code of Ethics to the best of our ability, this also solves ethical standards. However an obvious ethical standard that comes into play is the issue of privacy. Since we are measuring a user's heartrate, user privacy is an obvious issue. This is resolved since our device does not log any data and therefore discards information as it passes through our digital filter. The previous information is constantly being overwritten and therefore this resolves user’s privacy issues.
Appendix
Intellectual Property
The hardware for our project was directly used from the paper, "Design of a Gel-Less Two Electrode ECG Monitor" by Emile Richard and Adrian D.C. Chan. There were a few modifications made such as changing gain stage values and also a few stages that were mentioned in their paper that we ignored.
The initialization of our code was provided to us by Professor Bruce Land's lab 3 manual. Software modifications to this code template were developed by Sean Hubber and Crystal Lu.
Acknowledgements
We would like to acknowledge the paper writers of "Design of a Gel-less Two-Electrode ECG Monitor" which gave us a circuit template to build off of for our project. We would also like to thank our instructor, Bruce Land, for the support provided in this assignment and for the opportunity to design a product to expand our own personal interests. In addition to this, we would like to thank Evan McQuarrie for providing the chrome plated brass and our TA Akshay Dhawan.
Schematics
Circuit Schematic

References
- Design of a Gel-Less Two Electrode ECG Monitor
- INA116 Datasheet
- LMC258
- Vendor Site: Digikey
- The Fatal Current
- Heart rate variability in healthy subjects
- Poster
Parts List
Hardware required: INA116 (differential amplifier), two LM358 (op amps), several capacitors (one 0.47 uF, three 1 uF, two 1000 pF, one 33000 pF), two 4" chrome plated brass, and several resistor values. In addition to this, in order to send the signal to be digitally filtered, it was processed through a NIDAQ.
Separation of Tasks
- Hardware – Crystal Lu and Sean Hubber
- Software Initial Template (Submission for a previous lab) - Crystal Lu and Sean Hubber
- Software Modifications – Sean Hubber
- Web page – Crystal Lu
For the most part, as a team, we tried to incorporate one another in each aspect of the project so that each of us understood the product to its full capability when breaking it down into its subsystems. However, some portions of this project, one individual became a stronger expert overtime. For the most part since we tried to schedule times to meet in lab and outside of lab, both of us played a key part in designing all portions of the code.

