CAPACITIVELY COUPLED EMG ELECTRODES WITH FINGER GESTURE RECOGNITION
Parin Dedhia (prd47), Roland Krieger (rk447), Nini Munoz (nlm9)
INTRODUCTION
Following up on our work done in our third laboratory, we decided to implement a capacitive EMG (electromyograph) electrode for finger gesture recognition as our final project. Capacitive electrodes confer a series of advantages over conventional contact electrodes. First, capacitive electrodes do not require an ohmic connection to the body, which means that they require no preparation (gel etc), are insensitive to skin conditions and can be embedded in clothing etc. More importantly, capacitive electrodes don’t require the heavy isolation circuitry used for contact electrodes, as they are capacitive and non-contact, thus eliminating the risk of delivering high currents to the test study.
Electric events inside the human body cause potential differences on the skin. These differences can be measured with a surface electrode, which is in fact, nothing but an electrochemical transducer, converting the potential differences due to ion flows within the muscles into observable voltage differences. Muscles fibers are able to produce small electrical currents prior to the production of muscle force. These currents result from the exchange of ions across muscle fiber membranes and are inherently part of the cascade of signals that tell a muscle when to contract. These signals can be measured with conductive electrodes on the skin surface or invasively, within the muscle. Surface EMG is less non-invasive and thus more common, particularly in non-medical practice. [1]
Accurate EMG measurements are contingent on a variety of factors. The amplitude of the surface EMG signal has a range between a few microvolts to a few millivolts. The real time and frequency domain properties of these signals depend on the timing and intensity of contractions, the properties of the overlying tissue, the electrode and amplifier properties, the distance of the electrode from the active muscle area and the quality of the contact resistance between the electrode and the skin tissue [3].
HIGH LEVEL DESIGN/BACKGROUND
Traditionally, the silver-silver/chloride electrode has commonly been used in low-noise recording. It has a stable half-cell potential and is nonpolarizable. However, as with most biological signals, there are large amounts of excess noise present in recordings. While the exact origin of excess noise is rather unclear “ Localized out-of-equilibrium processes at the upper skin layers are suggested, as well as a residual EMG signal from nearby muscles. Abrading the skin lowers the excess noise. “ The noise level is also highly dependant on the type of electrode utilized. This indicates that there must be specific processes at the electrode-skin interface that contribute to the noise level. In addition, amplifiers, capacitive and inductive interference and motion artifacts also reduce the signal-to-noise ratio.
“ A capacitive electrode is a conductor coated with an insulating layer. When applied to the skin, the electrode is capacitively coupled to the skin, and its potential is therefore representative for the potential of the skin. The insulating layer has to be very thin, and is therefore vulnerable. In a truly capacitive electrode there is no conduction between metal and electrolyte. No half-cell potential will develop. The capacitive component of the electrode is noise-free. Therefore the capacitive electrode can be used for the study of electrode noise processes, as the interaction between electrode and electrolyte has been eliminated.” [1]
The contraction of muscle fibers takes place when action potentials are generated in the motor neuron that supplies them. When these AP reaching the NMJ exceed the threshold of depolarization in the postsynaptic membrane of the neuromuscular junction, it becomes a muscle action potential.Unlike nerve action potentials, the muscle action potential propagates in both directions of the muscle fiber(Fox & Keteyian, 2000) [2].
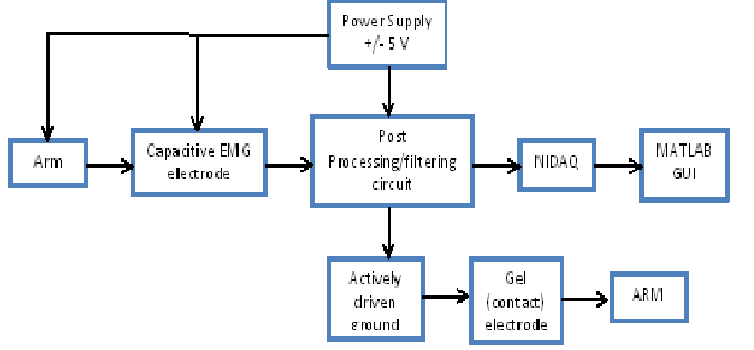
Logical Structure:
Following is the logical structure/flow process of the project:
Hardware/Software tradeoff:
1. The gain of the system was not high enough due to the susceptibility of the signal to noise. The peak amplitude of the signal was about 50 mV and the resolution of Nidaq was approximately 5 mV, thus having a tradeoff of good resolution.
2. We ruled out the option of printed circuit boards for the sensor and post filtering circuit due to its high cost. In turn, the sensor was soldered on a double sided copper clad and the post processing circuit on the solder board. Having got many wires across, leads to noise and decreasing the SNR of the whole system. The sensors and filtering circuit were not as robust too.
3. Our circuit was powered using standard benchmark power supply, which adds some more noise to the signal. A battery powered system would be more effective in terms of portabiliti]y and better signal to noise ratio.
4. Analog notch filter would help in getting a cleaner waveform on the oscilloscope too.
5. We were not able to differentiate between every signal as we worked with two electrodes. Having more electrodes would help in understanding signals better.
6. How many signals from each finger is used to build the neural network? It is good to use more signals to be able to capture variations but having too many signals leads to overlap in the signals of different fingers.
Standards:
There are no standards that we need to worry about in this project.
Intellectual property:
There are no patents or copyrights associated with this project.
HARDWARE DESIGN
The hardware design for this project can be divided into four major parts; sensor/electrode, amplifier-filter circuit and actively driven ground circuit.
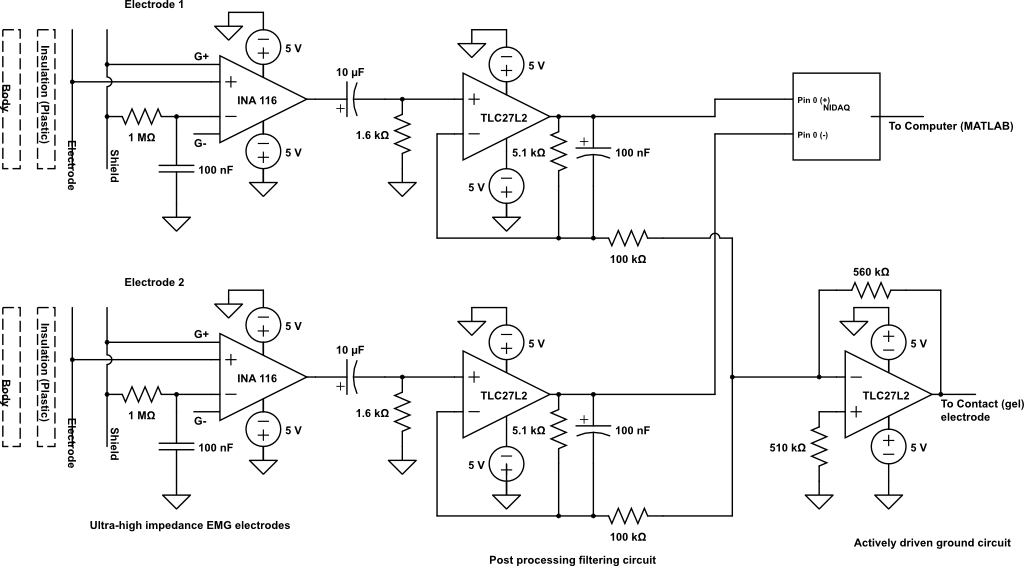
Figure 2: Hardware Schematic
1. Capacitive EMG electrode :
There are several design considerations to account for when designing and making capacitive electrodes. First, the insulating layer has to be strong enough mechanical ly,and resistant to electrostatic breakdown and corrosion due to perspiration. The relation between capacitance and thickness of the dielectric is given by C = eA/d, where e is the dielectric constant of the insulator, A is the area and d is the thickness. Given the size of our electrodes, roughly 1 square inch, and using a dielectric constant for plastic of ~ (2.5 x vacuum permittivity) and thickness of about 40-50 um, we found the capacitance to be roughly 274 pF. Taheri,et al.(1994) have used the following criterion for determining the electrode's desired impedance: "The skin impedance at 10 kHz is approximately 1 kΩ which results in a capacitance value of 15 nF. (...) The electrode capacitance should be at least two orders of magnitude smaller than 15 nF at 10 kHz to become the dominant frequency setting component in the system. Thus, values of electrode capacitance between 150-300 pF are adequate to dominate the frequency characteristics of the electrode". Given our calculated electrode capacitance, we were roughly in the correct range, even with variations in the dielectric constant of the plastic (it may vary from 1-3). To make our electrodes we used the INA116 high impedance amplifier in a deadbug configuration. The amplifier was glued onto a bilayer copper plate and soldered according to the device specifications on the data sheet. Guards were shorted (pins 2&4 and 5&7) and the positive input (pin 6)was connected to the electrode (bottom copper plate that comes in contact with dielectric) while the negative input was connected to the shield (top copper plate) through a 1 M-ohm resistor. Also, 0.1 uF coupling capacitors were used between the negative input and the reference pin, as well as between the positive and negative power supplies and the reference. The electrode leads to the post-processing circuits were soldered and the electrodes where insulated using small plastic bags. There was no gain on the capacitive electrodes (~1).
It is important to make note that for a given period during testing we kept getting a lot of noise while using pink-colored plastic bags as our insulating materials. It turns out these were actually not insulating but rather conductive. We thought a dielectric mismatch might have been leading to noise, but it turns out one of the bags was just conductive.
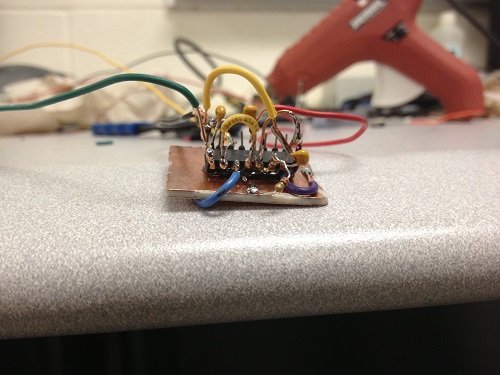
Figure 3: Capacitive EMG electrode
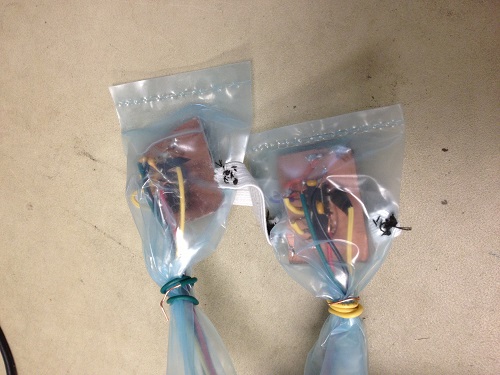
Figure 4: Capacitive EMG electrode with insulating plastic
2. Post Processing/filtering circuit :
The output of the two INA 116 instrumentation amplifiers goes to the post filtering circuit to smoothen and filter out the high frequency noise from the desired signal. As we have a capacitive electrode to sense the EMG, we do not have any DC signal with our desired EMG signal considering the fact that a capacitor does not allow DC signal to pass through. We have used TLC27L2 considering its easy availability, lower cost, high CMRR of 95 dB and very high input impedance of 10^12 Ohms. The pass band is set from 10 Hz to 300 Hz. The cut off frequency is set by the formula, Fc= 1/(2*pi*RC). High pass filter is made up by 10uF and 1.6 K Ohm setting up the cut off frequency of 10Hz, and the low pass filter is made up by 5.1 K Ohm and 100 nF setting up the cut off frequency of 312 Hz (approx 300 Hz). The gain is set up by the formula, Gain = 1+(Rf/R1). We are aware of the noise amplification by high gain, thus chose to have a gain close to unity. The filtered output of the two filters is given to the NIDAQ’s analog channel 0 as differential input. Signal from the inverting terminal is given as a common terminal to the inverting terminal of TLC27LC of actively driven ground circuit.
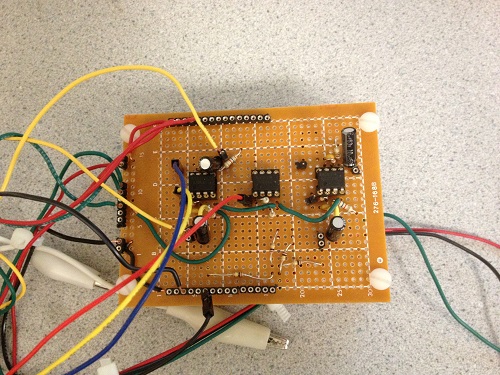
Figure 5: Post filtering circuit
3.Actively driven ground :
Subject grounding is one of the most important part of the circuit which helps in reducing the interference noise to a great extent. Actively driven ground has been used in our system design, wherein the common mode signal is taken from the inverting terminal of the filters and given to the inverting amplifier. The gain of the inverting amplifier is set by the formula, Gain = -Rf/R1. In our system, the gain of the inverting amplifier is approximately -6. Actively driven ground is widely used to eliminate the common mode interference signal, for example, the common 60Hz signal on both the signals of the differential signal. The output of the actively driven ground circuit is fed back to the body (in our case, arm) via a contact gel electrode [5], [6].
HARDWARE TESTING
1. Electrode testing :
The electrodes had to be tested on the subject. Some parts of the arm were rather insensitive to finger movements, while some picked up finger EMG’s from most fingers. It was also found through trial and error that the other differential electrode has to be placed at a minimal distance from the electrode on the muscle to get a relevant signal. We initially had thought about using two sets of differential capacitive electrodes, but found there was cross talk . It was outside of our budget to make the electrodes with PCB or wireless, so we ended up having rather clunky electrodes with long leads hooked up to the post processing circuit. When we tested them together we found that the signals were coupled, so ended up removing one of them. We also found an interesting effect. If the dielectric constant of the insulators varied there was substantial noise. We had to make sure all four electrode insulation layers matched. Also, our circuit required the use of a contact electrode to alleviate the noise. The best way of testing the electrodes to make sure they were functional was just to tap them and check for a signal.
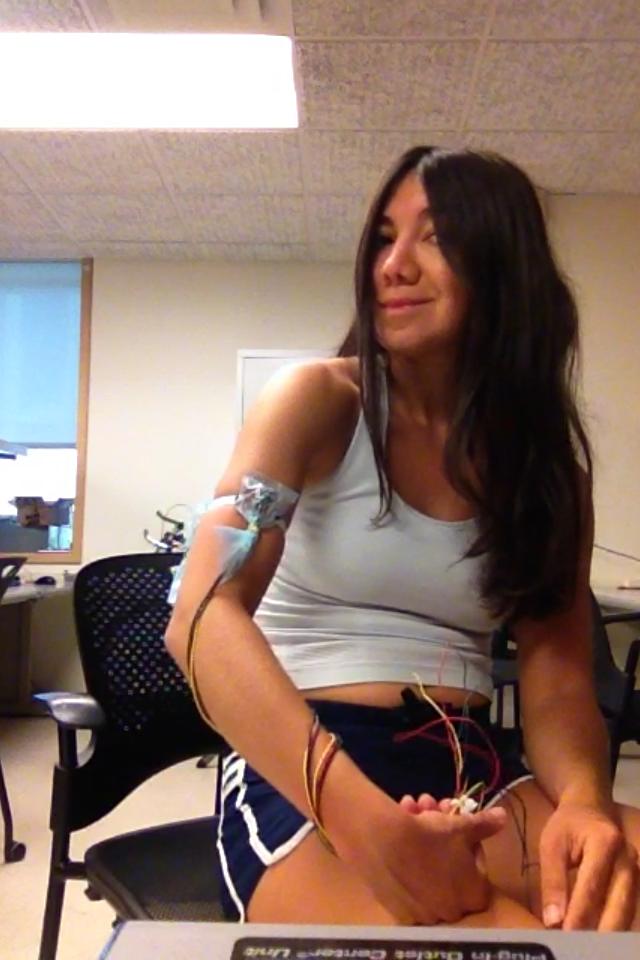
Figure 6: Capacitive EMG electrode placement and testing
2. Post Filtering circuit testing :
The filters of the post processing circuit were required to be tested. A sinusoidal signal of 20 mV was given from the function generator to the filter and the frequency was swept from 0 Hz to 1000 Hz. The amplitude started increasing from about 5 Hz and remained stable and constant until 200 Hz and started decreasing and completely attenuated at 600 Hz, showing the proper functioning of the analog filter. 60 Hz signal could be seen superimposed on the desired signal, but we chose not to have an analog notch filter, and chose to filter out the 60 Hz using digital filter. We did not connect the actively driven ground yet. Reading a few research papers on non contact electrodes, we realized the importance of an actively driven ground [5],[6]. Thus, we connected all the inverting terminals from the filters of all electrodes to an inverting amplifier. The inverting amplifier inverts the signal and feeds back to the body via gel contact electrode. The negative feedback drives the common mode voltage to a low voltage. Having connected the actively driven ground, we saw a significant reduction in the noise level. After testing on the breadboard, we chose to move on to the solder board, being the cheapest option if compared to the printed circuit boards.
To significantly be able to differentiate the signals from every finger, we chose to have multiple EMG electrodes. As the biopotential signals are best understood as differential signal, we chose to give the Nidaq differential input. Initially, we made one common negative input to the Nidaq, and had 3 positive input. This configuration was not suitable as we found two signals tracking each other. So, we chose to have two differential negative inputs with their two respective positive inputs. We had to compromise on the number of signals, as now we just had 2 signals as compared to 3 initially. We could get decent signals on the MATLAB GUI now, with two signals significantly changing with every finger moving. We encountered an unexpected issue with this configuration. Even if one electrode was disconnected from the arm, tapping it would significantly change the output of the other connected electrode. It meant all the four electrodes were coupled to it each other, and any movement of one would show a change in the output of the other. The reason of such coupling was not very clear, but one of the reason was the long wires connecting all across the circuit from sensors to the board, and to the Nidaq. We eventually chose to work with single differential signal, i.e. with two electrodes only being one positive and second negative.
SOFTWARE DESIGN
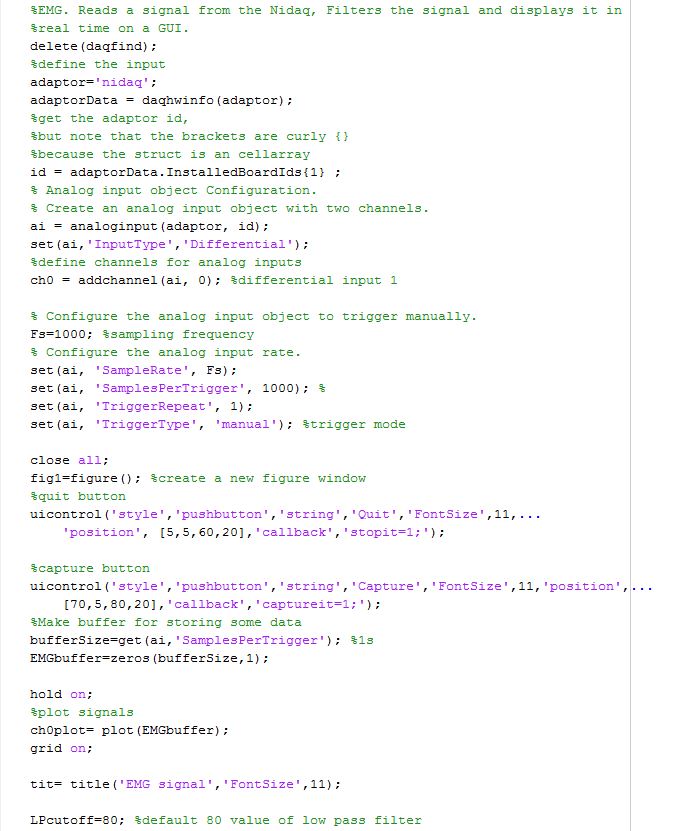
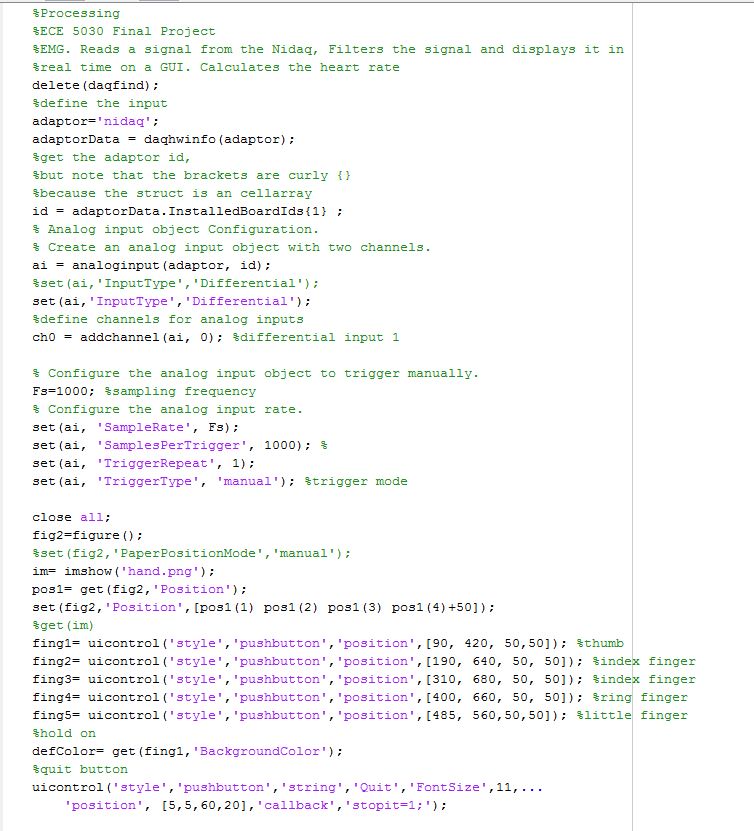
There are two MATLAB programs. The first program (signals.m) basically displays the EMG on a GUI. The second program displays a hand on a GUI which can be controlled by different finger motions. Both programs are similar in the setup of the Nidaq. Each program starts by setting up the nidaq for data acquisition. The command delete(daqfind) is used to remove any existing device objects in the workspace. Then, ‘nidaq’ is defined as the input, and an analog input object is created and assigned one channel input. The analog input is then configured to trigger manually, with the sampling frequency set to 1000 samples per second and samples per trigger set to 1000. The input type is also set to differential mode:
delete(daqfind);
adaptor='nidaq';
adaptorData = daqhwinfo(adaptor);
id = adaptorData.InstalledBoardIds{1} ;
ai = analoginput(adaptor, id);
set(ai,'InputType','Differential');
ch0 = addchannel(ai, 0); %differential input 1
Fs=1000; %sampling frequency
set(ai, 'SampleRate', Fs);
set(ai, 'SamplesPerTrigger', 1000);
set(ai, 'TriggerRepeat', 1);
set(ai, 'TriggerType', 'manual'); %trigger mode
In Signals.m, after setting up the Nidaq, the GUI is designed. A quit button was added to exit the program, and a capture button was added to be used to acquire data for each finger motion to train a neural network. A notch filter was designed using the signal processing toolbox:
function Hd = notch
Fs = 1000; % Sampling Frequency
N = 20; % Order
Fc1 = 55; % First Cutoff Frequency
Fc2 = 65; % Second Cutoff Frequency
% Construct an FDESIGN object and call its BUTTER method.
h = fdesign.bandstop('N,F3dB1,F3dB2', N, Fc1, Fc2, Fs);
Hd = design(h, 'butter');
end
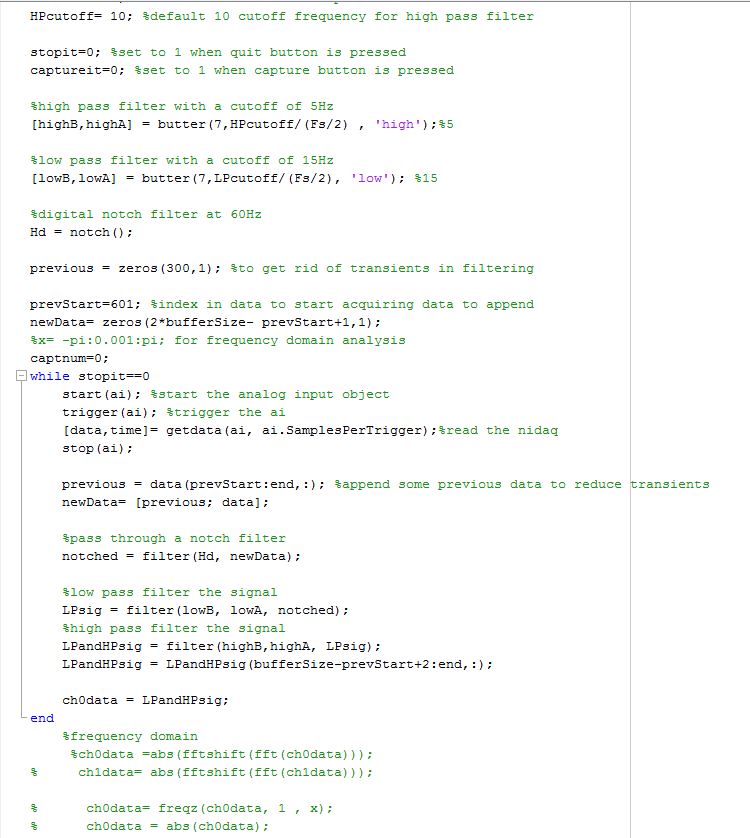
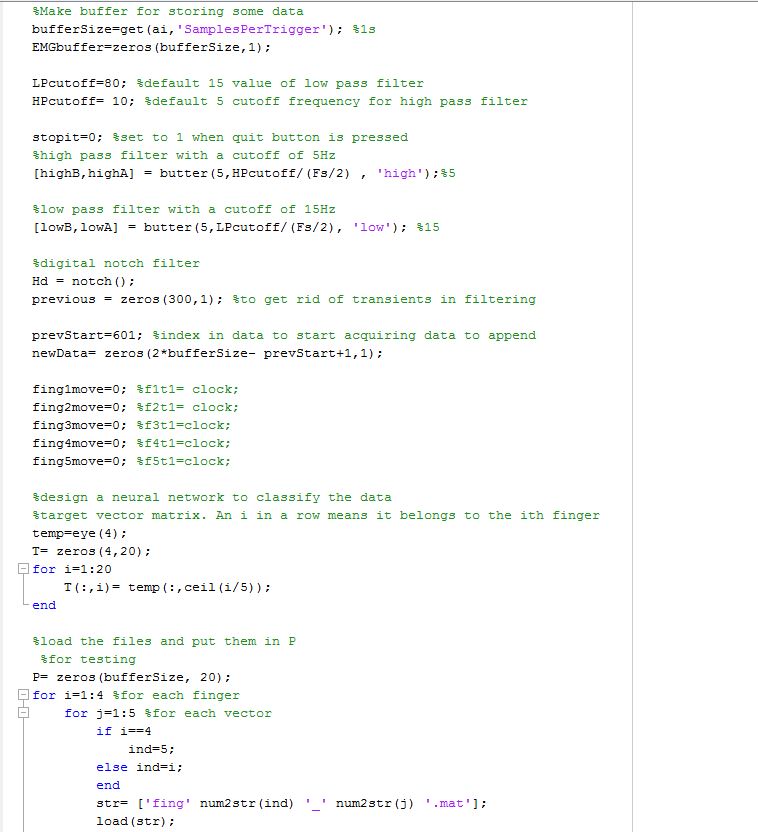
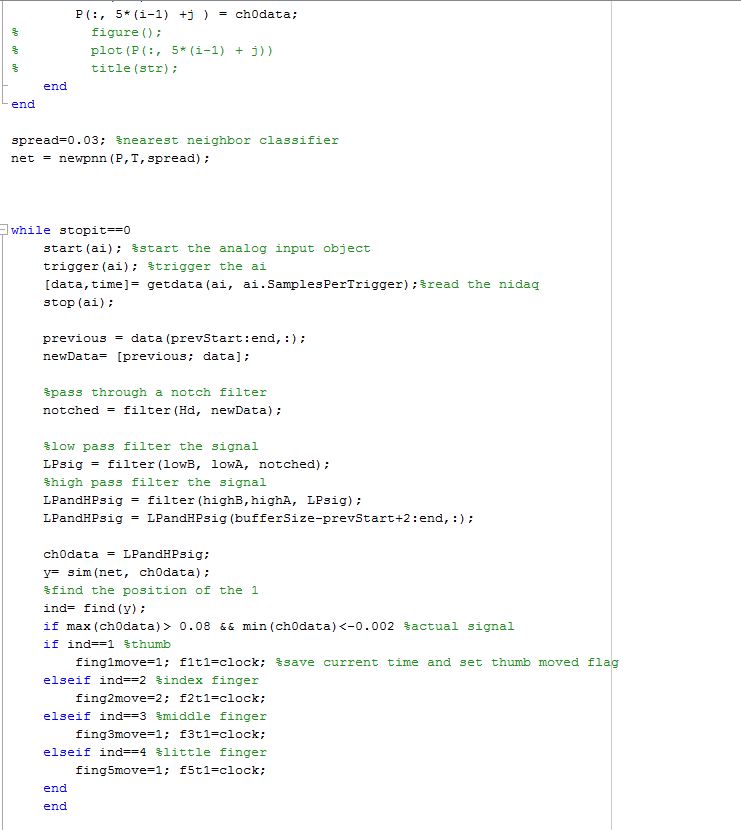
This was done by designing a 20-order bandstop filter with stopband from 55 Hz to 65 Hz. Next a low pass butterworth filter with order 7 was designed. The cutoff frequency was set to 80 Hz. It could be as high as 300 Hz but we decided to limit the frequency to 80 Hz because there was some high frequency noise observed in the testing we decided would corrupt the classification. A high pass filter was designed with cutoff frequency of 10 Hz. The program keeps running until the quit button is hit. The program keeps reading the data from the Nidaq at a sampling frequency of 1000 Hz. The data is read using the following code:
start(ai); %start the analog input object
trigger(ai); %trigger the ai
[data,time]= getdata(ai, ai.SamplesPerTrigger);%read the nidaq
stop(ai);
The last 400 ms of the previous 1 second buffer is appended to the current buffer before filtering in order to get rid of transients and make the display more fluid. The data is first passed through a notch filter to get rid of the 60 Hz noise. Then it is passed through a low pass filter and high pass filter to restrict the signal to the EMG range that we want (10-80 Hz). Next the data is displayed on the GUI by setting the xdata and ydata of the current plot: “set(ch0plot,'xdata',time,'ydata', ch0data);”. The ‘drawnow’ command is used to ensure that the plot happens immediately so it looks real time. The program keeps running until the quit button is hit.
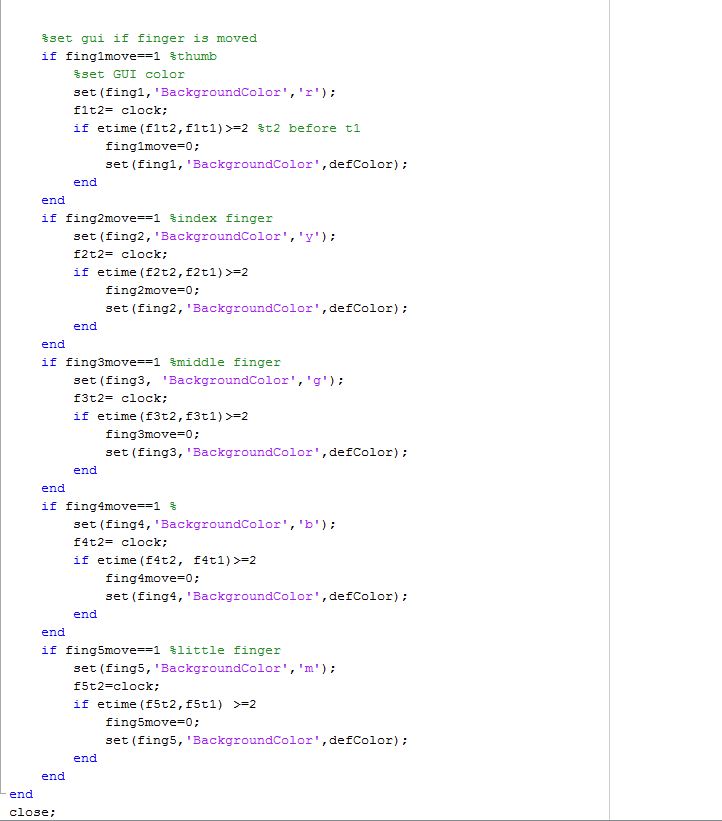
In ‘Processing.m’, the data is processed the same way as in ‘Signals.m’ except this time, we try to classify the signals and match it to a particular finger. The GUI in this case is a picture of a right hand with five pushbuttons which change color depending on which finger is perceived to have moved. The hand is displayed on the GUI by using the ‘imshow’ function on the hand.png picture which is in the same folder as the program. The window is then resized, and the pushbuttons are added. The classification is done using a probabilistic neural network (pnn) designed in Matlab. According to the Matlab help page, the pnn is a kind of radial basis network which has two layers. The first layer has biases which are set by the function ‘0.8326/spread’. We experimented with different values of the spread but none of them worked. The pnn requires a training set data which are the files that were recorded for each finger. There were five signals for each finger except the ring finger. We didn’t record signals for the ring finger because it was extremely difficult to move it without moving other fingers. Thus there were 20 training set vectors which form the 20 columns of the training matrix. A 4x20 target matrix is created. Each column is a particular column of the 4x4 identity matrix. Each column also corresponds to a particular column in the training set matrix. Each column has a 1 in the row which corresponds to the finger the training set vector corresponds to (1st row- thumb, 2nd row- index finger, 3rd row- middle finger, 4th row- little finger). The neural network is created using the code: “net = newpnn(P,T,spread);” where P is the training set matrix, T is the target matrix and ‘spread’ is the spread as described above. When each signal is sampled and processed, it is then passed through this neural network using the code: “y= sim(net, ch0data);”. The result is a vector with a 1 in the row the signal was classified as belonging to and a 0 elsewhere. The program checks to see if the signal in the buffer could be a real signal (its maximum should be greater than 8 mV and its minimum less than -2mV. If so, a flag is set depending on which finger was deduced to have been moved. The pushbutton above that finger changes color for two seconds. This program keeps running until the quit button is hit to exit.
SOFTWARE TESTING
For software testing, we plotted the signal in frequency domain with no hand motion to see which frequency bands the noise came from. As expected, there was a significant 60 Hz component. What was surprising is that, there was a lot of noise around 80 Hz, 200 Hz and 320 Hz. We weren’t sure where these noise signals came from but what was interesting was that each frequency from 80 Hz differed from the next by about 120 Hz. We designed notch filters to get rid of these frequencies. The 60 Hz noise was sufficiently attenuated. However, the other frequencies kept changing location (even though they differed by 120 Hz). After changing the bandwidth of the stop band for different notch filters, and not being able to get rid of these noise signals, we decided to limit the EMG signal to a band from 10-80 Hz. The high pass cutoff was set to 10 Hz to limit the interference that could arise from ECG signals. The next test that was performed was the GUI that displays the hand. A test was made to make sure that the push buttons change color when a finger move is detected and that the right push button changes color. The next tests that were performed have to do with the process of obtaining signals for training the neural network. A program was written to obtain five training set signals for each finger apart from the ring finger of the test subject. The program detected when the signal crossed a certain threshold after the ‘capture’ button on the GUI had been pressed. The final test that was performed was changing the bias of the second layer of the probabilistic neural network designed in MATLAB. This was done by changing the ‘spread’ argument in the call “net = newpnn(P,T,spread);” This function is explained more in the documentation section.
RESULTS
We were successful in getting noise free EMG for every finger. We could see the change in amplitude significantly with the application of force on the complete arm. We saw consistency in the output of EMG for thumb and the little finger (pinky).
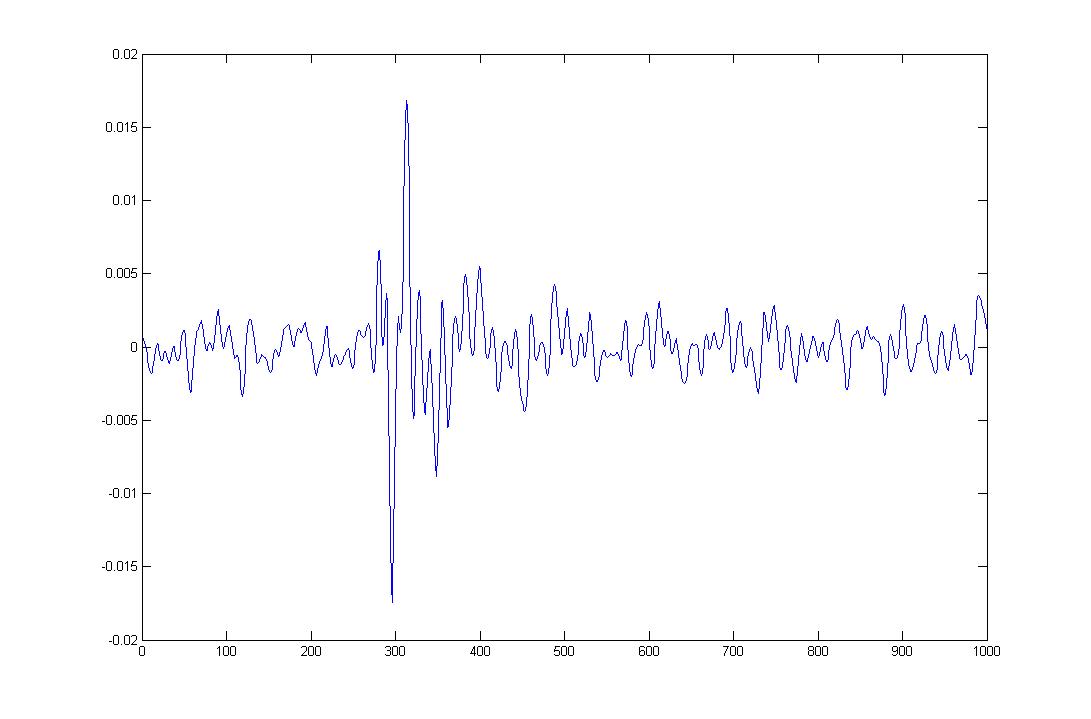
Figure 7: EMG signal from the little finger (pinky)
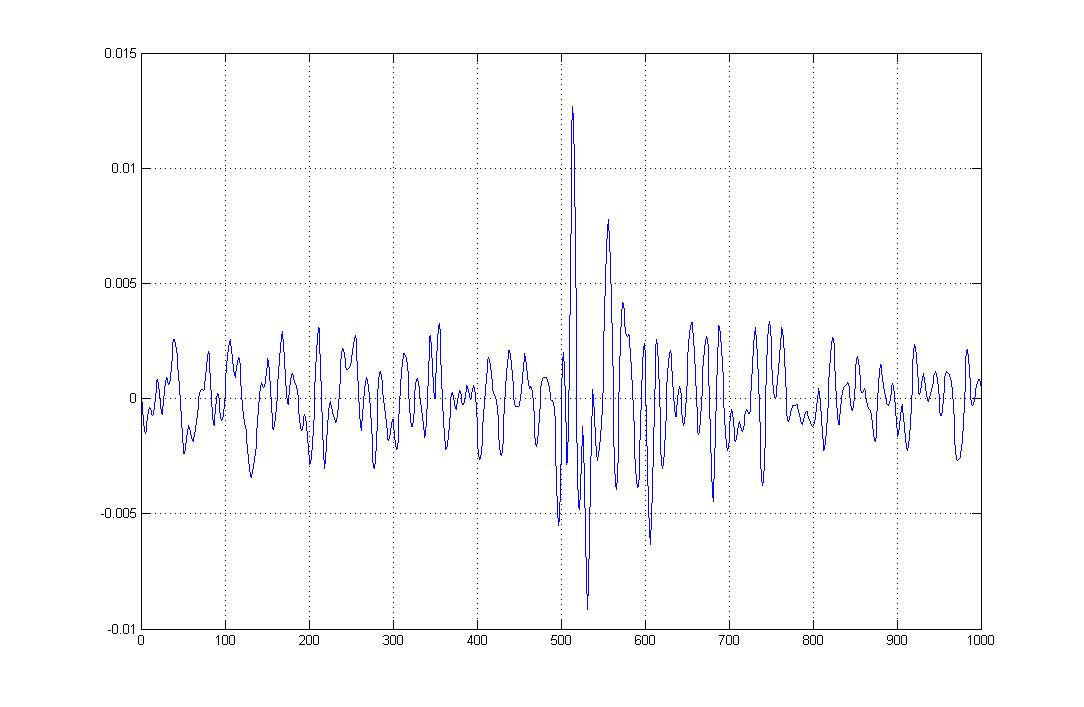
Figure 8: EMG signal from the little finger (pinky)
In Figure 7 and 8, we can see the change in amplitude, i.e. the rise in amplitude or spike, is the response to the movement of the little finger.
A picture of the GUI in normal operation is shown below: The algorithm for detecting which finger moved didn’t work so well. A picture of the GUI is shown below:
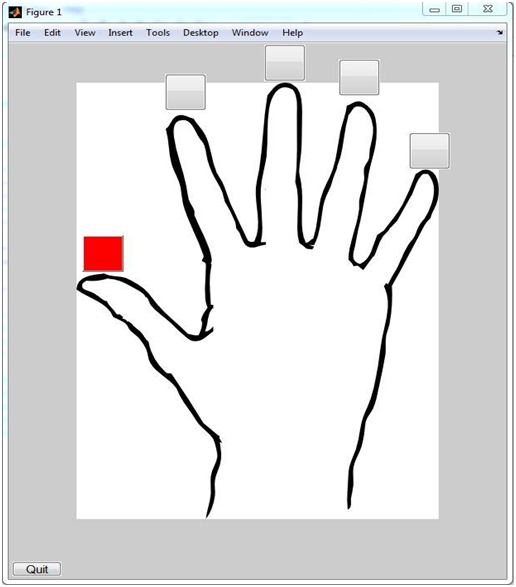
Figure 9: MATLAB GUI
CONCLUSION
We were able to get very good EMG signals for every finger. The amplitude changed significantly with every movement of the finger. As we worked with only two electrodes as one differential channel, we were not able to differentiate between every finger effectively. We were not very successful with the neural network due to lack of multiple electrode. Overall, the EMG waveform was noise free and with more electrodes, we would surely be able to differentiate between every finger.
IEEE CODE OF ETHICS
We accept responsibility in making decisions consistent with the safety, health, and welfare of the public, and to disclose promptly factors that might endanger the public or the environment by performing experiments safely, and when in doubt consult the TA or Prof. Bruce. As my device is low powered, there are no issues pertaining to experimenting with high voltage. We had no real or perceived conflicts of interest and worked in harmony. We have been honest and realistic in stating claims or estimate based on available data, and have shown results as per the experimentation. We am not involved in bribery in all its forms. Over past couple of weeks, We have been constantly trying to improve the understanding of technology; it's appropriate application, and potential consequences by studying various research papers, asking for TA or Prof. Bruce for help and other fellow students. We readily seeked criticism from the TA or Prof. Bruce for any technical incompetence and worked over it to rectify error and mistakes. We was un biased with respect to race, religion, gender, disability, age, or national origin. I did not cause any injury to a person, or loss to the property or employment by false or malicious action.
APPENDIX A: Code
APPENDIX B: Schematic can be found in the hardware section
APPENDIX C: Parts List
| Part | Cost ($) |
| INA 116 (*2) | $10 each |
| Solder Board (*2) | Free (From the lab) |
| Double sided copper clad | $5 |
| TLC27L2 (*3) | Free (From the lab) |
| NIDAQ | Free (From the lab) |
| Wires (Connectors) | Free (From Lab) |
| Resistors and Capacitors | Free (From Lab) |
| Total | $25 |
APPENDIX D: Division of Labour
Parin Dedhia - Hardware circuit designing, web page
Nini Munoz - Sensor circuit designing
Roland Krieger - Software programming for MATLAB
Appendix E: References
We are really thankful to Prof. Bruce Land and Akshay Dhawan (Our TA) for their help for the final design project.
Datasheet:
1. INA 116: http://www.ti.com/lit/ds/symlink/ina116.pdf
2. TLC27L2: http://www.ti.com/lit/ds/symlink/tlc27l2m.pdf
Vendors:
1. Texas Instruments: http://www.ti.com/
Online references:
1. E. Huigen, Noise in biopotential recording using surface electrodes. University of Amsterdam Section Medical Physics.
2. Heloyse Uliam Kuriki, Fabio Micolis de Azevedo, Luciana Sanae Ota Takahashi, Emanuelle Moraes Mello, Ruben de Faria Negra, Filho and Neri Alves (2012). The Relationship Between Electromyography and Muscle Force, EMG Methods for Evaluating Muscle and Nerve Function, Mr. Mark Schwartz (Ed.), ISBN: 978-953-307-793-2, InTech, Available from:http://www.intechopen.com/books/emg-methods-for-evaluating-muscle-and-nerve-function/the-relationship-between-electromyography-and-muscle-force
3. Day, Scott, “Important Factors in Surface EMG Measurement, Bortec biomedical http://www.bortec.ca/Images/pdf/EMG%20measurement%20and%20recording.pdf.
4. Ferris, C.D. (1972). Introduction to bioelectrodes. Plenum Press, New York.
5. Taheri, B.A., Knight, R.T. and Smith, R.L. (1994). A dry electrode for EEG recording. Electroenceph. Clin. Neurophysiol., 90, 376-383.
6. Yu M. Chi and Gert Cauwenberghs, Wireless Non-contact EEG/ECG Electrodes for Body Sensor Networks. University of California, San Diego: http://www.isn.ucsd.edu/pubs/bsn10.pdf
7. Gert Cauwenberghs et al., Wireless Non-contact Cardiac and Neural Monitoring. University of California, San Diego: http://www.isn.ucsd.edu/pubs/wh2010.pdf.