 Observation
of Alpha Waves using EEG
Observation
of Alpha Waves using EEG
& EYE BLINKING COntrol INTERFACE
ECE 5030 – Electronic bioinstrumentation final project
Abdurrahman Gumus (ag598) & Syed Ahmed Nadeem (sn487)
Demonstration Video: https://www.youtube.com/watch?v=T5vJ7f3Dwp0
Introduction top
In this project, we designed and implemented
hardware and software to observe Alpha waves from the brain using EEG and
created an interface using eye blinking.
We wanted to be able to harvest the capability of the brain by observing its signals for different conditions using Electroencephalography (EEG). EEG is the recording of electrical activity along the scalp. EEG measures voltage fluctuations resulting from ionic current flows within the neurons of the brain. The following figure shows different brain wave frequencies and when they are each dominant.
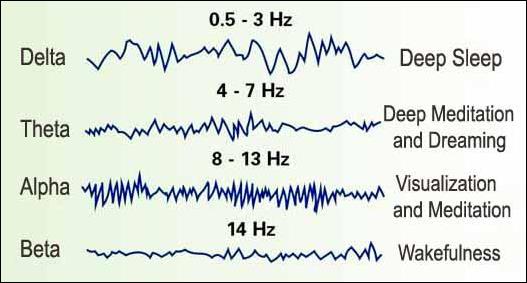
Figure 1: Different brain wave frequencies
(get-rich-mp3-download.com/sound.html)
The signals of interest in this project are the Alpha waves. Magnitude of the alpha waves decreases when people get excited and increase when people are relaxed. Our hypothesis was if we could alter the mental state of the user between the two states of excitement and relaxation, we could use EEG to detect the changes in the Alpha waves.
As a secondary objective, we wanted to use the motion artifact created when blinking to control something i.e. develop an interface using the blinking. This can have future applications in device control. For example, using each eye blink (left or right) we could turn something left or right by winking.
Design and Testing Methods top
Issues top of section
There were two main issues that would have to be addressed in the hardware design of the project: Safety and the effect of 60 Hz noise.
Safety: In any circuitry that is attached to the body, it is a necessity to isolate the body from the 110 V grid. The hardware design will have to isolate the parts of the circuitry connected to electrodes from the 110 V grid. This means that on the isolated side of the circuit oscilloscopes and signal generators that are connected to the 110 V grid can’t be used.
60 Hz Noise: Since the EEG signal would be in the order of microvolts, a pertinent issue would be removing the noise. In order to do this we used both analog and digital filters in the design.
Hardware top of section
Initial design:
This implementation used an IL300 optocoupler and a DCP010515B isolated power supply in order to provide the isolation from the main power line. The problem with this hardware implementation is the amount of tweaking needed in order to get the optocoupler working which was very time consuming and not robust. We initially tested the optocouplers using sine waves, and had to tune the optocoupler using 10K trimmers to set the DC offsets and the gain before the optocoupler. Since it was required to recalibrate the hardware for the electrodes, it was decided to abandon the approach due its overall complexity and use another one.
We also tried to implement a 60 Hz notch filter in hardware, which was difficult due to imprecise values of components.

Figure 2: Initial high level design
Final design:
In order to avoid the complexity of dealing with optocouplers and isolated power supplies, it was decided to power the whole system using 9V DC batteries. The NI-6008 DAQ interface to act as an oscilloscope to test the system. The following figure shows a high level design for the hardware:

Figure 3: Final design of the circuitry.
electrode placement:
In order to ensure the best signal, gold plated electrodes were used with conductive gel placed on the skin or regions with hair parted to ensure best contact. Normally, EEG uses caps with a large amount of electrodes designed to be placed at specific areas of the user’s head as can be seen below.

Figure 4: EEG
Electrode nomenclature in the 10-20 placement system. [http://www.bem.fi/book/13/13.htm]

Figure 5: Electrodes used to detect alpha waves.
The Texas Instruments’ INA121 was used for differential amplifier circuit. This was because in the following reference (http://www.instructables.com/id/DIY-EEG-and-ECG-Circuit) the Common Mode Rejection Ratio of the amplifier was stressed, so the INA121 was chosen since it has a similar CMRR to the amplifier used there. “The Common Mode Rejection Ratio (CMRR) is a value given to the amplifier that corresponds to how well it ignores the common offset between inputs. A higher CMRR is better, and will output something closer to what a perfect amplifier would.”
We used the design specified in the ECE 5030 website (Fig 3). There are passive low pass filter at the inputs of the INA121. At the end, there is a passive high pass filter and amplifying stage. The overall gain for the differential amp was set using RG, we initially started with 560 Ω (gain = 90.3), but the signal saturated at that value so we reduced the gain to 51 using RG = 1 kΩ.
We also added 0.1 µF capacitors between the +Vcc and GND and -Vcc and GND.

Figure 6: Differential amplifier circuit (from
datasheet).
Filter blocks and amplifying stages:
Before the NIDAQ, we added some gain stages and filters as are shown in figure 5 and the table below. The values for cutoffs chosen were in line with the frequency band of the signals that were of interest (8-14 Hz):
|
Order |
Filter |
Cutoff |
|
1 |
LPF |
37Hz |
|
2 |
HPF |
6Hz |
|
3 |
HPF |
1 Hz |
The overall gain of the analog part of the circuit was 50 (from Differential Amplifier) x 25 (from first gain stage) = 1250.

Figure 7: Whole
circuit schematic for one electrode read-out.

Figure 8: Final circuit design for capacity of up to 8
electrodes.
Software top of section
Signal Preprocessing

Figure 9: Flowchart of signal pre-processing in
software.
The first stage was to use a 60 Hz notch filter to remove 60 Hz noise, which from background reading is a prevalent issue in EEG. The next stage was to use a band pass filter to isolate our frequency range of interest (7 to 14 Hz). This is result of this referred to as the Preprocessed Signal after this.
1. Observing changes in Alpha waves:
In order to observe changes in Alpha waves which increase in amplitude when a person is relaxed and decrease when excited, we used the following methods to process the signal after the hardware stage.

Figure 10: Flowchart of the software procedure to
observe the changes in the Alpha waves
Signal Processing
As our goal was to observe changes in the alpha wave amplitude, we decided to first find the maximum peak in the alpha wave range (7 to 14 Hz) and then calculate the RMS value of the entire Fourier spectrum. We then used the ratio of the two to observe the value of Alpha Amplitude.
Since this value was fluctuated a lot, we then down sampled the ratios (1:100) and plot the mean of the 100 samples instead to view the trend.
2. Blink Detection
The goal of this was to detect a series of three blinks to turn on and after a set time a series of three blinks to turn off a radio button. The procedure carried out in software is shown in the following diagram:

Figure 11: Flowchart of Blink Detection
I. Filtering
The preprocessing is the same as the preprocessing when observing changes in the Alpha waves: 60 Hz notch, followed by a 15 Hz LPF and followed by a 4 Hz HPF (aided with the detection of blink artifact)
II. Signal Processing
From the nature of the signal, we had the blinking artifact had a larger amplitude and gradient than the normal EEG signal when the user is idle. So in order to isolate the waveform produced a modified version of the Pan-Tompkins algorithm was used. First, the first derivative of the signal was calculated and then squared. The result was then thresholded in order to detect the occurrences of the peaks (which was manually set using a slider).

Figure 12: Eye blinking artifact
III. Peak Detection Criteria
Once the peaks of the blinking artifacts were isolated, logical conditions were applied to detect the required signal sequence i.e. three blinks, on, wait, three blinks, off. The basic outline of the peak detection criteria is shown below.

Figure 13: Peak Detection Criteria
The first step is to detect the initial peak in the binary signal, we then detected the second peak after an offset from the initial peak point. The next step is to detect the third peak, after an offset from the second peak. If all the three peaks are within a fixed number of samples (tested with 200) the radio button is switched on. Once the radio button is switch on, we wait a fixed duration after which another three blinks can turn it off.
Notes:
I. The sampling rate used for observation of Alpha waves was 140 Hz, and for Eye blinking interface it was 200 Hz.
II. GUI Design


Figure 14: GUI design for Observing trends in Alpha
waves and for carrying out Blink Detection
Where, the “Valid?” button turns ON or OFF when it receives the three blinks. The two sliders are used to control the axis scale and the threshold respectively.
Results top
Alpha Wave Stimulation Experiments Eye Blinking Detection Experiments
Alpha wave stimulation experiments top of section
The experiment for observing a change in alpha waves was to have the user in two states, excited and relaxed. The excited state was achieved by the user focusing on watching a video intently which he hasn’t seen before, while the relaxed state was achieved by shutting off the video, closing the eyes and breathing heavily. In the first experiment, user was initially watching the video then, relaxing then watching it again. The value recorded was the mean over 100 samples of the ratio of the peak amplitude in the Alpha band of the Fourier Spectrum to the RMS value of the entire Fourier spectrum. The following are the statistics of the experiment:
Table 1
Statistics for Experiment observing changes in Alpha waves.
|
Phase |
Mean |
Standard Deviation |
|
Watching
I |
1.7424 |
0.3414 |
|
Relaxing |
2.0410 |
0.4669 |
|
Watching
II |
1.9629 |
0.4591 |

Figure 15: Result of Observing changes in Alpha waves
The second experiment’s results are shown in Table 2:
Table 2
Statistics for Experiment observing changes in Alpha waves.
|
Phase |
Mean |
Standard
Deviation |
|
Watching I |
1.0435 |
0.1224 |
|
Relaxing |
1.4219 |
0.1988 |

Figure 16: Result of Observing changes in Alpha waves

Figure 17: Stimulating the brain waves by watching
exciting stuff.
Eye blinking Detection experiments top of section
The goal of these experiments was to detect a series (of three) eye blinks to turn on, and then after a certain adjustable period, a series of three blinks to turn off the state of the button. The results can be seen below.

Figure 18: Enabling a button with eye blinking.

Figure 19:
Disabling the button with consecutive eye blinking.
Conclusions top
In this project, alpha wave changes of the brain were successfully detected using EEG electrodes. The system developed consisted of gold plated electrodes, read-out circuitry, NI DAQ interface to transfer the electrode data to computer and MATLAB for further analysis. The hardware used 3 electrodes which could potentially extended by increasing the number of electrodes. It was observed that the amplitude of alpha waves decreases when the user is excited and increases when relaxed. As a secondary usage, a series of eye blinking motion artifacts were used to control a radio button state. This could be extended to allow control of devices using eye blinking. For example, turn left or right by blinking each eye.
Although the implementation was successful, there were a number of problems and issues that had to be addressed during the testing of the project. Firstly, the project was implemented on a white board and due to the quality of the connections in the white board, ringing artifacts would be induced due to the capacitance of the board. A possible solution would be to implement the circuit on PCB as it is more robust and easier to replicate hardware. The ringing caused problems in detecting eye blinking artifacts and the detection of alpha waves. Another issue which required a lot of work is electrode placement. In order to ensure the best signal, gold plated electrodes were used with conductive gel placed on the skin or regions with hair parted to ensure best contact. Normally, EEG uses caps with a large amount of electrodes designed to be placed at specific areas of the user’s head as can be seen below.
Appendix top
Program Listing Schematics Distribution of Work References
Program Listing TOP of section
Schematics TOP of section

Distribution of Work TOP of section
|
Task |
Ahmed |
Abdurrahman |
|
Hardware Design |
ü |
ü |
|
Software Design |
ü |
ü |
|
Web Page |
ü |
ü |
|
Documentation |
ü |
ü |
|
Debugging (SW + HW) |
ü |
ü |
References TOP of section
Parts List Datasheets Vendor Sites Code Designs Background Work
|
Parts |
Cost |
|
Instrumentation
amplifiers: (INA121 x 8) * |
$ 6.48 each |
|
Operational
amplifiers: (LM358 x 8) * |
$ 0.49 each |
|
National
Instruments - DAQ * |
$ 189 |
|
EEG
Electrodes |
$ 100 (10 of them) |
|
EEG
Conductive gel (NuPrep) |
$ 25.95 |
|
EEG
Conductive paste (Ten20) |
$ 27.54 |
|
9V DC
Batteries (Duracell) |
$ 10 |
|
Resistors,
capacitors and wires * |
- |
* provided by the Lab
Texas Instruments INA121
http://www.ti.com/lit/ds/symlink/ina121.pdf
Texas Instruments LM358
http://www.ti.com/lit/ds/symlink/lm158-n.pdf
Conductive Paste
http://www.amazon.com/Weaver-Ten20-Conductive-Paste-Pack/dp/B002R1TJ20/ref=sr_1_1?ie=UTF8&qid=1400007638&sr=8-1&keywords=ten20+conductive+paste
The RMS function used in our code was from:
http://www.mathworks.com/matlabcentral/fileexchange/24039-rms-m
EEG Circuit design:
http://www.instructables.com/id/DIY-EEG-and-ECG-Circuit/
Pan-Tompkins Algorithm
http://people.ece.cornell.edu/land/courses/ece5030/labs/s2014/Pan_Tompkins.pdf
EEG Electrode Placement
http://www.bem.fi/book/13/13.htm
Brain Wave Frequency Diagram
http://www.get-rich-mp3-download.com/sound.html