Cornell University
ECE 5030
Matlab Graphical User Interface Design
Introduction
Once you have written a program to perform some data-related function
you may find that other people want to use it. It is useful to wrap a GUI around
the function so that other people (and yourself) can remember how to use the
program. MatLab supplies a set of tools for building GUI elements including:
- Control widgets
- Buttons
-
 A
pushbutton is typically used when you want an immediate action to
occur when the user presses the button. An example might be a button
to quit the application.
A
pushbutton is typically used when you want an immediate action to
occur when the user presses the button. An example might be a button
to quit the application.
 A checkbox is used when you need to specify a persistent binary condition.
An example might be to turn on/off the grid associated with the axes
of a plot.
A checkbox is used when you need to specify a persistent binary condition.
An example might be to turn on/off the grid associated with the axes
of a plot.
 A
radio button is typically used when you need to group several buttons
together so that the group of buttons have mutually exclusive settings.
An example might be a choice among several colors of a plot.
A
radio button is typically used when you need to group several buttons
together so that the group of buttons have mutually exclusive settings.
An example might be a choice among several colors of a plot.
- Text areas
 Editable
text may be modified by the user by clicking the field and typing.
An editable text field seems to be limited to one line. You could
use an editable field to allow the user to enter a function to be
plotted.
Editable
text may be modified by the user by clicking the field and typing.
An editable text field seems to be limited to one line. You could
use an editable field to allow the user to enter a function to be
plotted.
 Noneditable
text may be changed by the program, but not directly by the user.
You might use this for labels or instructions to the user.
Noneditable
text may be changed by the program, but not directly by the user.
You might use this for labels or instructions to the user.
 A
slider is used to set a numerical value in a definedrange. Clicking in
the body of the slider moves the slider about 10% by default. Clicking
in the end-arrows moves it 1%. Dragging the bar changes the slider value.
A
slider is used to set a numerical value in a definedrange. Clicking in
the body of the slider moves the slider about 10% by default. Clicking
in the end-arrows moves it 1%. Dragging the bar changes the slider value.
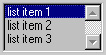 A
listbox allows the user to choose between several items. In many ways
it is like a radiobutton. One and only one item is chosen at a time. If
there are too many items to fit in the frame, then scrollbars automatically
appear.
A
listbox allows the user to choose between several items. In many ways
it is like a radiobutton. One and only one item is chosen at a time. If
there are too many items to fit in the frame, then scrollbars automatically
appear.
 A
frame is a decorative device with no actual function except visual grouping
of other controls.
A
frame is a decorative device with no actual function except visual grouping
of other controls.
- Menus/submenus
- Window menus are the typical menus that appear by default at the top
of all Matlab figure windows (except on Macintosh computers). You can
define your own and add to or replace the existing menus.
- Popup menus are really a uicontrol like a listbox, except you can only
see the current selection, unless you click on the popup menu.
- Context menus are associated with specific objects. Right-clicking on
an object with an associated context menu pops up the menu. The second
example below implements a contex menu.
- Drawing regions defined as typical Matlab axes.
- Dialog boxes may be defined to help the user navigate complicated choices
or to give the user information. The second example below implements several
dialog boxes. Possible dialog boxes include:
- error
- help
- input
- question
- file read/write
The various GUI elements have a lot of automatic behavior programmed in. For
instance, the slider element has built-in behaviors for dragging the slider,
clicking in the body of the slider (to make a big change in value), and clicking
in the end-arrows of the slider (to make a small change). Your program must
specify what to do with the value returned by the slider element. The following
code fragment implements a slider in a figure window. The main uicontrol
function would be executed once to define the control. The Callback
parameter is a vector of strings which defines what happens each time the user
manipulates the slider. In this simple example, the slider value is assigned
to a variable and printed in the command window. The variable slider1
is refered to as the handle to the control. The callback string refers
to slider1 to retrieve the value from the control handle.
slider1=uicontrol(gcf,...
   'Style','slider',...
      'CallBack', ...
   ['s1value=get(slider1,''value'');',...
      'disp (num2str(s1value));'...
   ]);
The slider appearance and function can be controlled by changing its properties.
The following code sets up the slider to a value-range of [-20 20], sets its position,
initial value, color, and the step size for clicks in the slider body and in the
slider ends.
slider1=uicontrol(gcf,...
   'Style','slider',...
   'Min' ,-20,'Max',20, ...
   'Position',[10,220,150,20], ...
   'Value', 10,...
   'SliderStep',[0.01 0.1], ...
   'BackgroundColor',[0.8,0.8,0.8],...
   'CallBack', ...
   ['s1value=get(slider1,''value'');',...
      'disp (num2str(s1value));'...
   ]);
As with any graphics object in Matlab, a list of the object's current properties
may be obtained by typing get(uihandle), or specifically for the
slider above get(slider1). A list of all possible property settings
may be obtained by typing set(uihandle), or specifically for the
slider set(slider1).
Usually when you write code in a procedural language like Matlab, you expect
execution to proceed linearly through the program (except for loops and subroutine
calls that you program). Writing a program with uicontrols is different in several
ways:
- The controls you define are 'owned' by a figure and persist even when there
is no matlab script running. The controls disappear if you close or clear
the figure. The visual state of each uicontrol, for example the position of
a slider, is maintained in the figure and not in the Matlab workspace. But
the handle to the uicontrol (and its data) may be in the Matlab workspace.
This means that if you type
clear all when you have uicontrols
in a figure, that the control will still be visible, but you may no longer
get its value. The complicated data storage relationship between the figure
and the workspace leads to lots of frustration for new programmers. Approaches
to handling this complexity are explained in the examples below.
- Each uicontrol (slider, button, menu) has a chunk of code which defines
it. This code is only executed once for each control. The 'callback code'
is not executed when the uicontrol is defined.
- Each uicontrol (slider, button, menu) may have a chunk of 'callback code'
associated with it. When a control is manipulated, this chunk of code executes.
Examples
- There is a tutorial and short example of a GUI
written by Doug Schwarz at servtech.com. This tutorial explains a very clever
way of packaging a GUI design so that all the functions of the design are
in one Matlab function file. The tutorial shows how to handle the complicated
data-storage relations mentioned in the introduction. All data is stored in
the Figure object and none in the Matlab workspace.
- I attempted to use most of the different types of uicontrols shown in the
introduction in one demo. There is a window menu, a pop-up menu, a context
menu attached to the plot line, several types of pushbuttons, a slider, dialog
boxes, and an edit field. The Matlab code is clean,
but the visual appearance is amazingly ugly because I spent no time with visual
design.
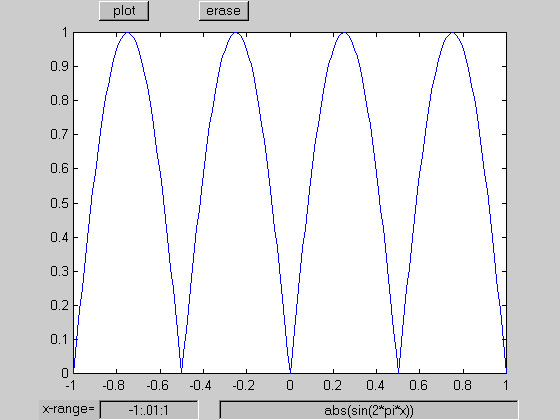
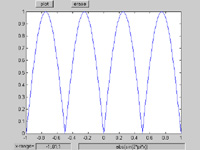
- The simple equation plotter, shown below, can be constructed with about
a page of Matlab code. The code consists of the
definitions of five UI controls, including pushbuttons, editable text, and
static text. All the dynamics of the code are controlled by default UI control
functions and callback properties for two of the pushbuttons. A less elegant
(but perhaps clearer) program uses an event-loop
to detect mouse clicks. The callback code in each control merely sets a flag
which is tested in the main event-loop.
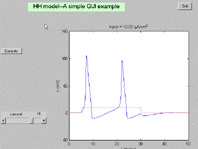
- There is a longer example which computes the classical
Hodgkin-Huxley response of a squid axon to a user-setable current. The actual
solver routine included in this example was written for Physiology 317
- Methods in Computational Neurobiology (UIUC) by M. Nelson. The figure
window generated by the example code is shown below (click on it for more
detail). A modified version of the Hodgkin-Huxley
example uses Matlab ODE solver routines and has a few small GUI enhancements,
but requires a separate function file for the integrator.
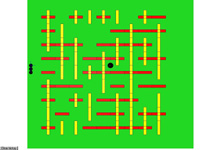
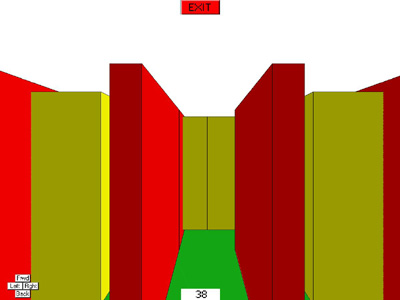
- A student and I used a modeling
system to build a simple maze. The maze was presented as both an overhead
and in-the-maze view. We made a simple GUI to navigate the maze. There are
two files necessary to run this example; maze6.m and
maze6key.m. The first program defines the maze and
a bunch of UIcontrols. The second program is a function which is called to
implement camera movement through the maze. You must also download the modeling
system programs. An example of the two views is shown below.
- This example is a minimal user interface which allows a user to click on
a plotted curve and read back the index of the plotted point nearest to the
mouse click. Such a function might be useful for a parametric plot where x(t)
and y(t) and you want to get t from the plot. The following code uses the
window button function to detect a mouse-down event and a uicontrol to stop
the point-aquisition loop.
clf
clear all


%plot a couple of sine curves to click on
x = 0:.1:6.28;
y = sin(x);
hline1=plot(x,y);
hold on
hline2=plot(x,-y/2+.4);


%the mouse-click sets a flag for point aquisition
set(gcf,'windowbuttondownfcn','hit=1;');

%make a control to stop the loop
uicontrol('style','pushbutton',...
   'string','Quit', ...
   'position',[0 0 50 20], ...
   'callback','stopit=1;');


%start looping and waiting for a mouse click
stopit=0;
while (stopit==0)

   %check for valid object and chek for line 1
   %and see if the mouse was clicked
   if ~isempty(gco) & gco == hline1 & hit==1

      %get the mouse position in graph units
      mouse = get(gca,'currentpoint');

      %calculate the point nearest to the
      %mouse click
      [val, pnt] = ...
         min( sqrt(...
         (get(hline1,'xdata')-mouse(1,1)).^2 ...
         +(get(hline1,'ydata')-mouse(1,2)).^2 ...
         ));

      %display the result
      disp(['line1 point=',num2str(pnt)])

      %wait for the next click
      hit=0;
   end

   %check for valid object and chek for line 2
   %and see if the mouse was clicked
   if ~isempty(gco) & gco == hline2 & hit==1

      mouse = get(gca,'currentpoint');

      [val, pnt] = ...
         min( sqrt(...
         (get(hline2,'xdata')-mouse(1,1)).^2 ...
         +(get(hline2,'ydata')-mouse(1,2)).^2 ...
         ));

      disp(['line2 point=',num2str(pnt)])
      hit=0;
   end

   drawnow
end
- This example builds on the last example to make a editable spline curve
with a user-selected number of control points. Clicking anywhere on the figure
moves the nearest control point to that vertical position.
clf
clear all
set(gcf,'doublebuffer','on')

tmax = 2 ; % seconds.
NumControl = 20 ; %number of control points
FPS = 30 ; %frames/sec
ForceZeroSlope = 1 ;
AngleRange = 90 ;

t = linspace(0, tmax, NumControl) ;
tt = linspace(0, tmax, tmax*FPS) ;
%start with all zeros in control points
y = zeros(1,length(t));

if ForceZeroSlope
    cs = spline(t,[0 y 0]);
else
    cs = spline(t,y);
end
yy = ppval(cs,tt);

hold on
sp = plot(tt,yy);
line1 = plot(t,y,'or');
set(gca, 'ylim', [-AngleRange AngleRange])
%set(gca, 'position', [0 0 1 1])

%the mouse-click sets a flag for point aquisition
set(gcf,'windowbuttondownfcn','mousedown=1;');
set(gcf,'windowbuttonupfcn','mouseup=1;');
set(gcf,'windowbuttonmotionfcn','mousemotion=1;');

%make a control to stop the loop
uicontrol('style','pushbutton',...
    'string','Quit', ...
    'position',[0 0 50 20], ...
    'callback','stopit=1;');

%start looping and waiting for a mouse click
stopit = 0;
mousedown = 0;
mouseup = 0;
mousemotion = 0;

while (stopit==0)

    %check for valid object and chek for line 1
    %and see if the mouse was clicked

    if   mousedown==1

        %get the mouse position in graph units
        mouse = get(gca,'currentpoint');
        %calculate the point nearest to the
        %mouse click
        lineX = get(line1,'xdata');
        lineY = get(line1,'ydata');
        [val, pnt] = min(abs(lineX-mouse(1,1)));

        %move the control point on the plot
        lineY(pnt) = mouse(1,2);
        set(line1, 'ydata', lineY);

        %make new spline
        if ForceZeroSlope
            cs = spline(t,[0 lineY 0]);
        else
            cs = spline(t,lineY);
        end
        yy = ppval(cs,tt);
        set(sp, 'ydata', yy);

        %wait for the next click
        if mouseup == 1
            mouseup = 0;
            mousedown = 0;
            mousemotion = 0;
        end
    end

    drawnow
end
close
- The following code fragment can be used to measure distances in an axes
context. A window button-down event causes a point to be stored and a dragbox
to be drawn as a visual reference. A window button-up event stores the current
mouse point and calculates a distance in axes units. This fragment might be
located at the beginning of a program to be used for data capture later.
set(gcf,'WindowButtonDownFcn',...
       ['initialpt=get(gca,''currentpoint'');'...
          'rect=rbbox;' ...
       ]);

set(gcf,'WindowButtonUpFcn',...
       [...
          'finalpt=get(gca,''currentpoint'');'...
          'disp(finalpt(1,1)-initialpt(1,1));'...
       ]);
Another small code fragment shows how to detect which mouse button was pushed.
The undocumented figure property selectiontype holds the current
mouse button depressed. The values it can contain are the strings normal,
alt, extend or open. Any button, when double-clicked,
causes this property to return open.
%Detecting which button is pushed.
%Use:
%get(gcf,'selectiontype')
%Which returns:
% normal | open | alt | extend
%Meaning:
% left button | doubleclick | right button | middle button
figure(1);clf;
axis
set(gcf,'windowbuttondownfcn', ...
['disp(get(gcf,''selectiontype''));'])