Anaglyph 3D
with Stereo Camera Depth Map

Introduction

We created a realistic, real-time, anaglyph 3D video and associated depth map through hardware acceleration on an FPGA.

Our group was interested in real-time image processing. By using an FPGA, not only could we design a system to read-in, alter, and display video to a VGA screen, but we could do so without lag. We also wanted to utilize the additional information provided by a stereo camera setup to add more depth to our project. We therefore decided to tackle 3D imaging via anaglyphs. This involved overlaying red and cyan versions of an image and using 3D glasses to obtain a neat visual effect. A final component we added to our design was a depth map, which was able to determine objects’ distances from the cameras. We then displayed our depth map to the VGA screen by encoding ranges of distances as colors. By moving an object towards or away from the cameras, its color on the display was changed. Not only was this a challenging project, it also created an engaging user experience that everyone can enjoy.

High Level Design

Inspiration

Anaglyph 3D is a stereo imaging effect that mimics humans' vision to produce realistic 3D images. It is composed of two copies of the same image: one in red and the other in cyan, with varying horizontal shifts. The larger the shift between the red and cyan versions of an object, the closer it appears to the viewer. This effect is seen by wearing standard red/blue 3D glasses. The eye covered by the red film filters out the red part of the image, leaving only the cyan. The opposite occurs for the eye covered by the cyan film. This allows a single 2D image to present different views to each eye, which our visual cortex combines giving the appearance of depth; objects further from the camera appear to extend backwards as if you were looking into a diorama. By controlling the horizontal offset between red and cyan pixels, we can place some objects in the foreground and others in the background.

...

Figure 1: Video Splitter Diagram

We obtained our stereo anaglyph image by mounting two cameras adjacently on a custom 3D printed stand. This stereo setup mimics how humans see through two eyes: vertically aligned, horizontally offset and rotated slightly inward. By feeding these images into a video multiplexer, we can send both images to the FPGA simultaneously, giving us two images that are very similar to what two human eyes would see. This is illustrated in figure 1. On the FPGA, we can apply red and cyan filters to these images using bitmasks, overlay them, and then output the combined image to the screen.

Although advanced computer vision algorithms can calculate a depth map from visual cues in a single image, with the stereo camera system we are able to leverage some very basic techniques to create a rudimentary depth map of the image. This was achieved by comparing the input images and finding the horizontal offset between similar sets of pixels. Then, by encoding these offsets as colors, we displayed our depth map to the VGA screen alongside its complementary anaglyph image. We based our calculations on the assumption that the objects in the images are the same, with the only difference being the position of these objects within the image dimensions. This means that if a certain group of pixels in one image is shifted horizontally, it should match a group of pixels in the other image. The horizontal shift needed to find a match in the two images depends on the object's distance from the cameras, since close objects have a higher offset compared to far ones.

Logical Structure

Our original setup contained a VGA subsystem as well as a Video In subsystem, both instantiated in Qsys. The Video In subsystem processed the NTSC video input and wrote color values for each pixel to memory through DMA. Similarly, the VGA subsystem handled the transferring of the values in the SRAM to the VGA port. Therefore, from the point of view of our code, we only had to concern ourselves with reading from Video In memory and writing to VGA memory. These memory interactions were performed over the bus using an External Bridge to Avalon Bus module, which allowed us to specify bus addresses to read or write from.

...

Figure 2: Custom VGA Driver (taken from course website, reference 2)

Though a good starting point, this setup, using the bus, limited us to completing only a single read or write at a time. In addition, bus interactions are generally slower and take a variable amount of cycles to complete, depending on which other peripherals are also trying to use the bus. In order to simultaneously read from Video In and write to VGA memory, we moved all memory interactions off the bus by exposing one of their two read/write ports directly to our Verilog code. Also, to further parallelize our code, we implemented the custom VGA driver provided on the course website (References 2). This driver supplied the outputs necessary to communicate with the VGA by implementing the standard VGA protocol, illustrated in Figure 2. The interaction between our Verilog code and the custom driver consisted of three signals: the values of the x and y coordinates for the next pixel, and the 8-bit color value for the current pixel to be sent to the VGA. This allowed us to dramatically reduce the amount of SRAM utilized in our design, since we only needed to store the pixel color information for the size of the video being displayed to the screen (165x100), rather than the size of the entire VGA display (640x480), as required by the VGA subsystem. The second advantage was that we were able to instantiate separate memories for the anaglyph image and the depth map, allowing us to update them in parallel.

Unfortunately, we were unable to find enough information about NTSC protocol to experiment with creating a custom Video In system similar to our VGA driver. Despite this, we were still able to optimize the reads by dividing the overall memory into two blocks placed at consecutive bus addresses. To our knowledge, this had not been implemented before in ECE 5760 and thus we were excited to find this strategy successful. We believe this is because the DMA channel was provided with a starting address and a memory size, so two consecutive memory blocks looked the same as one large block. With this setup, we were able to simultaneously read the top and bottom video from the video splitter (see figure 1).

Software Design

Implementation Process

...

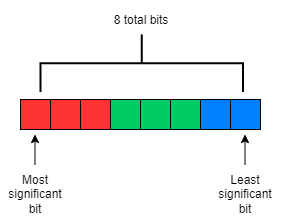
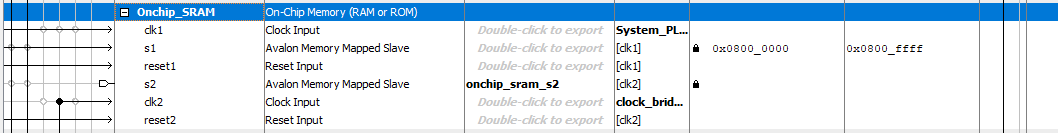
Figure 3: 8 bit color

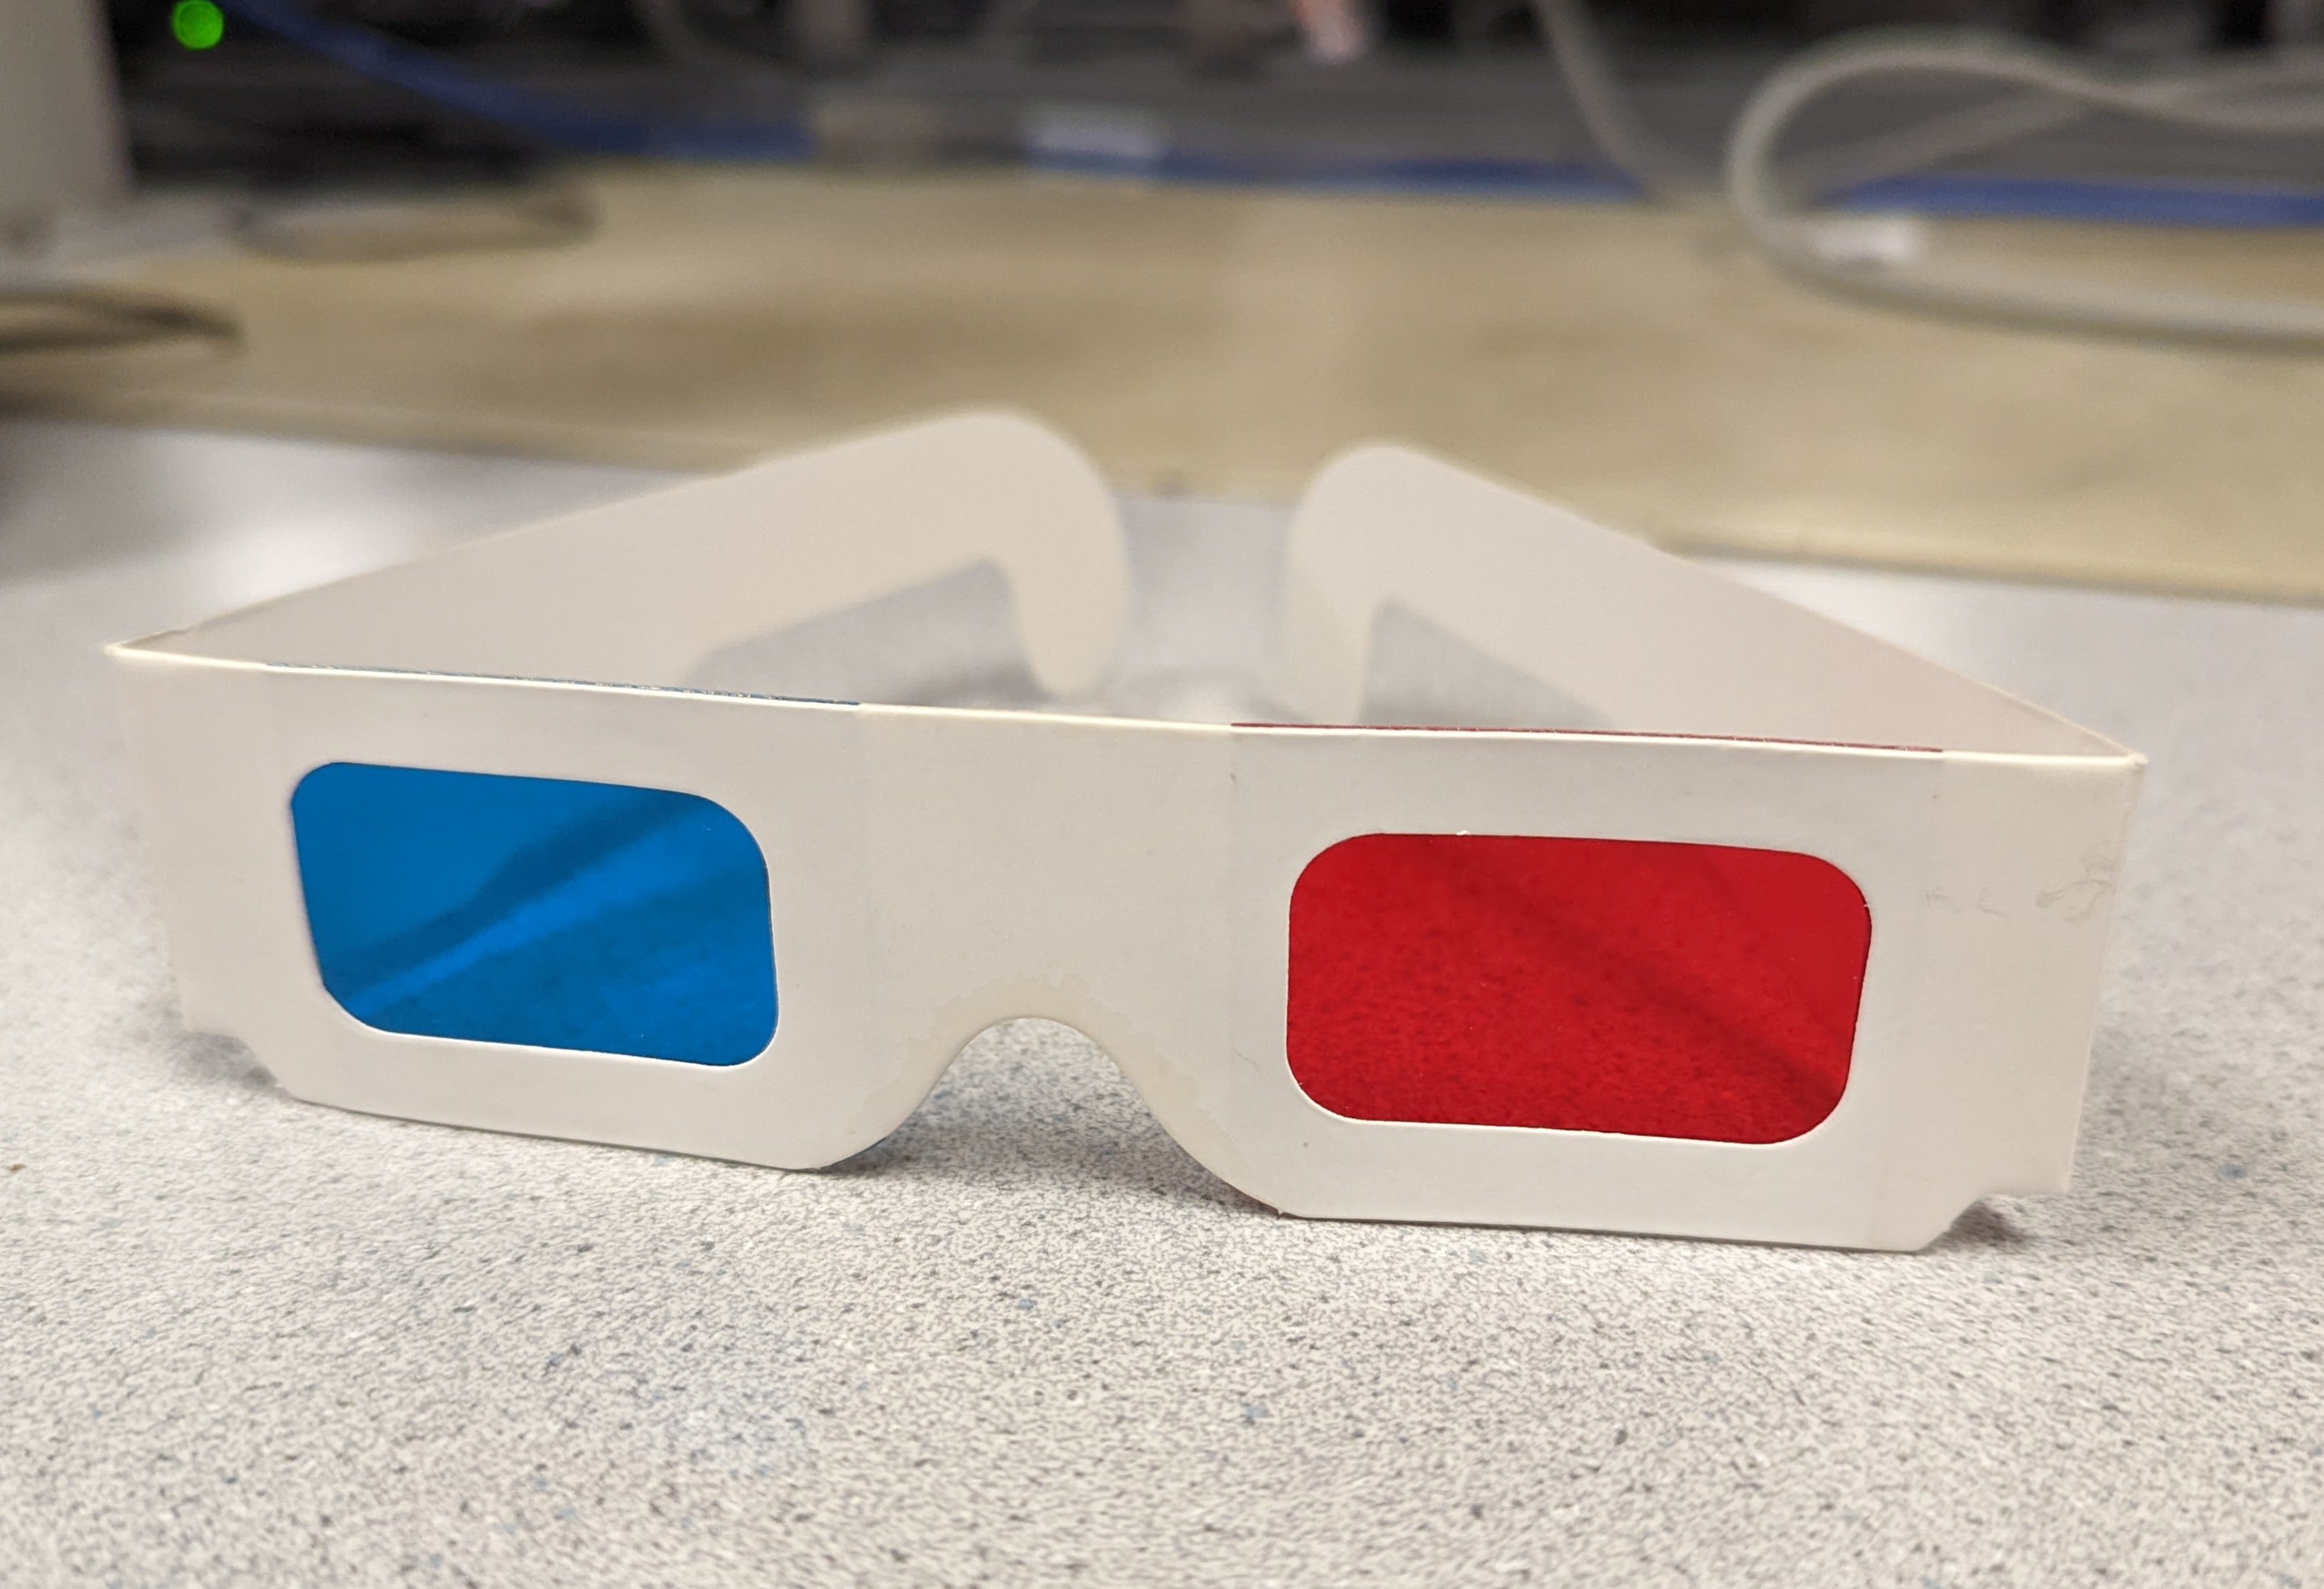
When starting this project, we unfortunately received a broken camera, leaving us with only one that functioned. We therefore felt an appropriate first step with our current hardware was to implement an anaglyph image from a single camera with a constant shift between red and cyan filtered images. The Video In subsystem utilized an 8-bit color format of [RRR GGG BB], illustrated in figure 3, which provided 8 levels of intensity for red and green, and 4 levels for blue. To obtain a red filtered image, we logically AND'ed each pixel with the bitmask [111 000 00]. This zeroed out all green and blue components but retained the red components. Similarly for the cyan filtered image, we used the bitmask [000 111 11] to zero out all red components but retain the blue and green portions.

In order to produce this shift, we created a buffer that stored color values for a certain number of pixels, then performed Video In reads and VGA writes at addresses offset by the size of the buffer. As a result, we had to carefully manage the offset between the read and write addresses, since the pixel we were writing to the VGA depended on multiple pixel values.

We recognized that this would likely not produce the desired effect since a constant offset is not able to encode depth information. However, this served as a proof of concept for taking advantage of spatial locality using buffers, rather than having to repeatedly read from the same memory address to access the same data.

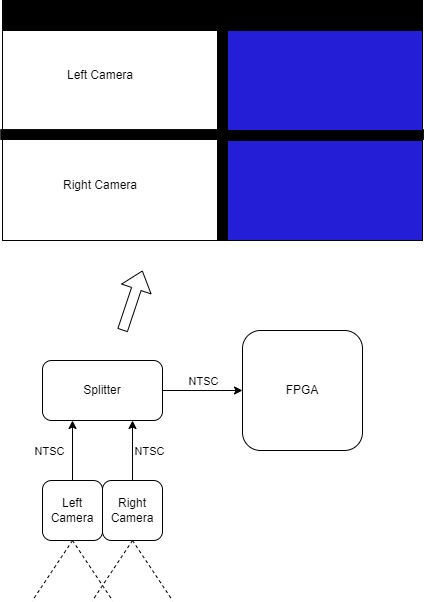
Once we had two working cameras, we created an FSM that first read a pixel color from the top video and then the bottom video, and then logically OR’ed the bit masked values together to produce the final color, which was written to VGA memory. The challenging part of this step was determining how the video splitter divided the 320x240 screen in displaying the different videos. After this was working, we spent most of our time restructuring the Qsys setup to support our depth map.

...

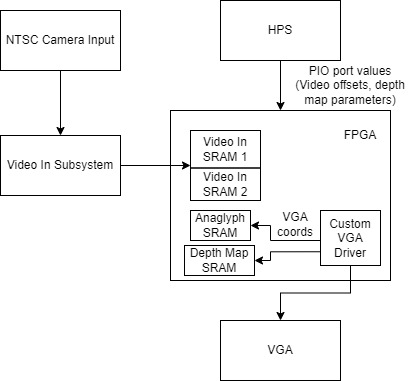
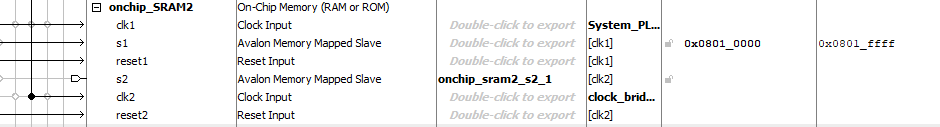
Figure 4: Block Diagram

...

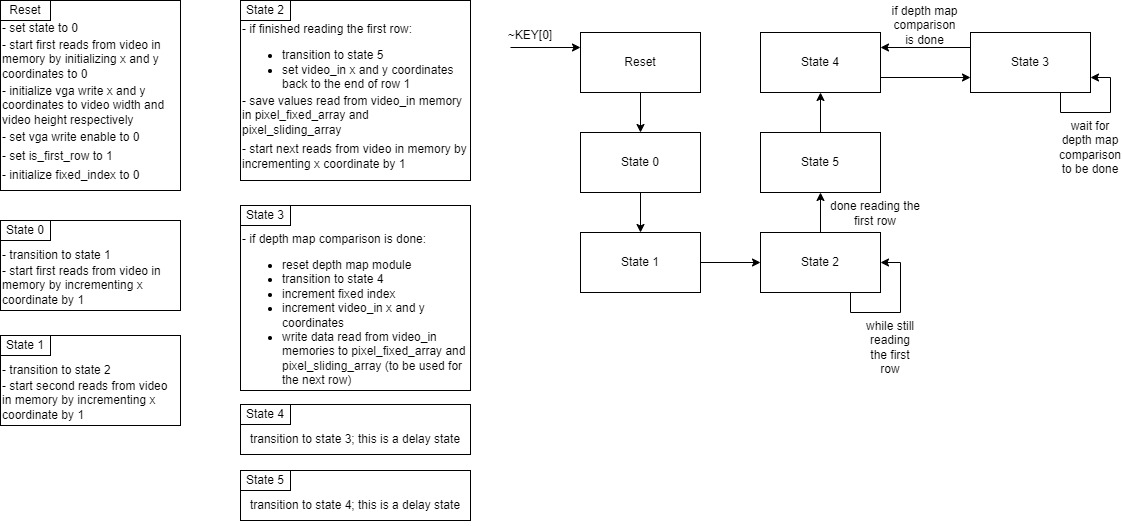
Figure 5: Video In FSM

Depth Map

To implement our depth map, we read in a row from each image at the same height. We take a fixed group of N pixels from one and scan groups of N pixels from the other until we find a matching set, and then record the distance between them. We repeat this process for each overlapping group of N pixels in the first row, and then for every row in the image. We determine the similarity between two pixels by taking the Euclidean distance between their red, green, and blue values. We can then determine the similarity between two groups of pixels by summing up these Euclidean distances. If this sum is below a threshold, we consider these groups of pixels as a match. Colors in the depth map are then assigned based on distance. To avoid an expensive square root calculation, we instead compared the squared distances. This color mapping was tuned by hand, and we eventually settled on 9 bins: (1,10), (10,20), (20,30), (30,40), (40,50), (50,60), (60,70), (70,80), (80,90), and a default case which primarily caught 0 distances.

...

Figure 6: Equation for the pixel distance

In order to meet the timing requirements associated with real-time video and avoid memory bottlenecks, we had to carefully manage our memory reads and writes. Our main optimization was to concurrently read in new pixels into the arrays as we progressed through the groups. Due to our stereo camera setup, one of the images we received was shifted left and the other shifted right. So for a group of pixels in the right image, we knew its matching group of pixels in the left image must be at an index of greater or equal value. For example, if a group of pixels in the right image covered indices [50, 55], then the matching group of pixels in the left image must be somewhere in the indices [50, 164]; indices [0,49] did not need to be considered. Therefore, indices [0,49] could be overwritten with values for the next row's pixels.

The utilization of spatial locality meant that despite having to perform more involved calculations with data spanning across an entire row in the video, we were still doing the minimum amount of reads necessary. In addition, after the warmup associated with reading the first row, we did not have to wait more than one cycle after a read. Pipelining our memory interactions allowed our depth map to run in real time with the video. This was achieved by reading in a new value from the next row as we increment the value of our fixed index.

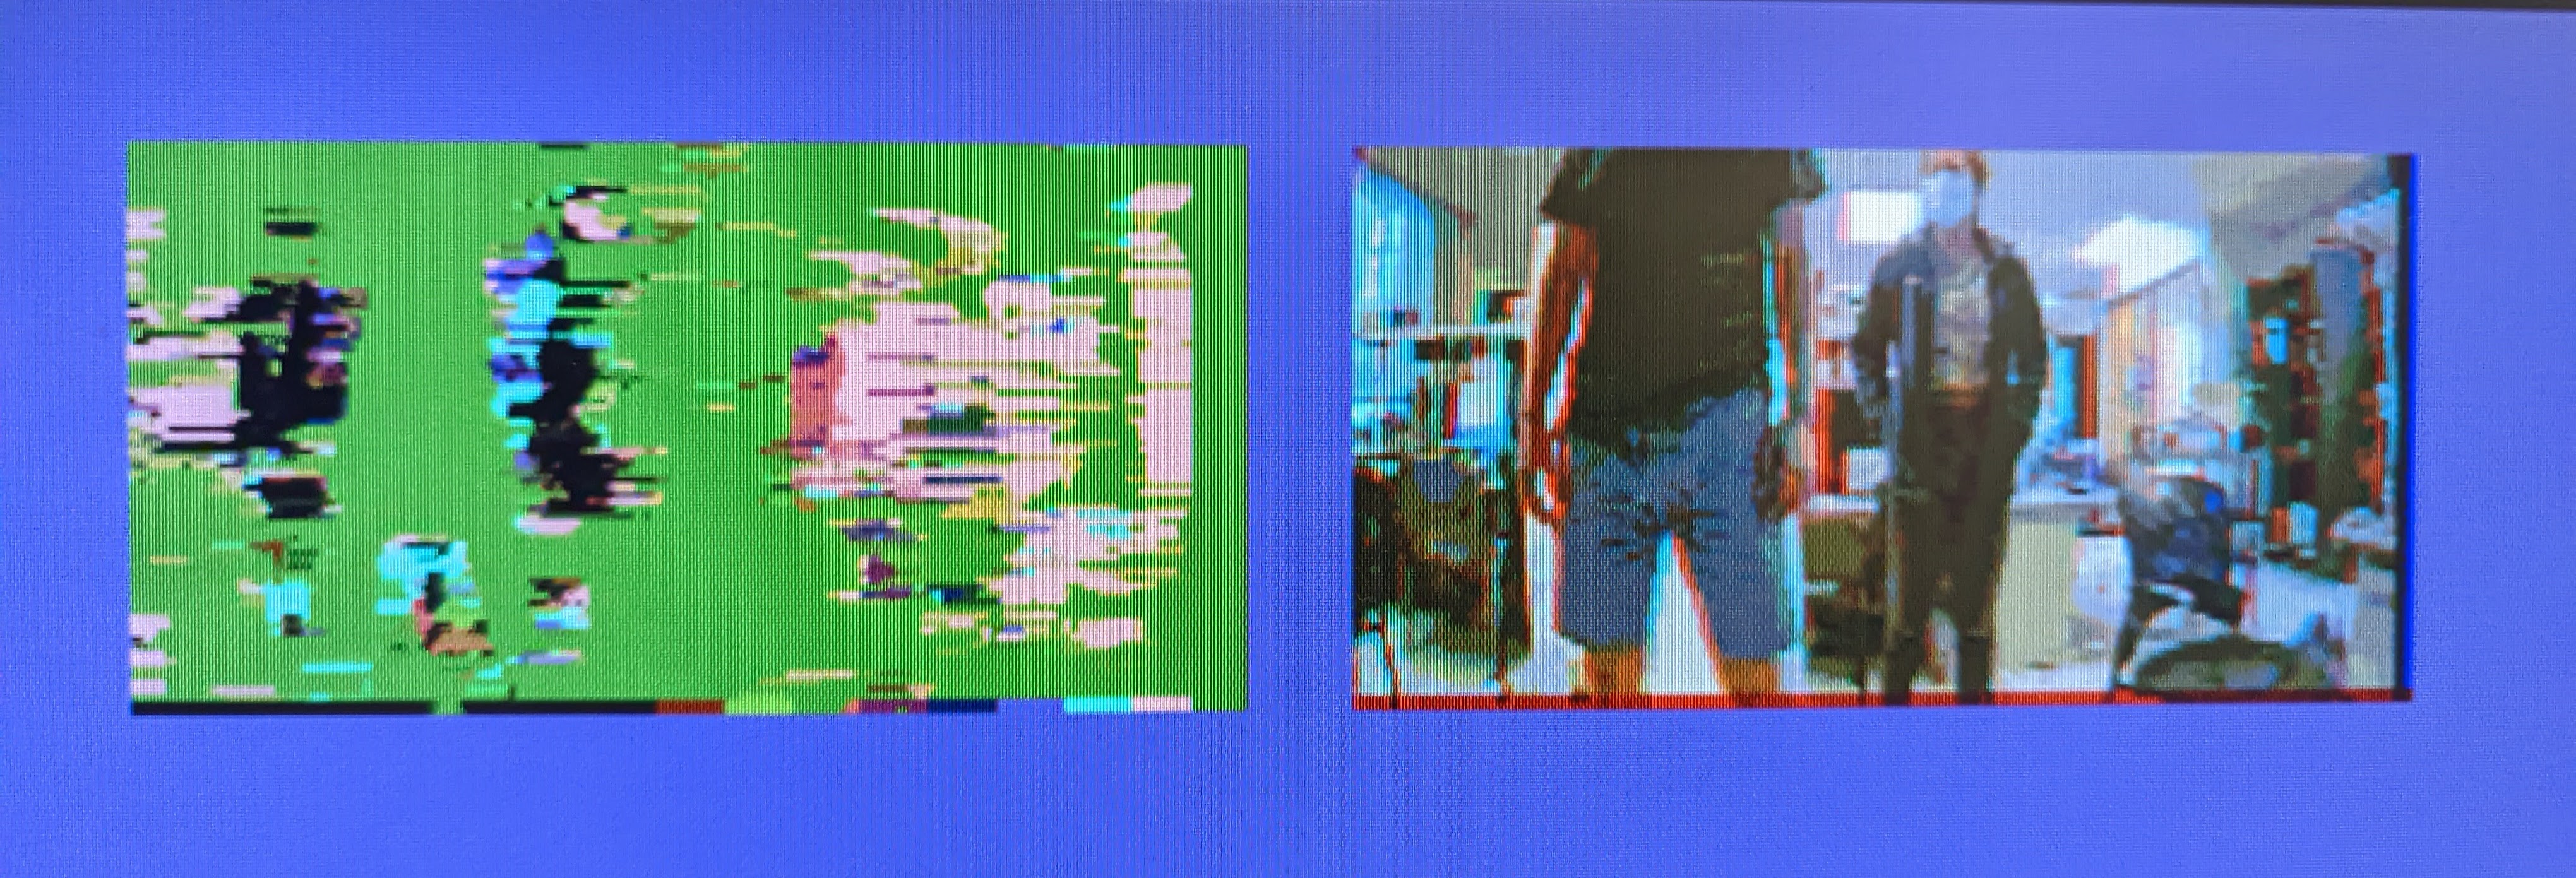
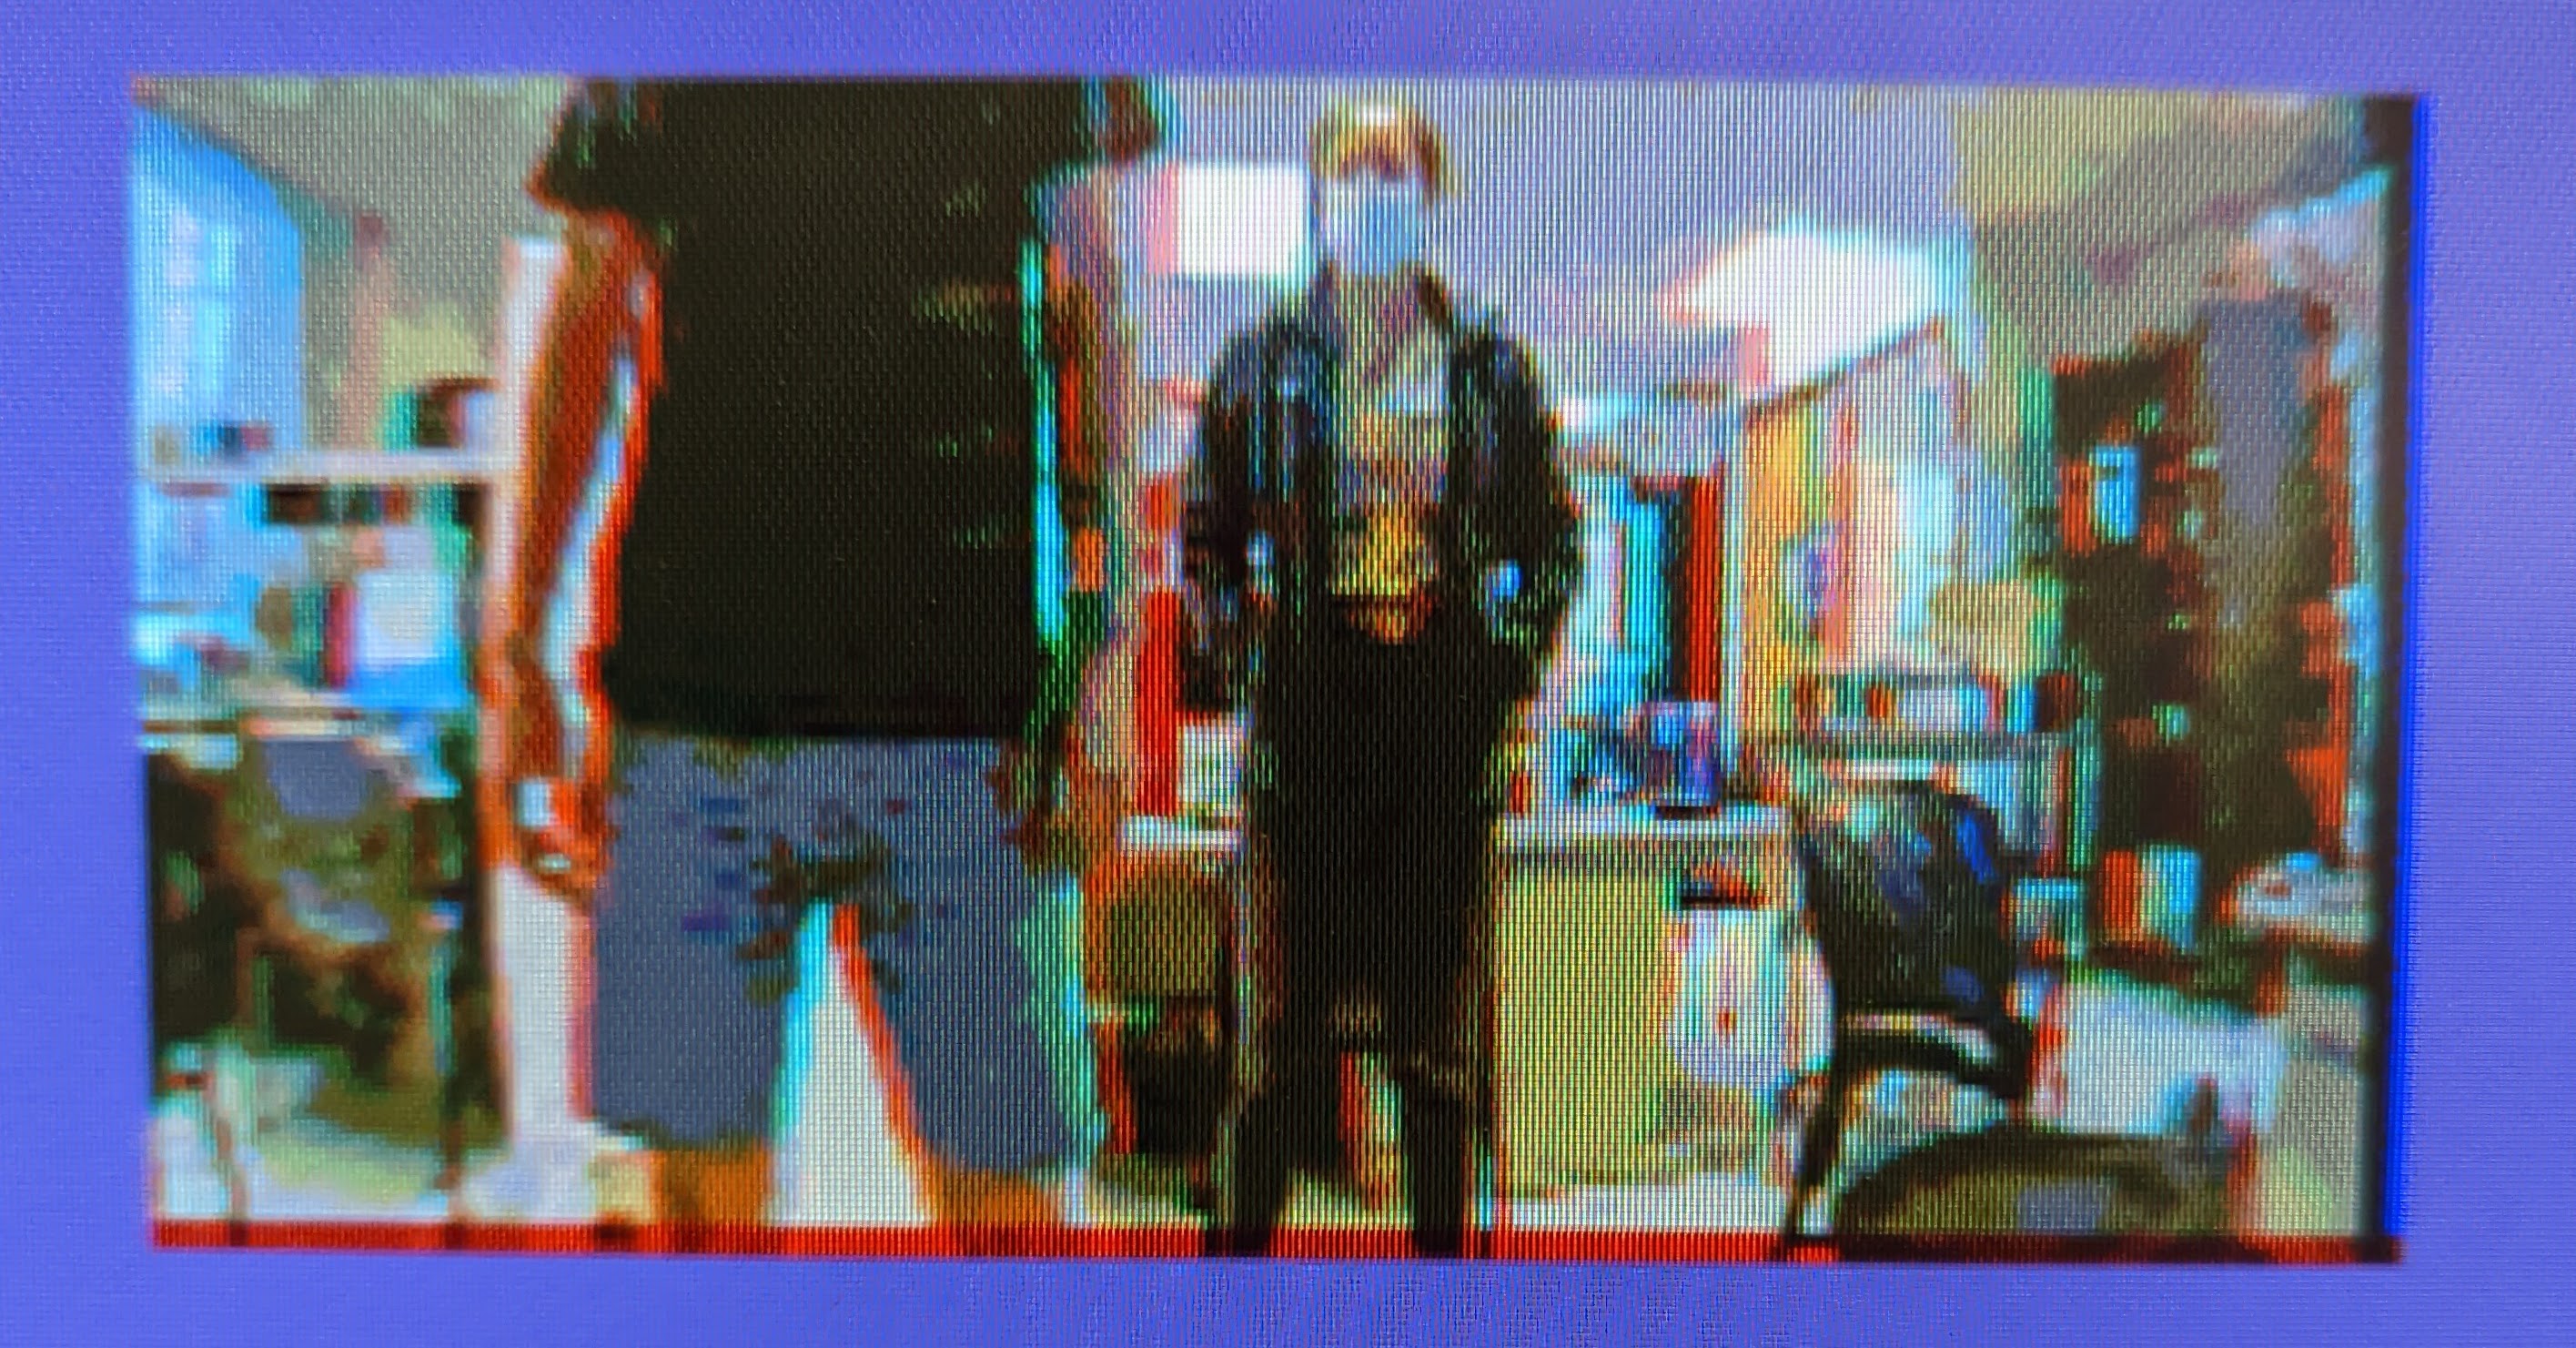
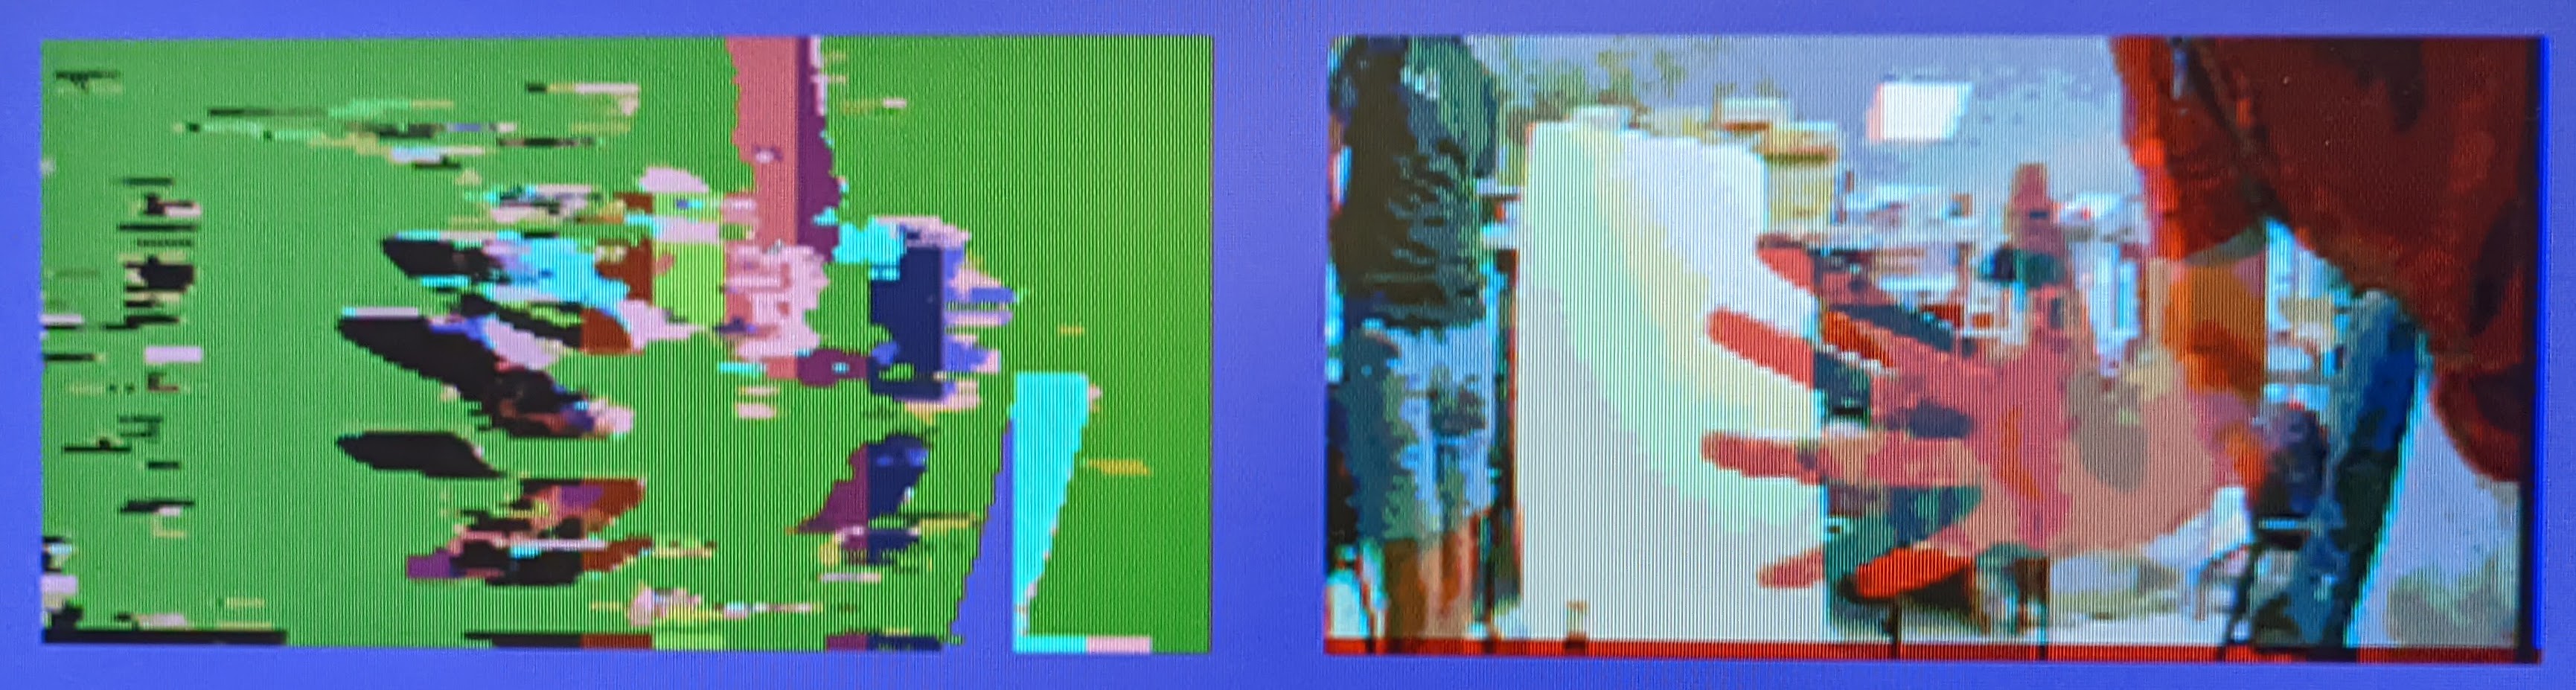
This simple algorithm worked surprisingly well, producing an image that discernibly showed near and far objects. When testing with a plain black piece of foam, we could clearly see the color transitions as we moved it away from the camera. However, we noticed that in the middle of the square there was a section of 0 distance, regardless of how far away it was. We believe this was due to the low resolution of the cameras, and without features in the middle, the first set of pixels tried was a match. We had a similar problem with people standing and our hand moving in front of the camera, so we think that a video with higher resolution or a more advanced algorithm could overcome this. Interestingly, in its current form the output worked better as an edge detection algorithm than a full depth map. This is another aspect of stereo cameras that we would have liked to explore given more time.

...

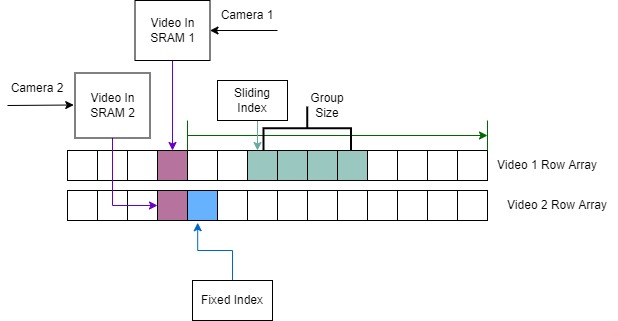
Figure 7: Our strategy for pixel comparisons in the depth map calculation

Depth Map Challenges

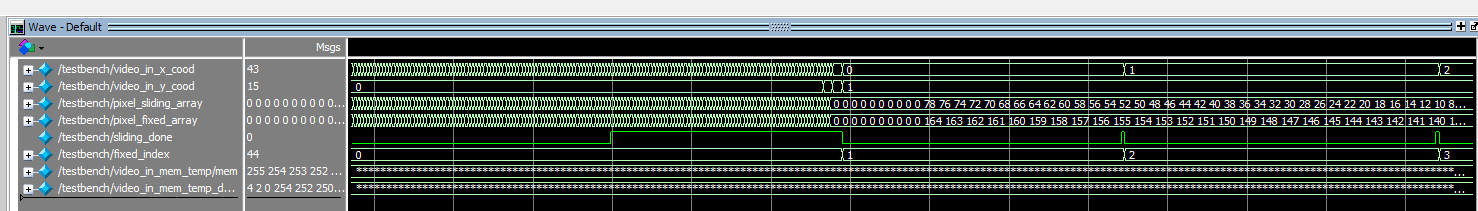
The two cycle memory read delay led to much difficulty in correctly mapping the data from Video In memory to its appropriate index in the array, since the read address was offset from the incoming value. This was most apparent when utilizing register arrays to store data for a row of video pixels. Our depth map module only interacted with these arrays and was not concerned with how the values were read from memory. This meant that after resetting the system, the arrays needed to be populated before utilizing the output from the depth calculations. The two cycle read delay necessitated waiting two additional cycles after the read address reached the last pixel in the first row in order to completely fill the first row. We identified this problem by studying the waveforms from Modelsim.

HPS: C Code

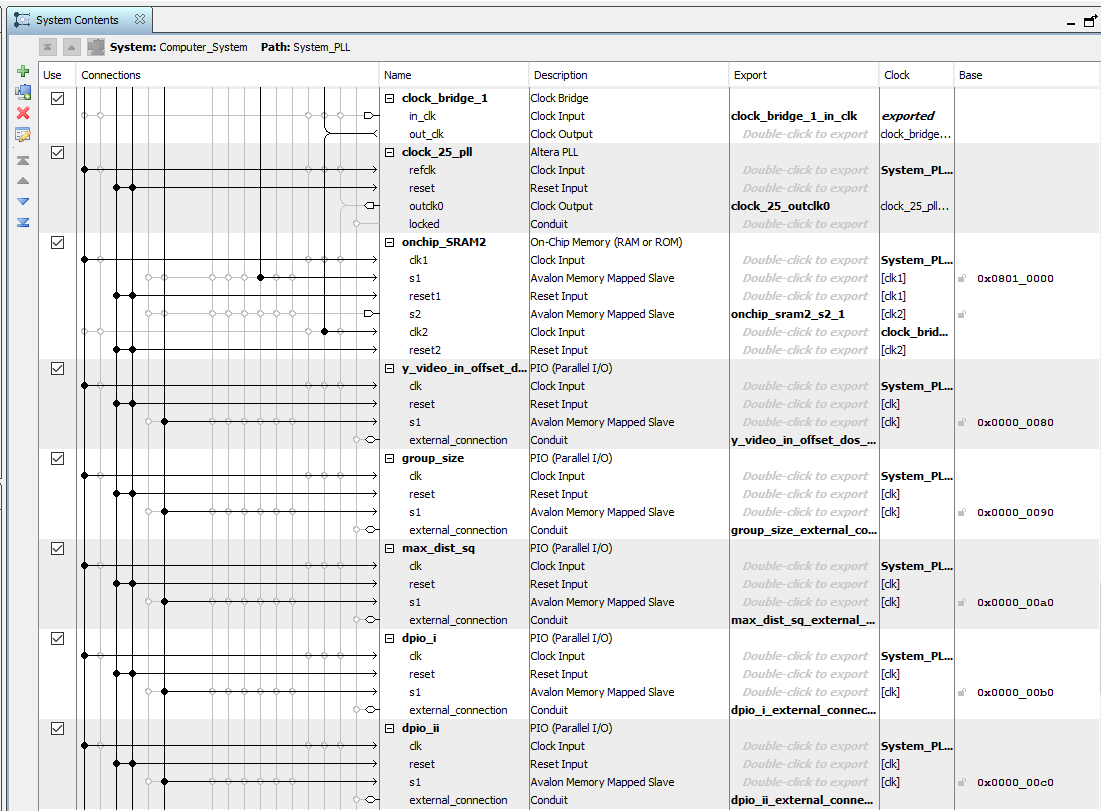
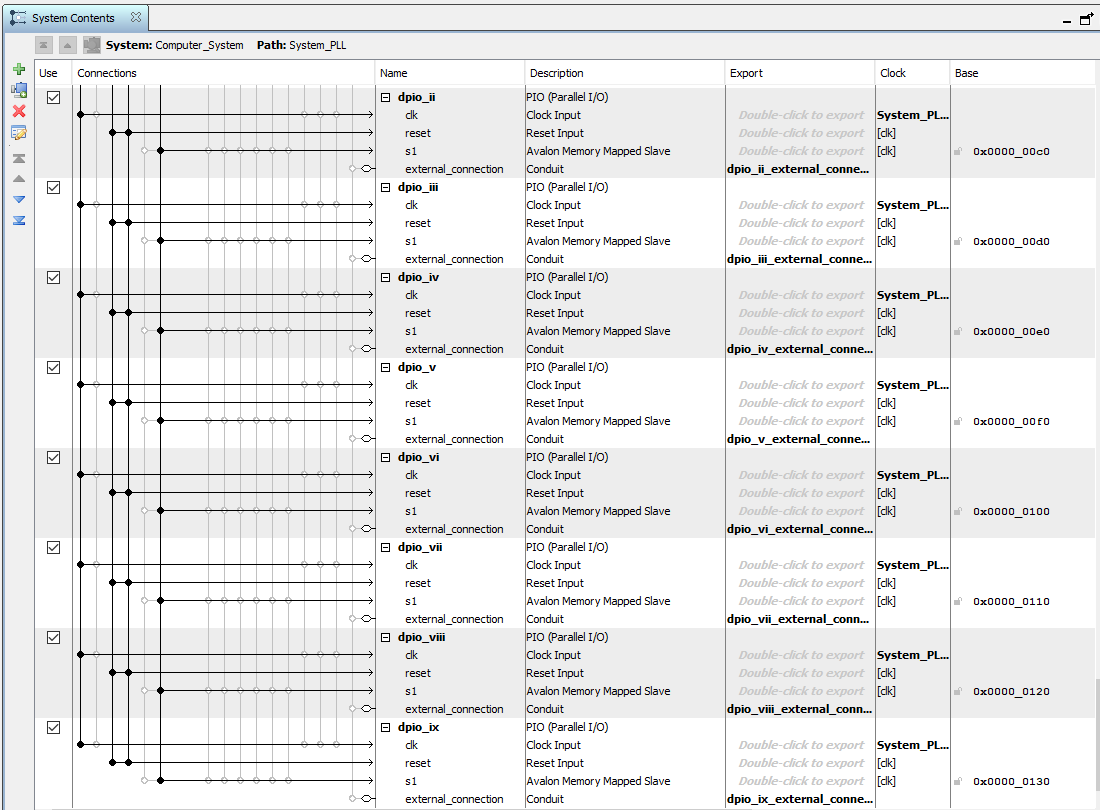
As with many of our previous labs, our C code was used as a command-line interface to set parameter values on the FPGA. This was done using a total of 16 PIO ports, all connected to the lightweight AXI bus. Nine of them were for setting color boundaries of our depth map so we could tune the sensitivity. This allowed us to more easily identify the relative shift amount between objects in the background and foreground. We also had two more PIO ports associated with the depth map. One was for the number of pixels in each group being compared (i.e. the number of pixels). The other was for setting the threshold value, which determined if pixel groups were similar enough to be considered a “match”. These PIO ports were established out of convenience, since they allowed us to tune the parameters of our depth map without having to recompile our verilog code.

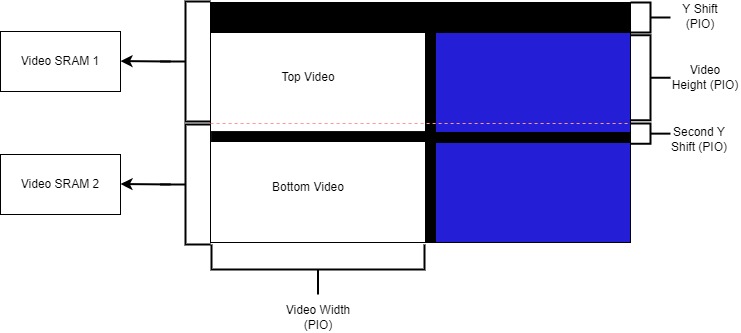
Our other five PIO ports were associated with the videos we displayed to the VGA screen as illustrated in figure 1. Two of them were values for the height and width of the videos output by the video splitter. This was important because we were unsure about the exact dimensions of the videos in the video splitter, and finding these values experimentally was more efficient. We also had two PIO ports for the y-offset of the heights of each video. These were necessary because not only were the videos output by the splitter at different heights but there were also black bars at the top and bottom of the videos creating discontinuities between images. Therefore, the locations in memory corresponding to the top of each video were different, so we needed to tune these values to properly overlay the two videos. The last PIO port was added to set an x shift amount for our video but was never actually used.

Within the C code, the address of each PIO is obtained by adding a specified offset to the lightweight bus address. All PIO ports are spaced out by a minimum of 16 bytes. We set initial values for each of the PIO ports and then run an infinite loop in our C code, which contains a large switch statement. The loop prompts the user for an input character, y (y shift), d (second or “dos” y shift), w (video width), h (video height), g (group size), m (max pixel distance threshold) or n (depth numbers to alter pixel colors). We read in the input character using the scanf function and then enter a case in the switch statement based on the value. In each case of our switch statement, the user is again prompted to input a value, but this time the number they wish to set the chosen parameter to. The only exception is for depth numbers input which also prompts the user to input which depth value they would like to change, as there are nine in total. The default case for all our switch statements simply print to standard-out that the user entered an invalid command.

An interesting fact we learned earlier on in the course is that when reading a character from standard-In using scanf(“ %c”, &myChar), placing a space before the %c automatically tells the program to ignore extraneous the newline character that is obtained when the enter key is pressed.

Things you tried which did not work

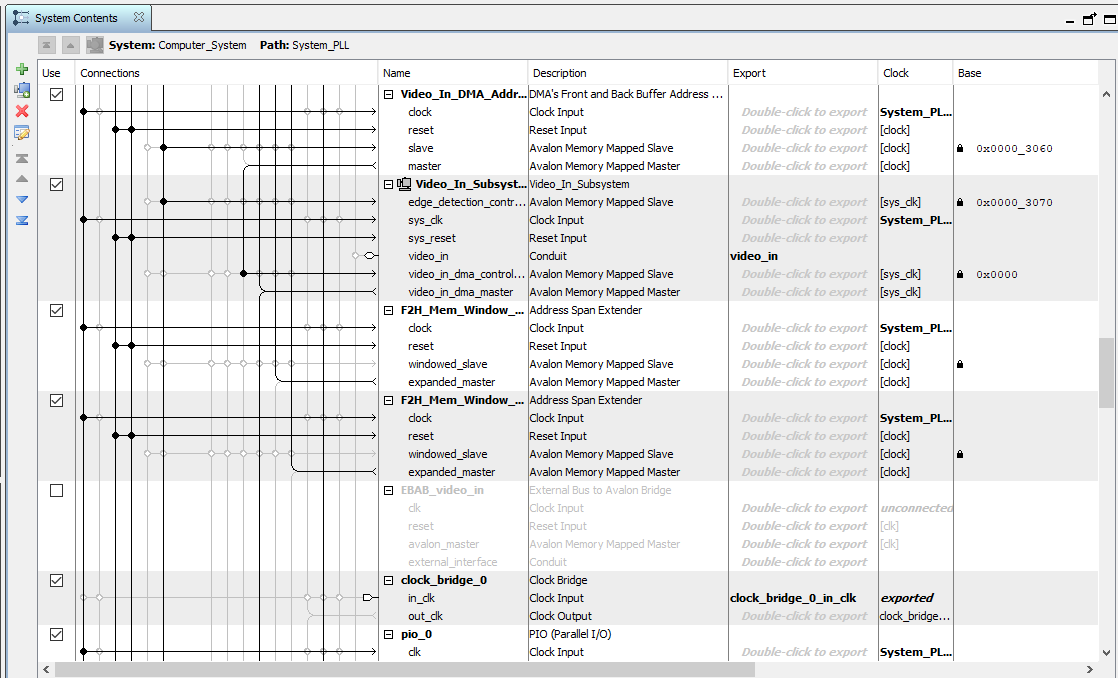
When modifying the configuration of Video In memory, we attempted to split it into more than just two different blocks. We wanted to further parallelize the reads from Video In memory by breaking it into smaller blocks and taking advantage of the increased number of read/write ports. However, because we were utilizing the Video In Subsystem from Qsys, these memory blocks needed to also be instantiated in Qsys. This introduced the unforeseen limitation of SRAMs needing to be page-aligned on the bus. Further dividing our memory caused them to be smaller than a page, meaning the SRAMs were not continuously aligned and data was getting lost.

...

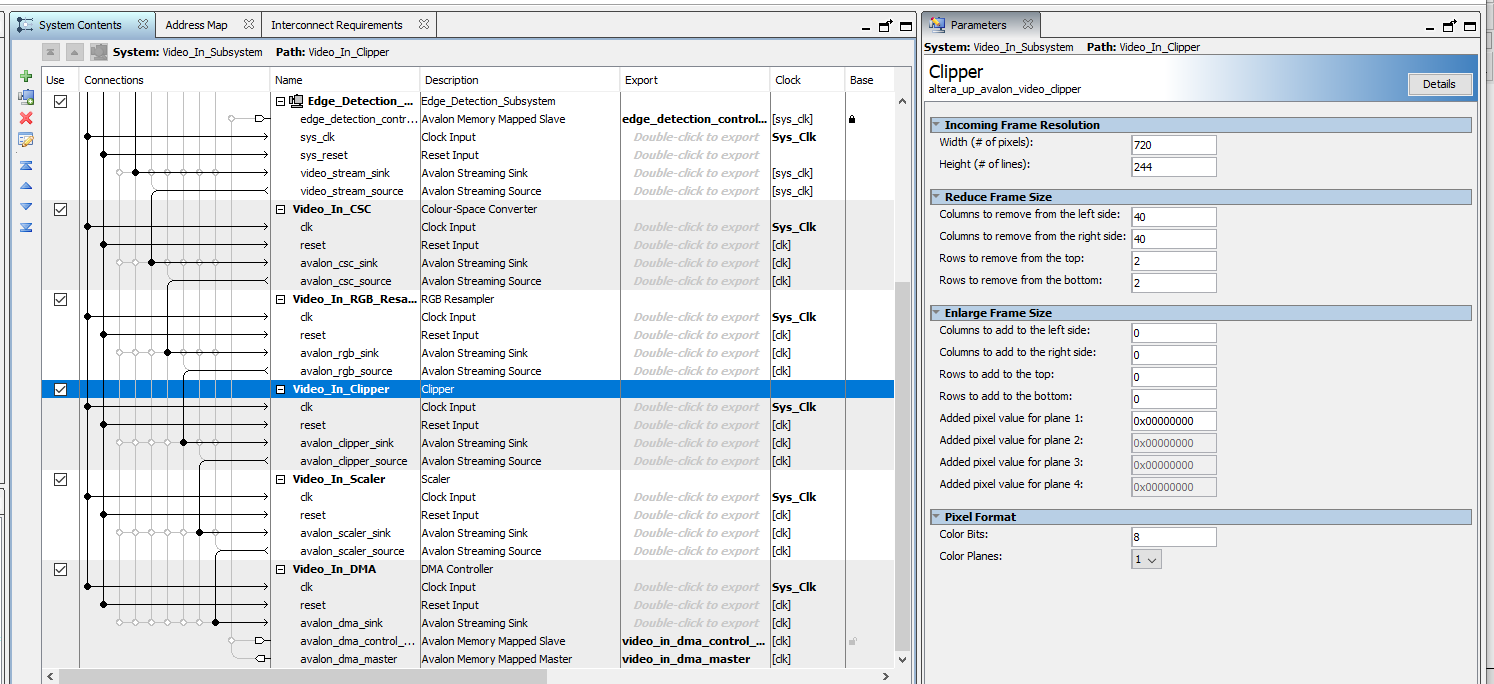
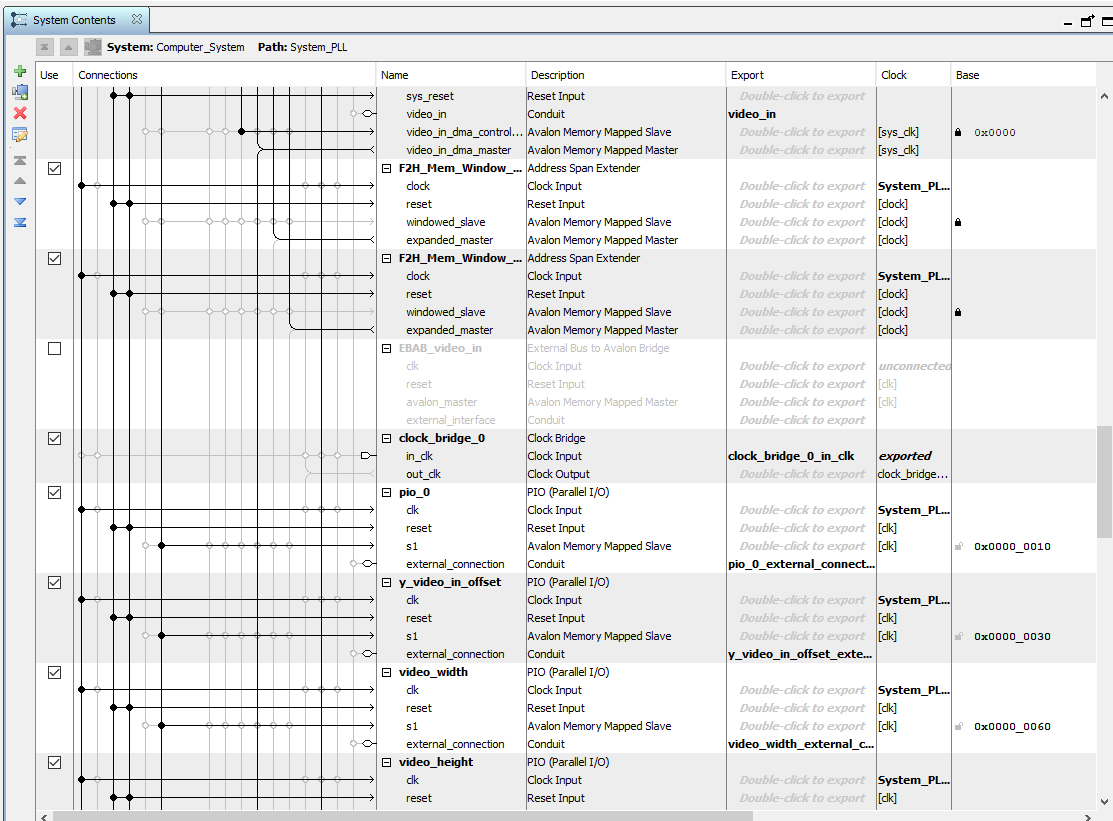
Figure 8: Video In Qsys

In addition, the black bar introduced by the video splitter meant that the two videos were not cleanly divided between the two blocks of memory. We attempted to solve this issue by modifying the amount that the input video was getting clipped in the Video In Subsystem (figure 8). Originally, the input was of size 720x244, and was then clipped by a total of 80 pixels horizontally and 4 pixels vertically. After being clipped, it was then horizontally compressed by a factor of 2. We tried increasing the amount being clipped at the top so that the first video would fit entirely in the first half of memory, since we figured that clipping it to a size smaller than 320x240 should not change anything. However, this strangely resulted in green dots appearing in our image. We suspected it was from the blue bits getting clipped and overflowing to green, but were unsure as to what caused this. However, even after reverting our changes, the green dots still persisted. In the end, we were never able to figure out the exact cause of the problem, but reverting back to another version allowed us to escape this issue. To get around the overlapping memory issue, we simply changed the video height to not include the small section of the top video that existed in Video SRAM 2.

In our depth map output, we strangely encountered colored vertical bars on the right side of the screen. We believe this is caused by the depth map reaching the end of the video without finding a match, but were unable to identify the exact source of the issue. Given more time, we would have liked to further debug this issue.

Hardware Design

Circuit

In order to utilize 2 cameras, we used an NTSC video splitter designed for car backup cameras. This unit allows connections from up to 4 cameras for different angles on their car, or for NTSC security cameras. This worked perfectly for our application, because it allowed us to receive input from multiple cameras over the single NTSC port on the FPGA. We could then manually decode the video into the different streams based on their position in the overall 320x240 video. We soldered the tiny camera output plug to an NTSC cable jack to plug it into the splitter, then connected the output to the FPGA. To power both the cameras and the splitter, we soldered a DC barrel jack splitter cable so they could be powered off of one supply. Since they could all be powered at 12V but with relatively low current draw, this system worked well.

...

Figure 9: Hardware diagram

...

Figure 10: Picture of the hardware setup

3D glasses

...

Figure 11: 3D glasses

We used traditional 3D glasses from old 3D movies with the red and blue lenses.

3D printed mount

...

Figure 12: CAD of the camera mount

We designed a custom mount for the cameras to hold the cameras steady, and tune them to a specific focal length by carefully adjusting the angling and spacing. We started by separating them about eye width apart and angling them to about a foot and a half focal length. From there we found that a decreased focal length and tighter spacing improved the illusion of 3D in the anaglyph image.

We chose to 3D print the mount so we could precisely match the mounting holes on the camera and create a slider bar to adjust the cameras in each of the degrees of freedom we needed. Although there are other good ways to create a mount like this (Bruce suggested a nice one using a sheet of aluminum), we enjoyed 3D printing and thought this was a good application of it. Also, mounting the cameras to a box enclosure made the setup much more secure and prevented the cameras from moving around. This was especially useful when fine tuning the angles and distances, since we wanted these to be relatively precise.

Though the cameras we used became rather hot after being plugged in for a while, its performance was not noticeably impacted. We originally attached heat sinks to the back of the cameras, but unfortunately they did not fit in the mount.

Hardware Utilization

...

Figure 13: Hardware Utilization

Figure 13 illustrates the hardware usage of the FPGA. Because the Video In subsystem utilizes XY mode addressing, the total memory size comes out to a total of 131,072 bytes rather than the 76,800 bytes that would be required by continuous mode. The depth map and anaglyph processed images also each had memories of size 76,800. This resulted in a total of 284,672 bytes of memory. Had we been more constrained by hardware on the FPGA, after finalizing our video dimensions we could have reduced the size of the anaglyph and depth map images to be 165x100=16500 bytes. However, in our case this was not necessary.

Results

The final deliverable of our project was quite exciting as we were able to create a realistic 3D effect and display a depth map which displayed objects in different colors as we moved them towards and away from our cameras. Our main metric for success is that, once tuned, the output image provided an enhanced sense of depth and was convincing for multiple people.

Our second deliverable, the depth map, was also a success. We were able to distinguish and display 9 different levels of depth within the range limited by camera distortion on the close end, and resolution on the far end. These states show up reliably in tests with a controlled subject and background, and qualitatively perform well when we wave our hand through the camera view.

...

Figure 14: Scope timing

Regarding timing, the main requirement was for the video to be updated at at least 30FPS, which is a good lower limit for frame rate, such that the video still looks smooth to the human eye. As long our video output did not lag, then the requirements were met. We timed our performance by toggling a GPIO pin high on the FPGA when we started our initial read for the first row of image and then toggled it low after writing the last pixel to VGA memory. We then measured the positive width of this pulse on an oscilloscope. Our anaglyph video and depth map are displayed in 3.2 ms, which gives us around 312 frames per second. While this is around 10 times faster than required, it is important to note that our output video dimensions are 165x100, which is significantly smaller than most screens. For context, we could scale up our video dimensions in X and Y by a factor of 3.2 each to get a size of 528x320 and still maintain at least 30 fps, since the frame rate decreases linearly with both X and Y dimensions.

Our project does not require much direct human interaction with any hardware, since users will mainly just be observing the anaglyph 3D image outputted to a screen or projector. Therefore, we do not have many safety considerations regarding hardware.

In addition, our project does not have any government regulations to abide by. We do, however, hope to have a societal impact by providing an interactive and exciting experience for the user. We also hope to demonstrate an interesting parallel between how humans see and the 3D view we display. While these will obviously not be identical, the process of perceiving depth through two different views of the same scene is a commonality between human vision and our project. The main concern is our project's usability for color blind people, since the 3D effect relies on the manipulation of color in the image. We are unsure of the extent to which colorblindness impacts the appearance of the image, but we hope that it would still look interesting despite the less distinct 3D effect. Also, people that have stereo blindness are not able to merge the images perceived by their left and right eyes, and therefore would not be able to see the 3D.

... ... ...

Figure 15: Depth map and Anglyph 3D image output

Conclusion

As previously mentioned, we entered the project with very minimal knowledge about stereo cameras, anaglyph images or depth maps. As a result, we spent a significant amount of time researching these areas to find effective but time efficient methods for implementing them since the timeline for this project was only 5 weeks. We went through several iterations of code and relied on the ModelSim software heavily to help test, as compiling large projects for the FPGA takes a considerable length of time. Overall we are very pleased with the final outcome as we were able to create a convincing 3D effect and display a depth-map of the image at a fairly impressive rate.

We based our code on an example from the course website (VGA display of video input using a bus_master to copy input image). We also utilized the custom VGA driver provided from the course website. The rest of our code was designed and written ourselves.

Appendix

Appendix A: permissions

The group approves this report for inclusion on the course website.

The group approves the video for inclusion on the course youtube channel.

Appendix B: Additional Figures

...

This shows the waveforms for our depth map module simulated in Modelsim. We utilized these waveforms to ensure that pixel_fixed_array and pixel_sliding_array were both being updated correctly, and that the depth map module was correctly toggling its done flag.

... ... ...

Qsys PIO declarations

...

Qsys Video In Subsystem

... ...

Video In SRAM

Appendix C: Division of Labor

Emmi- camera mount CAD, flow charts, led programing, Qsys reconfiguration, helping with timing measurements

Jack- 3D printing, soldering splitter and plugs, peer programming and debugging, website

Eric- peer programming verilog, C code front end, contributed to depth map implementation, measuring dimensions for CAD after messing up the first time, helped with timing measurements

Appendix D: Commented Code