ECE 5760: Advanced Microcontroller Design and System-on-Chip
Final Project: Fourier Drawing
Yibo Yang (yy796), Brian Hsu (hh543), Jasmin An (ja499)
1. Introduction
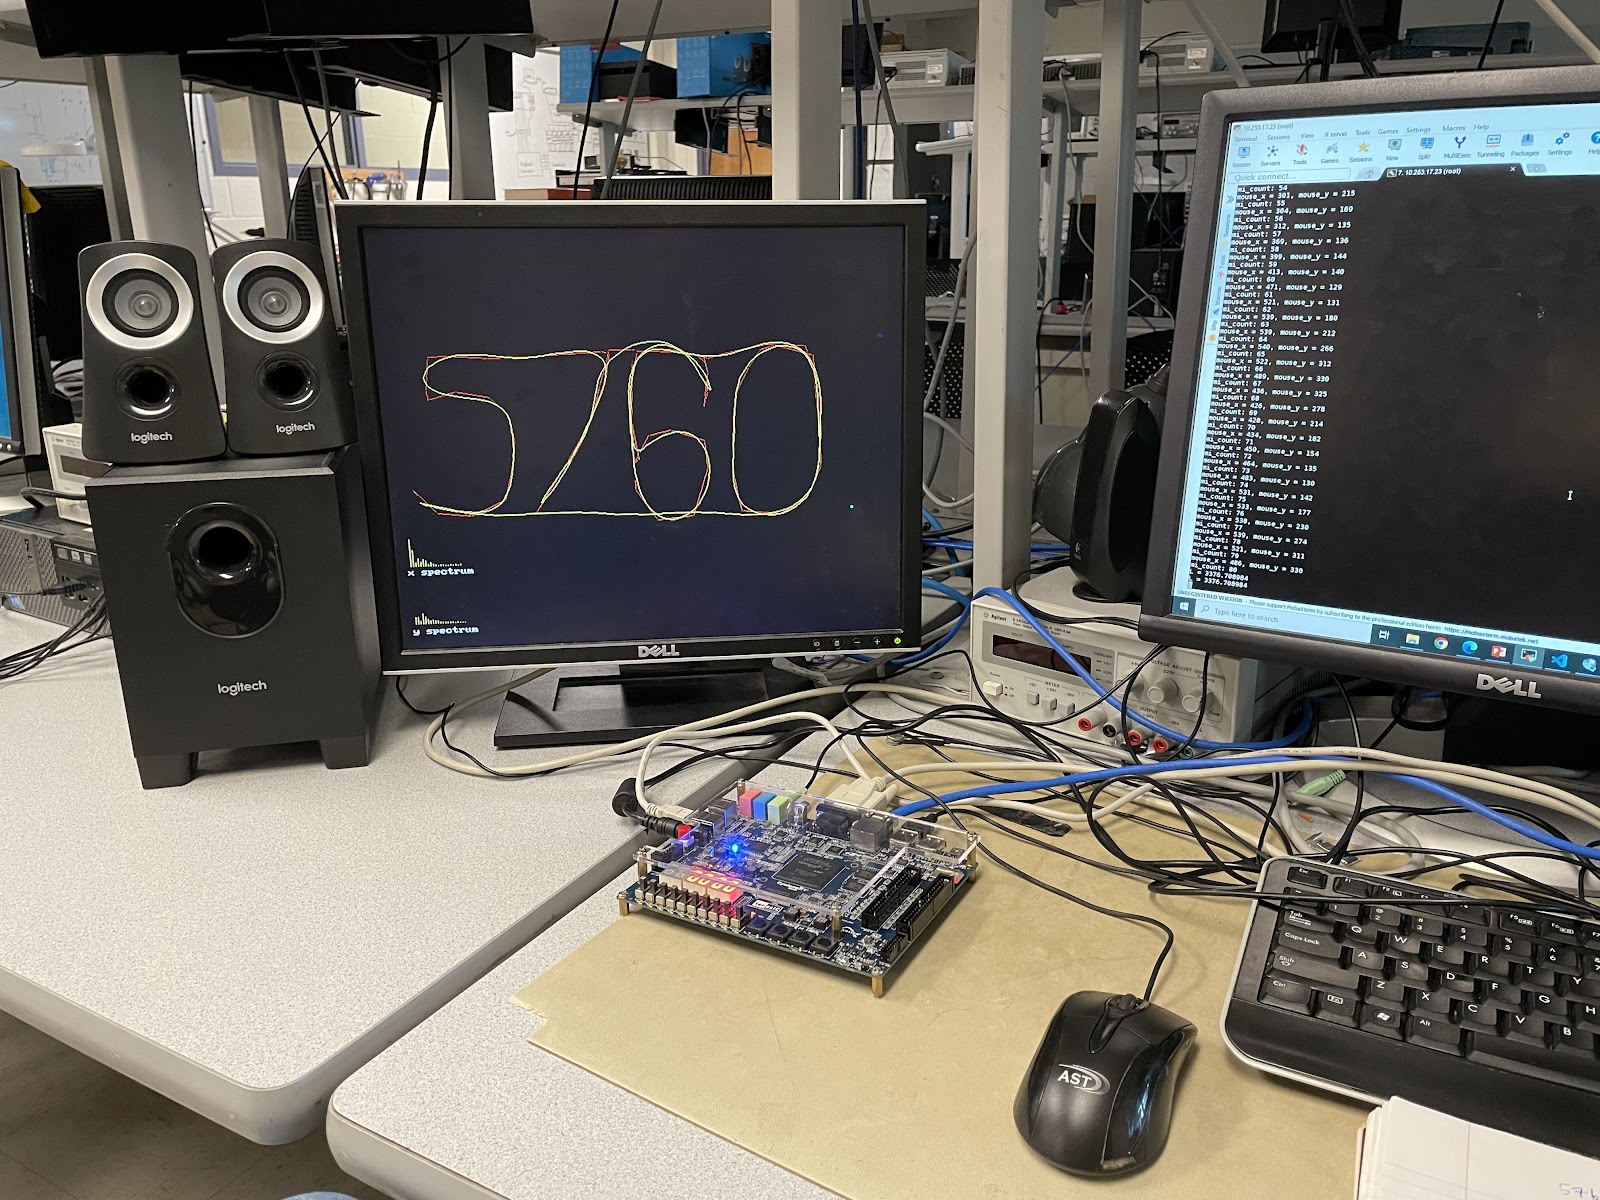
In this project, we aim to use the Fourier analysis and synthesis to redraw a user-input image on the VGA and play the sound of the image. The Fourier analysis and synthesis derive a harmonic wave equation that approximates the user-input image when its coordinates are given in sequence. Once the equation is calculated, the system redraws the image on the VGA and outputs the sound of the image. Also, we provide various features, such as redrawing the next image, morphing the current image to another image, and changing the amplitude of a specific frequency in the harmonic equation. We provide the VGA, mouse, and SSH terminal as the user interface and output the reproduced image on the same VGA and the sound using the speaker. We first started by implementing the Fourier analysis and synthesis algorithms in C and setting up the entire system, including the audio system and user interface as shown in Figure 1. Then we implemented the synthesis algorithm on the FPGA to accelerate it using parallelism. Here is the Youtube link of the demo video.
Fig.1. Overall system.
2. High Level Design
2.1. Rationale
We are inspired by this video [1]. The math involved with the Fourier drawing has repetitiveness, which presents some possibility of parallelism and modularity. We believed that implementing these on the FPGA would make good use of the FPGA. Also, we included several user interfaces to make the user experience better. We added the audio feature because we thought it could be interesting to listen to what an image sounds like and to experiment with the audio system.
2.2. Background Math: Fourier Analysis and Synthesis
The big picture of the Fourier Series says that any repetitive sequence can be constructed by a linear combination of weighted (which are the coefficients) sinusoidal functions and vice versa. The equations that describe the Fourier Series are split into 1) the analysis equation which outputs the coefficients given a signal 2) the synthesis function that (re-)constructs the signal given the coefficients.
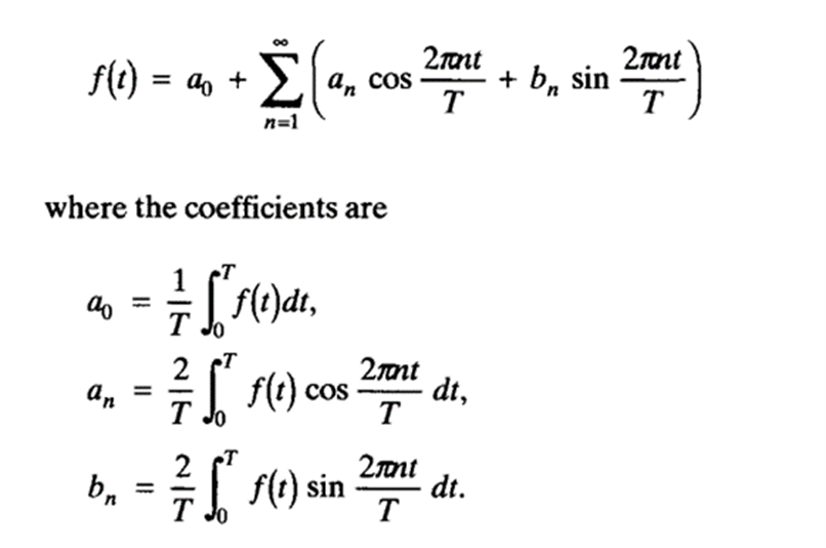
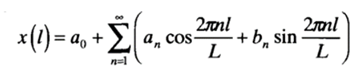
Our project focuses on drawing closed-boundary curves (i.e. a connected sequence of points with the same last and first point). This means that an enclosed curve is a spatial function that’s periodic in both the x and y dimension. The Fourier series equation below is the 1 dimensional (i.e. 2D is just using the 1D equation in both dimensions) analysis and synthesis equation as a function of time. The coefficients tell us how much of a frequency is in the signal relative to other frequencies.
Fig.2. Analysis and Synthesis as Function of Time.
The idea of our system is to have a series of points defining a piecewise enclosed curve so it isn’t exactly intuitive how these equations can help us since the equations are based on time. The solution [4] is to convert the equation into functions of distance, which we will discuss in detail in the following section.
The assumption made for the transformation is to imagine there is a constant speed particle traversing the curve. We can therefore represent the period T as the distance divided by the velocity of the particle. The distance between two consecutive points can be computed via Pythagoras theorem.
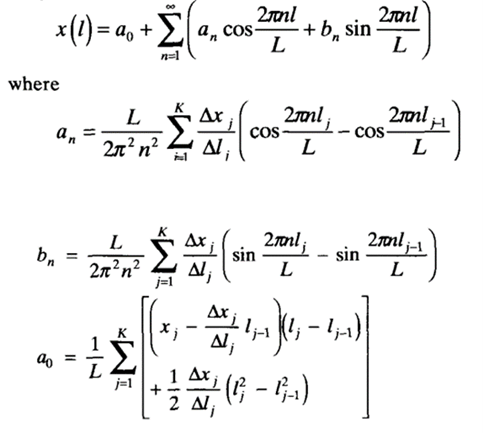
Fig.3. Analysis and Synthesis as Function of Length.
The detailed, step by step derivation is document in the paper but the final form equation that we implemented is shown in Figure 3. Essentially, if we imagine a particle traveling a distance l from the starting point, then the analysis and synthesis equations can be derived into functions of l, with lj being the accumulated length, L being the total length, Δl being the change in length between two points, and Δx being the change in x dimension (i.e. or y dimension).
One interesting characteristic to note is that by converting the discrete Fourier Series into a function of length, the function becomes continuous and therefore the analysis equation can produce as high of a frequency coefficient as we want, allowing us to perfectly replicate the drawing of the sequence of points provided.
2.3. Hardware/Software Tradeoffs
We initially implemented both the analysis and synthesis portions of the algorithm on the host using C. We integrated the user interface components – mouse and audio system – to have a working baseline design. However, the software-only design could not meet the timing constraint of the audio system, which will be discussed in greater detail in a later part of the report. The synthesis portion of the algorithm described above is largely composed of independent calculations, except for the last summation. Therefore, we parallelized the independent calculations on the FPGA. Also, we used simple lookup tables for computing the sine and cosine functions, which will help accelerate the calculation. However, implementation of each module that calculates one harmonic, phasor.sv, in the synthesis portion requires four multipliers. We use 4.23 fixed-point and there are two multiplications required for sine and cosine and their corresponding coefficients. We calculate the x and y coordinates separately, so there are four multipliers required to calculate for one harmonic. Since there are 82 multipliers, we can use up to 21 harmonics to represent the input image, which is controlled by th_harmonics in vga_to_FPGA_audio.c.
3. Program/hardware design
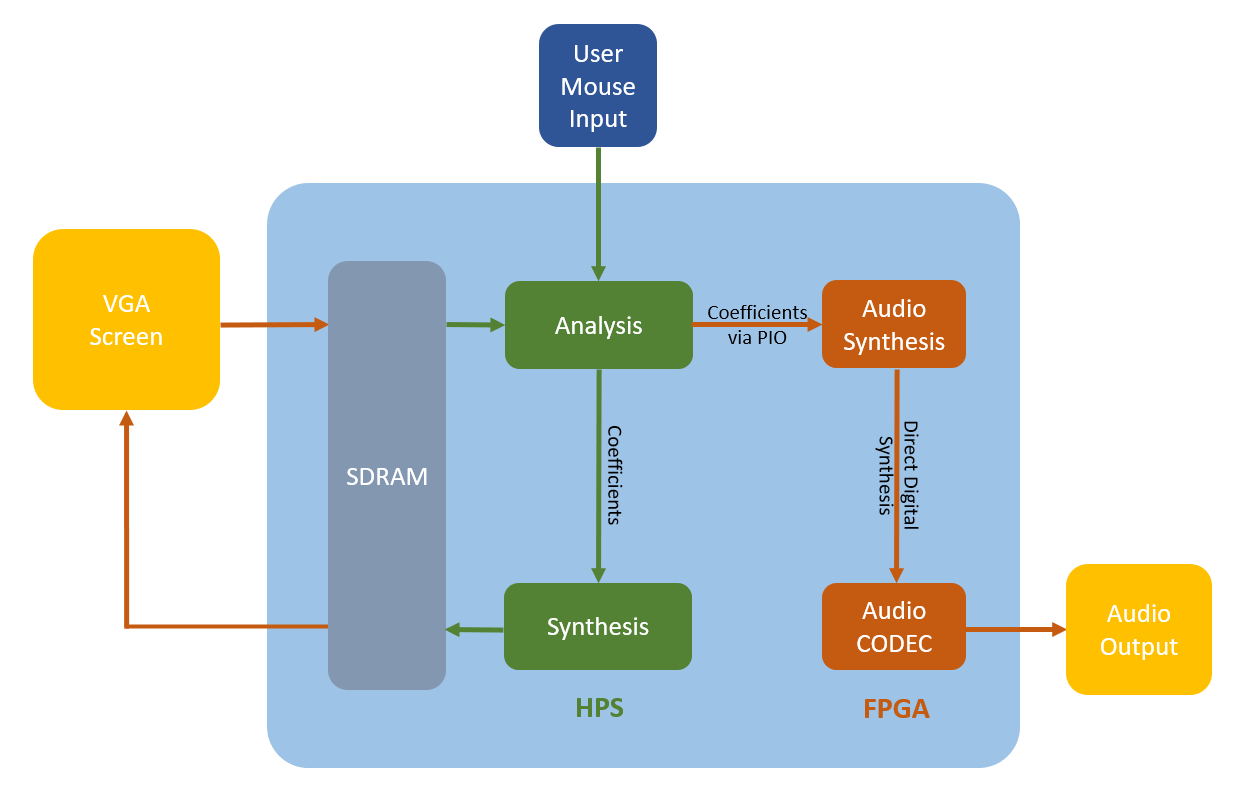
The system diagram is shown in Figure 4, and the Qsys layout is shown in Figure 5. The user click a few dots on VGA scream as input, which are analyzed by HPS to get the coefficients. Once the coefficients are calculated, they can be sent to FPGA to do audio synthesis and reconstruct the figure on HPS. The HPS interacts with the VGA screen via writing into the SDRAM, which VGA driver on the FPGA reads data from.
Fig.4. System Diagram.
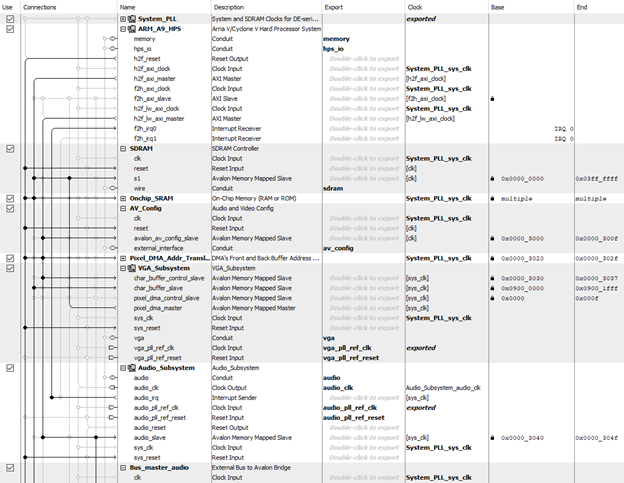
Fig.5. Qsys Layout.
3.1. Program Details
3.1.1. Mouse
We used the reference code given in [2] to enable the mouse input. We included a debouncing logic in order to count only one input when the button was pressed and held. This is important for our application since the number of clicks are set at compile time and their coordinates need to be sent in the exactly the same sequence for the Fourier analysis. Since the analysis requires the input image to be a closed loop, we automatically add a last point, which is a copy of the first point. Also, we added the drawing logic, which draws a line through the previous click to the current click to show the overall shape that the user is drawing.
3.1.2. Analysis
To obtain the coefficients, we implemented an analysis function in C that takes in an array of coordinates (i.e. collected by the mouse interface and stored in arrays), the size of the array of coordinates K, and the number of harmonics desired n. The implementation follows the equations mentioned in section 2 and returns an array of coefficient values organized as such: {a0, an, bn}. We observed here that the equation for analysis for x and y dimensions are actually mostly the same, as mentioned earlier the only change that needed to be made was replacing Δx with Δy in the coefficient equations. This can be accomplished by simply inverting the array inputs for x and y. The coefficients result are stored in float pointers (e.g. analysis_out_x_coeff) which are passed into the function as well.
Fig.6. Analysis Function Call.
With these coefficients we are able to draw/redraw the shape on the VGA screen using the synthesize equation as well as morph from one shape to another(we will talk more in section 3.1.4). The coefficients are also sent to the FPGA through PIO ports for audio synthesis which will be discussed in the next section.
3.1.3. PIO
The coefficients calculated by the analysis function on the host are sent to the FPGA for parallel synthesis via PIO ports. We define seven pio ports, i.e. pio_a, pio_b, pio_c, pio_d, pio_reset, pio_wr_en, and pio_wr_addr. We send the coefficients of the sine terms for the x coordinate via pio_a and the cosine terms via pio_b and similarly for pio_c and pio_d. Since we need to send as many coefficients as the number of harmonics for each of pio_a, pio_b, pio_c, and pio_d, we communicate with the FPGA using pio_reset, pio_wr_addr, and pio_wr_en. We notify that a new sequence of coefficients will be sent using pio_reset. The pio_wr_addr indicates the index of the coefficients in the sequence, and pio_wr_en is set for at least a cycle on the FPGA to notify the FPGA to read in the value. The FPGA sets the registers that saves the values from the pio ports to zero when the pio_reset is high. Otherwise, when the pio_wr_en is high, it will be saving the values from the pio_a, pio_b, pio_c, and pio_d ports to their respective registers. We noticed that sometimes the raw values are too small that we cannot hear well when output to the speaker. The SW[7:4] are used to control the loudness, which corresponds to 2^5 ~ 2^8 times the original loudness.
3.1.4. Draw
For drawing on the VGA, we connect the VGA subsystem to read from the SDRAM through direct memory access. We write to the SDRAM through the axi master and the VGA subsystem simply displays what is in memory. We obtain a pointer that points to the SDRAM base address, which is at 0xC000_0000, and fill in 8-bit color values with RGB color channels using the same predefined functions used in the Lorenz system.
To determine which pixels to color, we implemented the synthesis equation in C. As mentioned in the analysis section, the functions are continuous and therefore have an unlimited number of harmonics. As a result, we can redraw perfectly if we provide many coefficients. We decided to make the number of harmonics a definition in the C code so that we could observe the capabilities of the drawing with various harmonics.
Fig.7. Drawing Synthesis Formula.
To populate the memory, we define a length step that increments from zero to L, which represents a complete traversal of the enclosed curve. By keeping the time step small, we can use the VGA line function to connect the current point to the previous point and draw out the shape. We also display the spectrogram of both the x and y dimension. The magnitude is computed by taking the vector amplitude of each frequency.
We also implemented morphing in this project, which allows the user to draw two shapes and go from one shape to another. This is accomplished by performing analysis on both shapes and manipulating the total length L and coefficients such that the first shape slowly becomes the second shape. The way we do this is to compute a changing factor for each frequency (as well as L) by taking the difference of the amplitude of the spectrum, and dividing it by the number of iterations we want the morphing period to take. This linear approach was able to allow the shapes to morph seamlessly. Additionally, once we draw a shape we can modify the amplitude of a particular spectrum to see what the shape would look like if we introduced or took away a certain frequency component. We will display these functions visually in the results section.
3.2. Hardware Details
FPGA is mainly responsible for audio synthesis in this project. It performs pretty much the same as lab 2. I'll simply introduce this part of design in audio bus master state machine and audio synthesis separately.
3.2.1. Audio Bus Master State Machine
The state machine code comes from [3]. We disabled reading output from the audio codec, only letting the state machine to write values to both channel. Since the new value of our audio synthesis module can be updated in one cycle, we defined a audio_clk to only toggle after write to both channels are done.
3.2.2. Audio Synthesis
The audio synthesis module in FPGA uses the same formula for drawing synthesis, that is, the sound wave outputs of both channels is similar to the drawing values on X axis and Y axis. The differences are that 1. we don't need to include the offset during synthesis because it means nothing for audio; 2.we instantiate 42 copies of the sin/cos lookup table, 21 for each axis/channel, and the computaitons all go in parallel. The frequencies of the synthesized audio is calculated as follows: the 1st harmonic's corresponding frequency = 48000(samples/sec)/128(lookup table size) = 375Hz. All the frequencies are mapped in a linear manner: the 1st harmonic corresponds to the 375Hz sound, the 2nd harmonic corresponds to the 750Hz sound, ..., and the 21st harmonic corresponds to the 7875Hz sound. The amplitudes of different frequencies are determined by the coefficient values input from PIO ports. We used a 13.14 fixed point data type for intermediate calculations, but it didn't really matter as long as we don't lose the precision of the sin/cos lookup table and we can output audible sound from the audio codec.
Actually, it's nowhere near the limit of the FPGA's capability for audio synthesis right now. We only made all the computations in one cycle while in lab 2 we utilized most of the 1000 cycles between two samples. There are a few ways to go down and scale up the harmonics: 1.Try to use some algorithm similar to FFT, which saves multipliers used in each cycle while extending the latency; 2.Experiment on shrinking the data size for computation, the sound output might sound the same while saving space for more multipliers.
3.3. Reference Codes
We did not use any code that is involved with existing patents, copyrights, and trademarks.
3.4. Trial and Error
The biggest problem that we stuck for the longest time is trying to integrate the audio module into the project with the VGA subsystem. We started from HPS first, trying to read from the fifo status pointer and write audio maplitude values into the data channel pointers. We did a lot comparison between our malfunctioning project and the working example project, found a few differences and fixed all the them, but still couldn't make it work. Then we moved on to do audio synthesis on FPGA and use FPGA's audio bus master's interface.
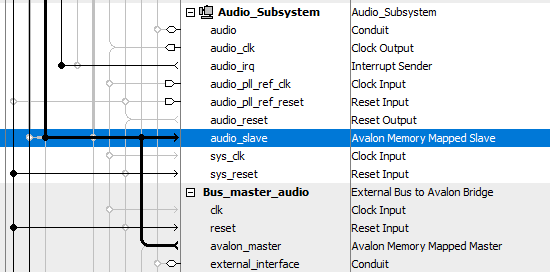
The second problem we met is something weird with the Qsys. Before instantiating the PIO ports, the audio worked just fine. But once we instantiated a few PIO ports, the audio module stopped to output sounds and the fifo is always full (monitored by SignalTapII). We checked the connections in Qsys carefully and found out that the data channel (avalon_master -> audio_slave) between the audio bus master and the audio subsystem was not connected. We guess that the Qsys did some automatic connections before we instantiated the PIO ports, and then stopped the automatic connect once we added the PIO ports. This is just too weird.
Fig.8. Missed Connection in Qsys(this line wasn't connected before).
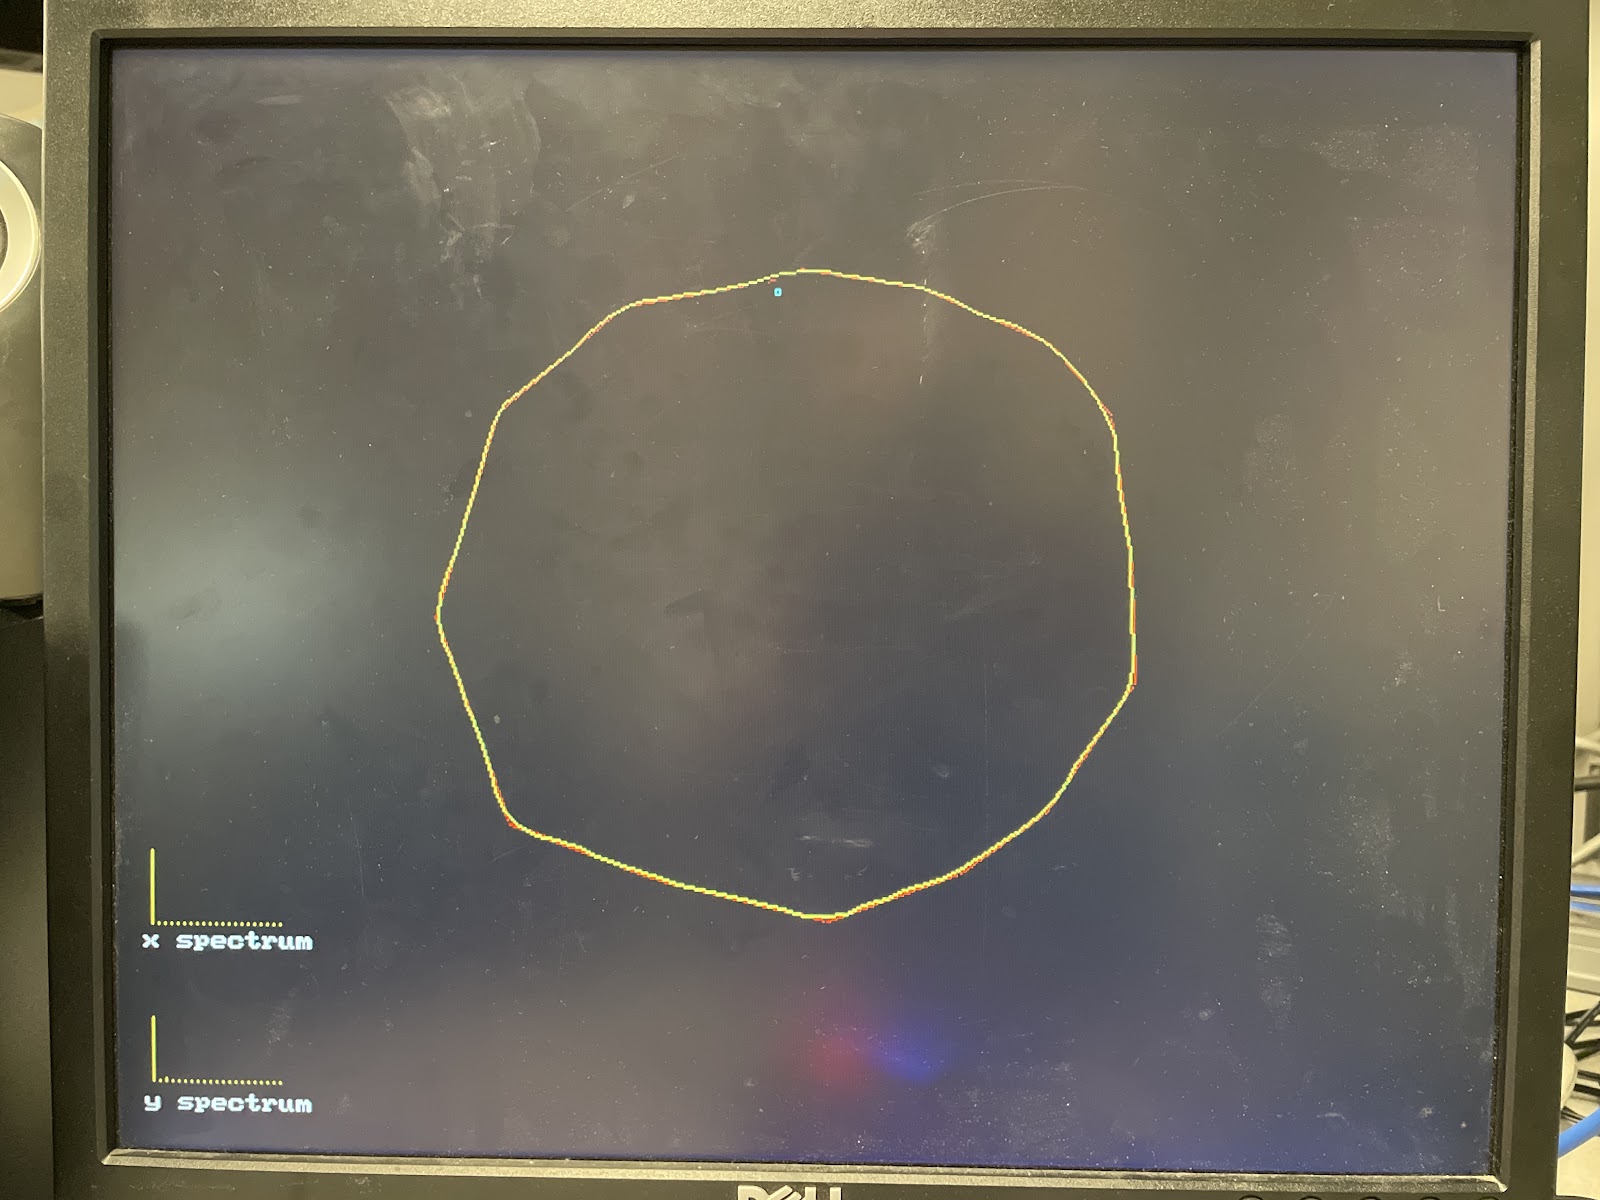
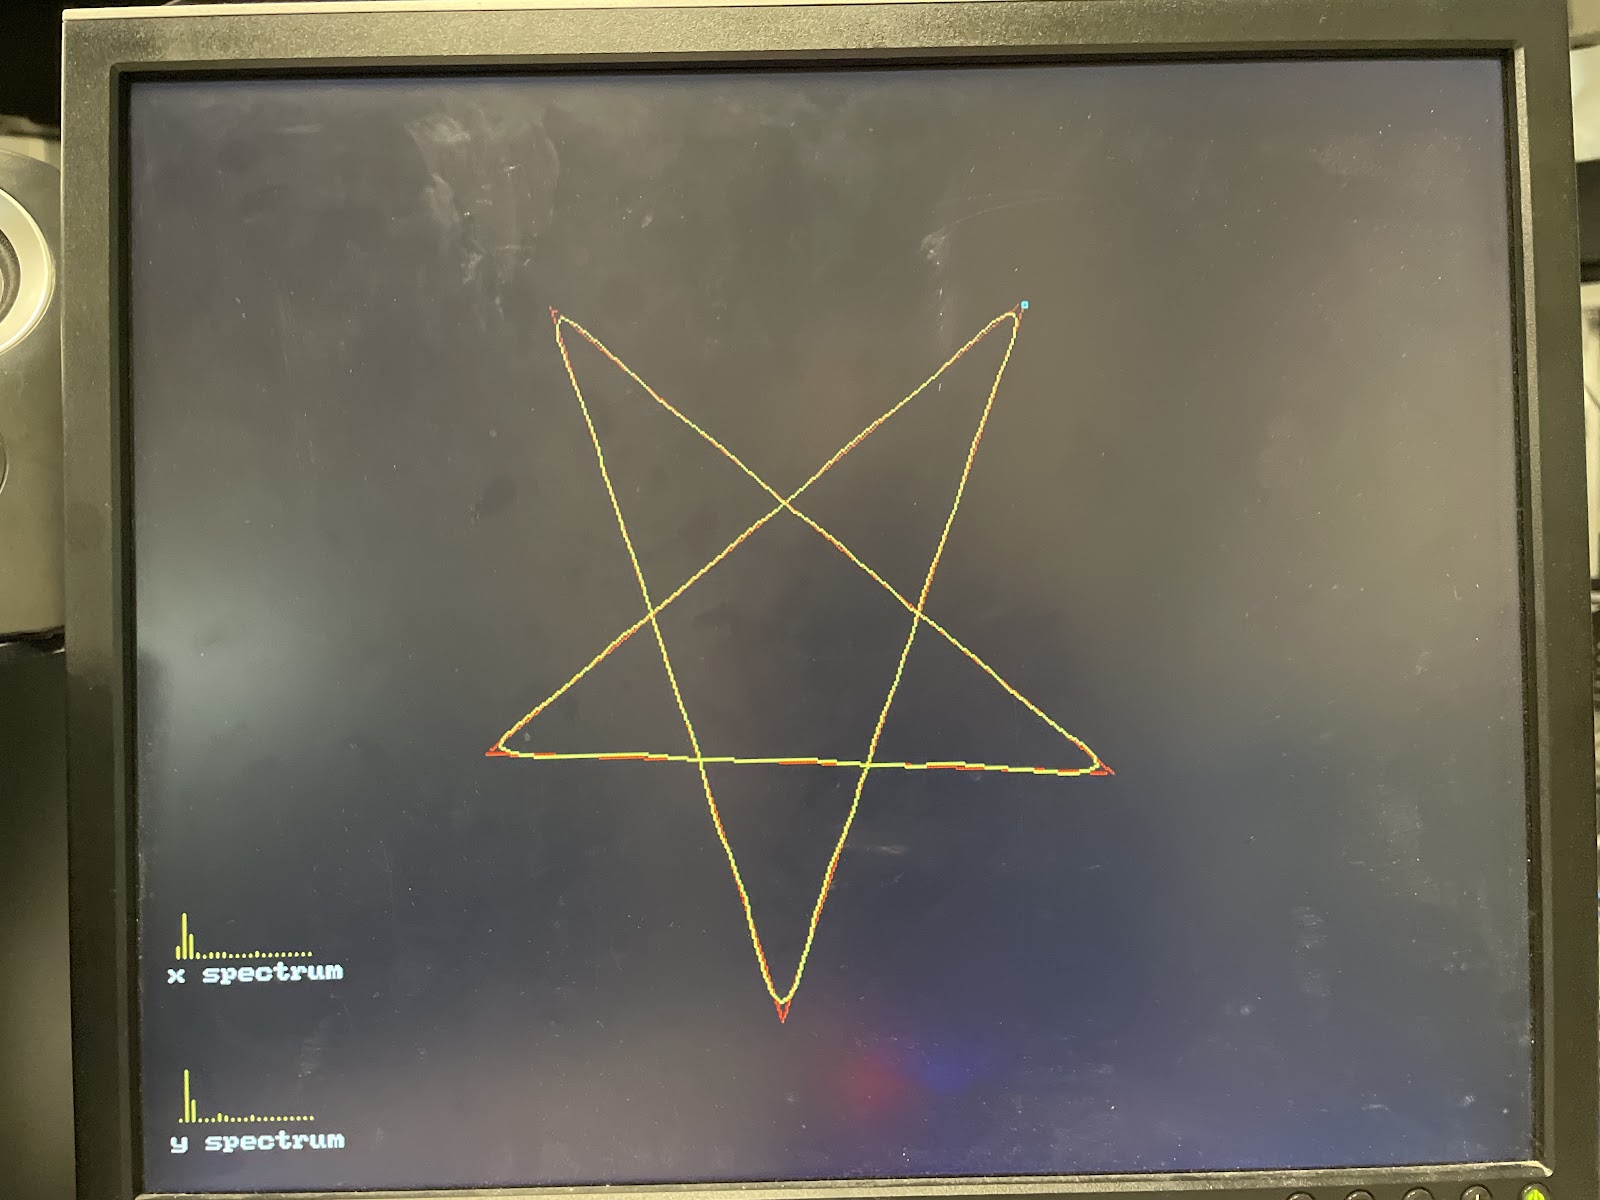
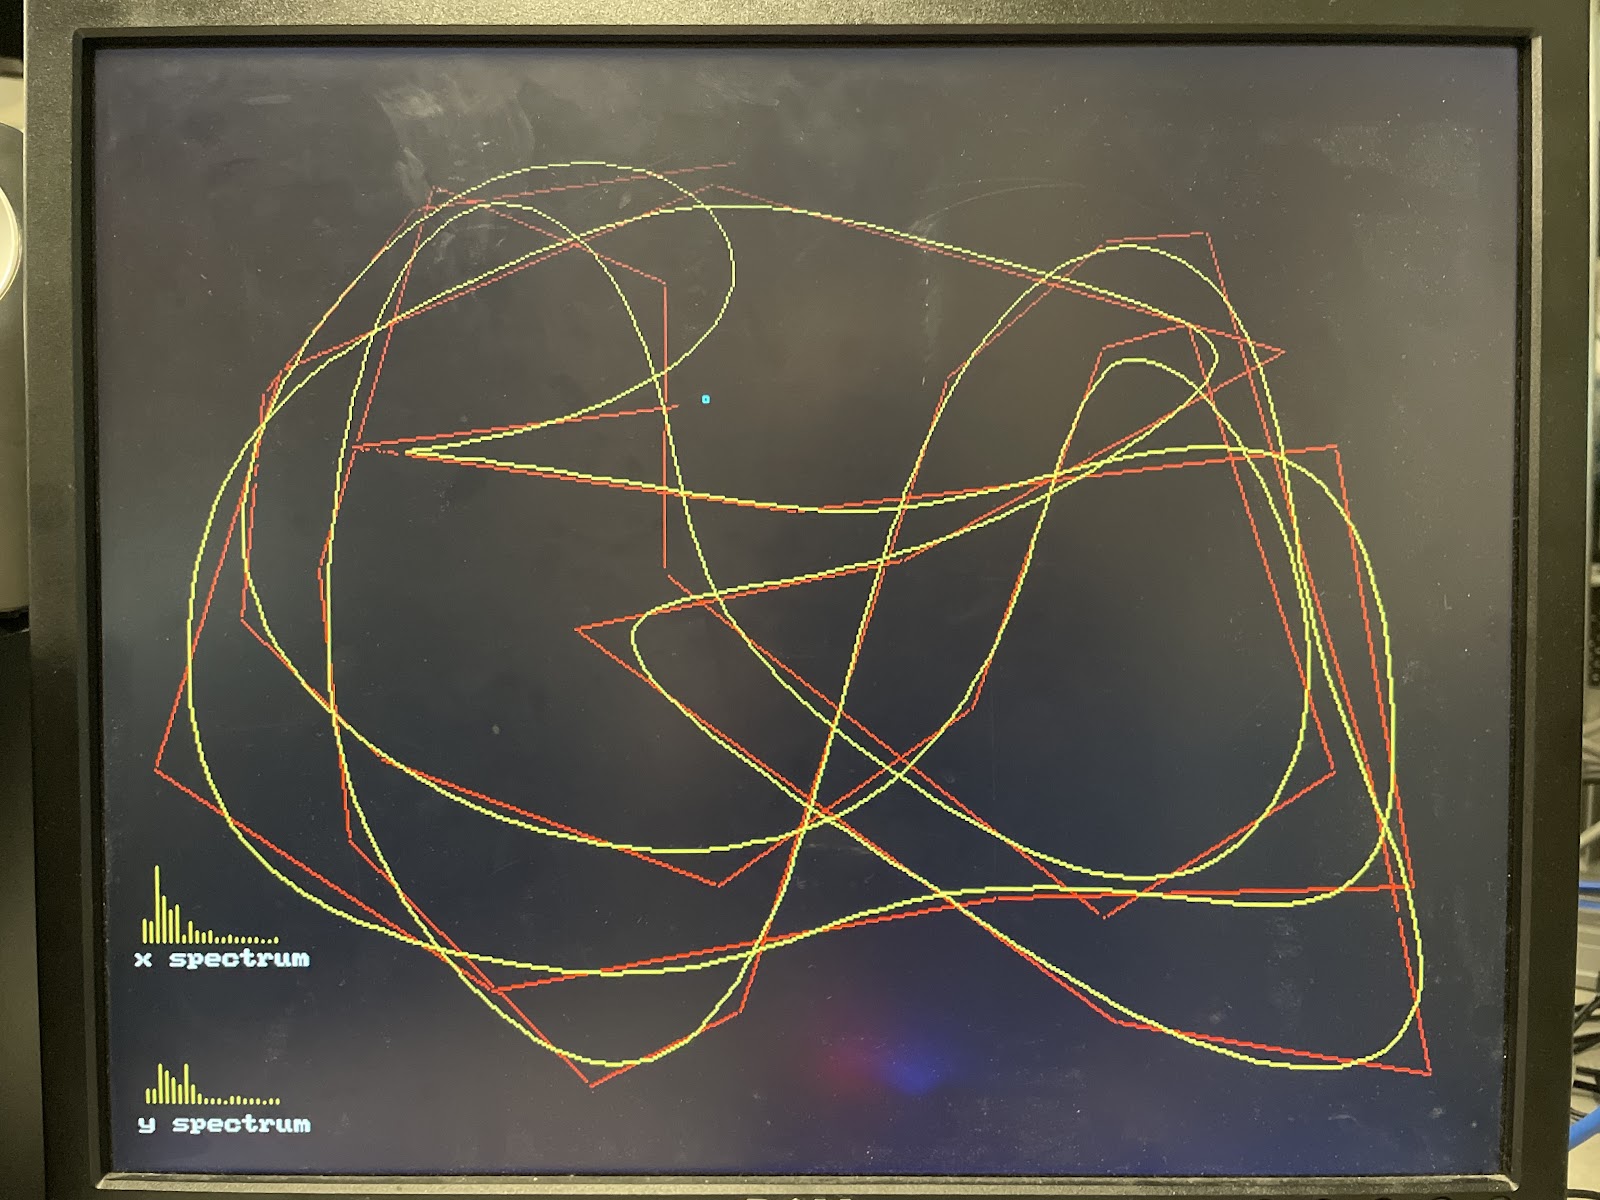
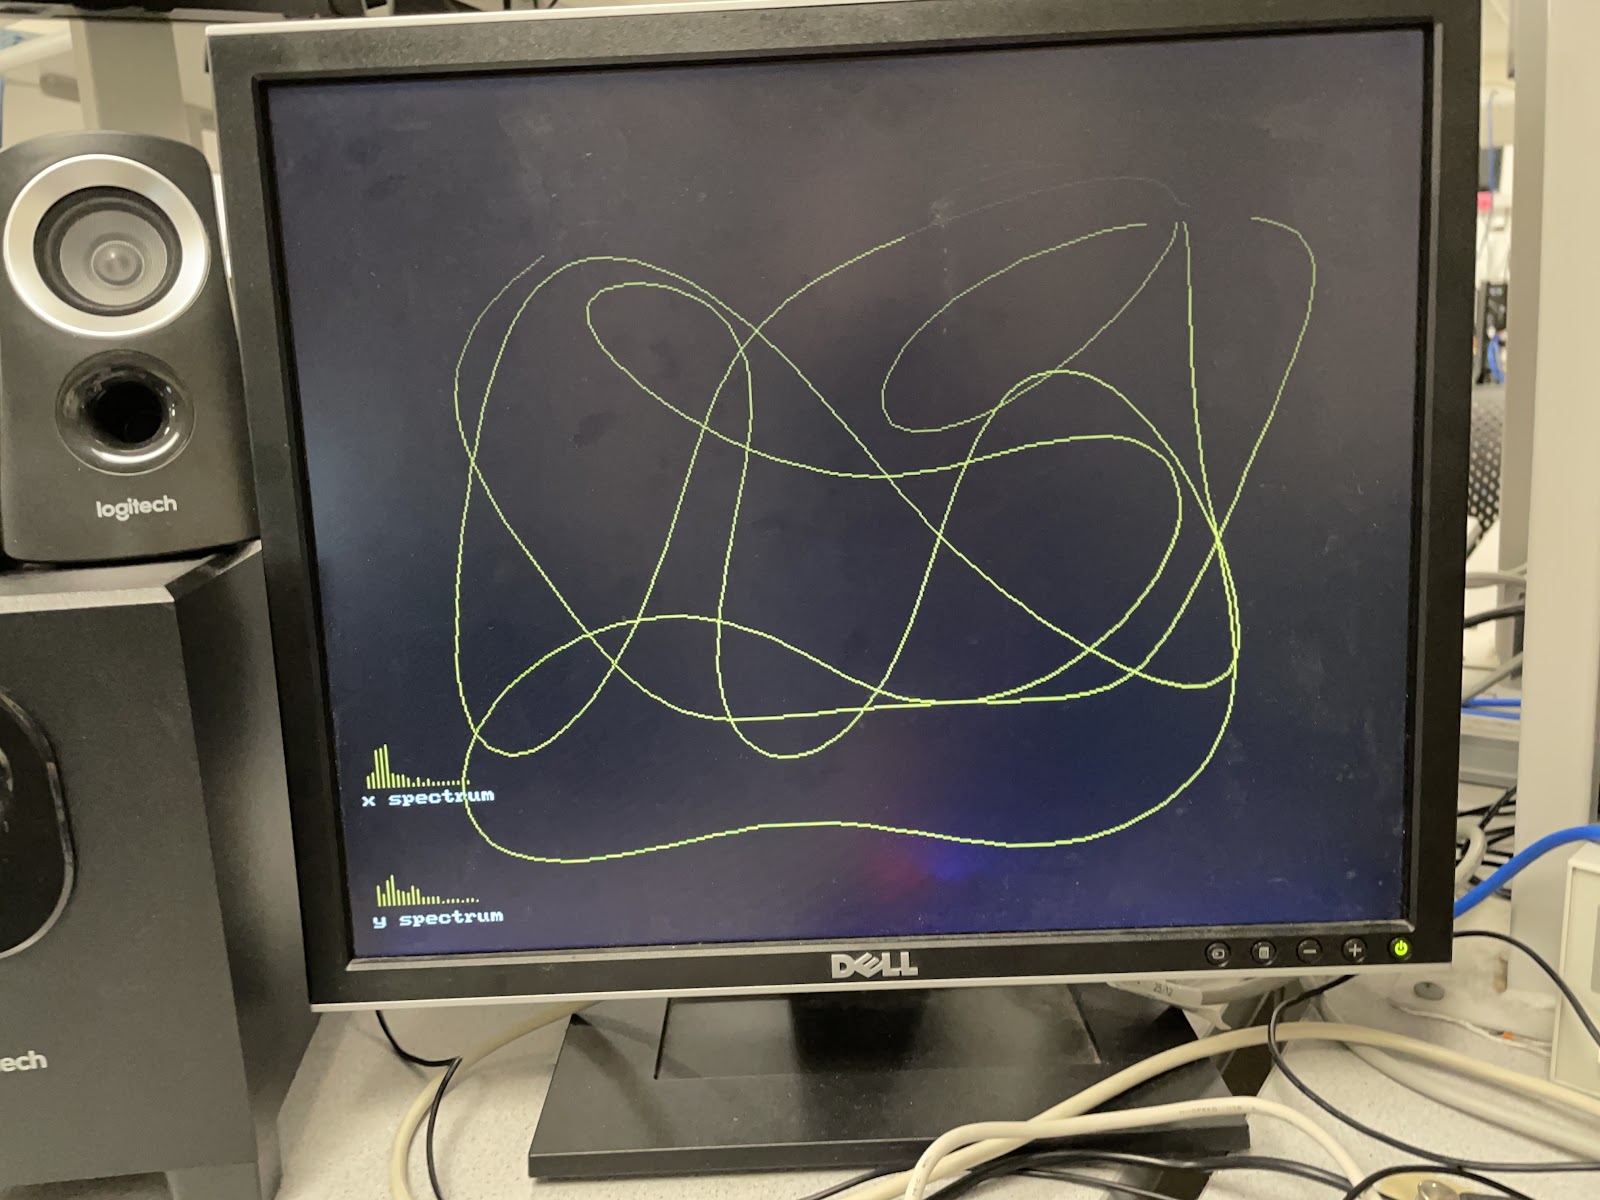
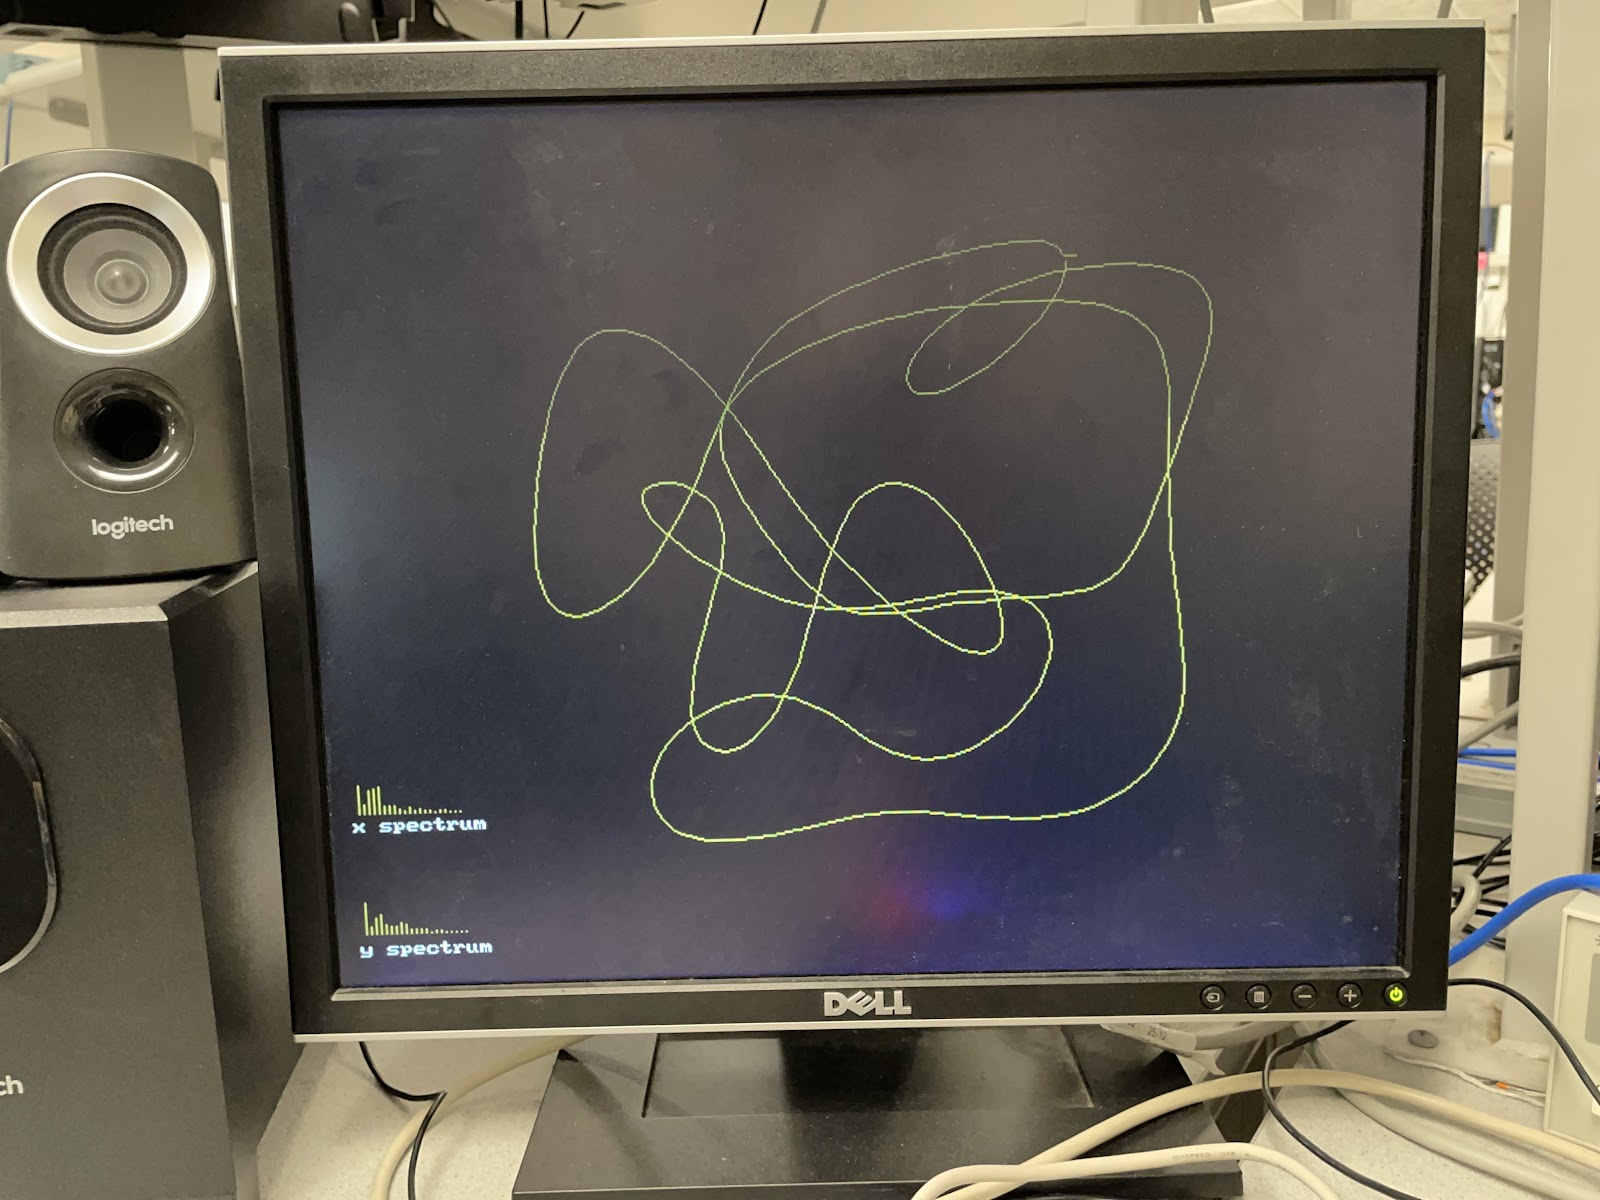
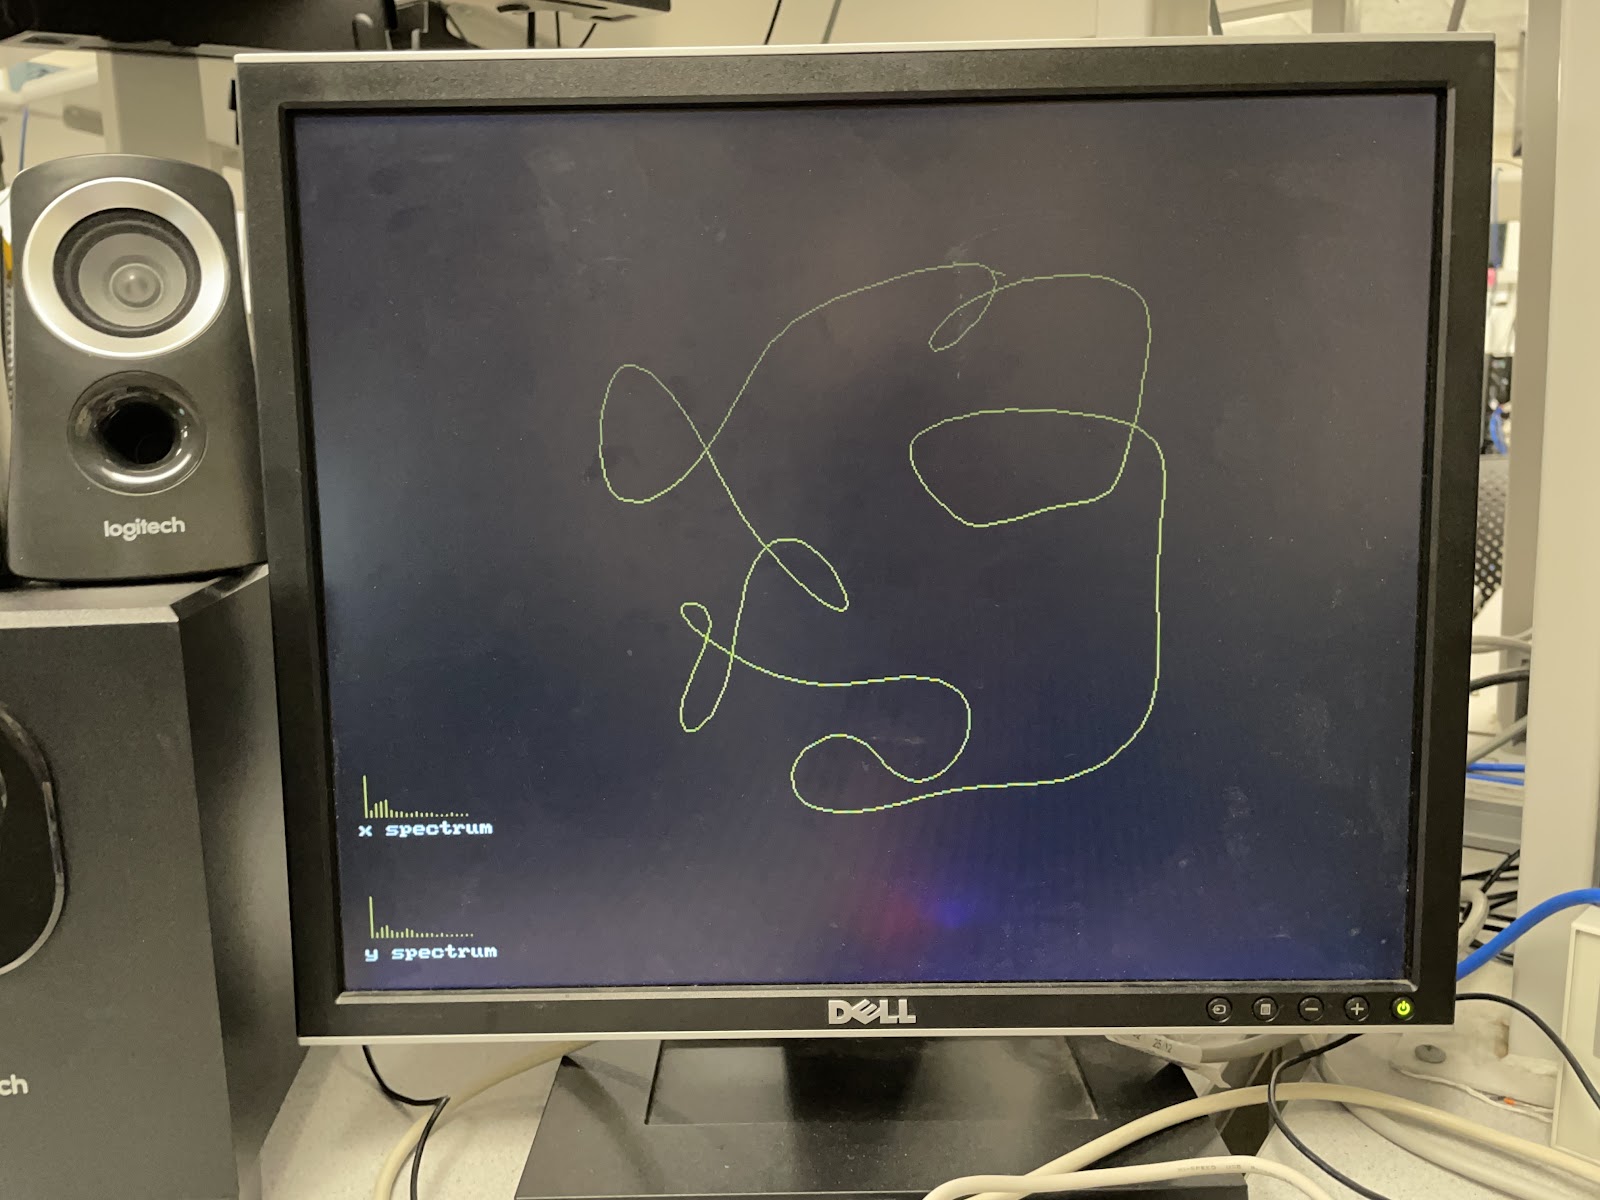
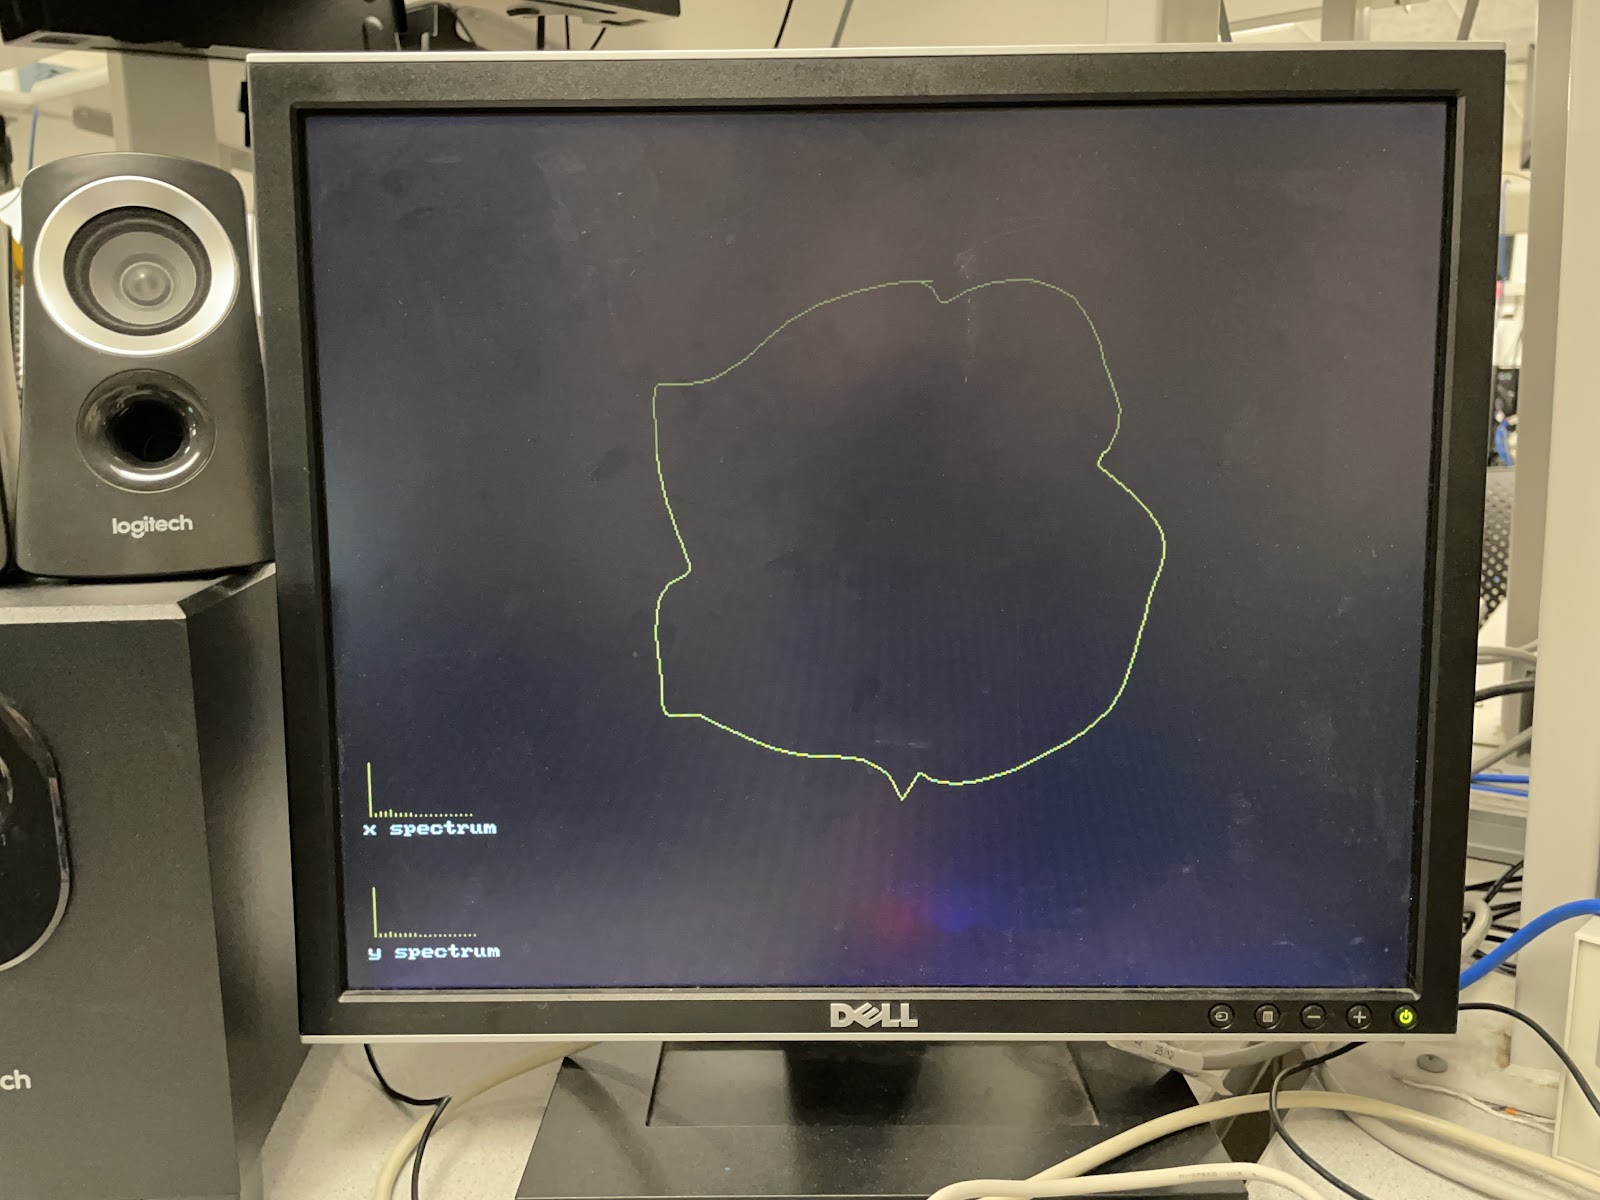
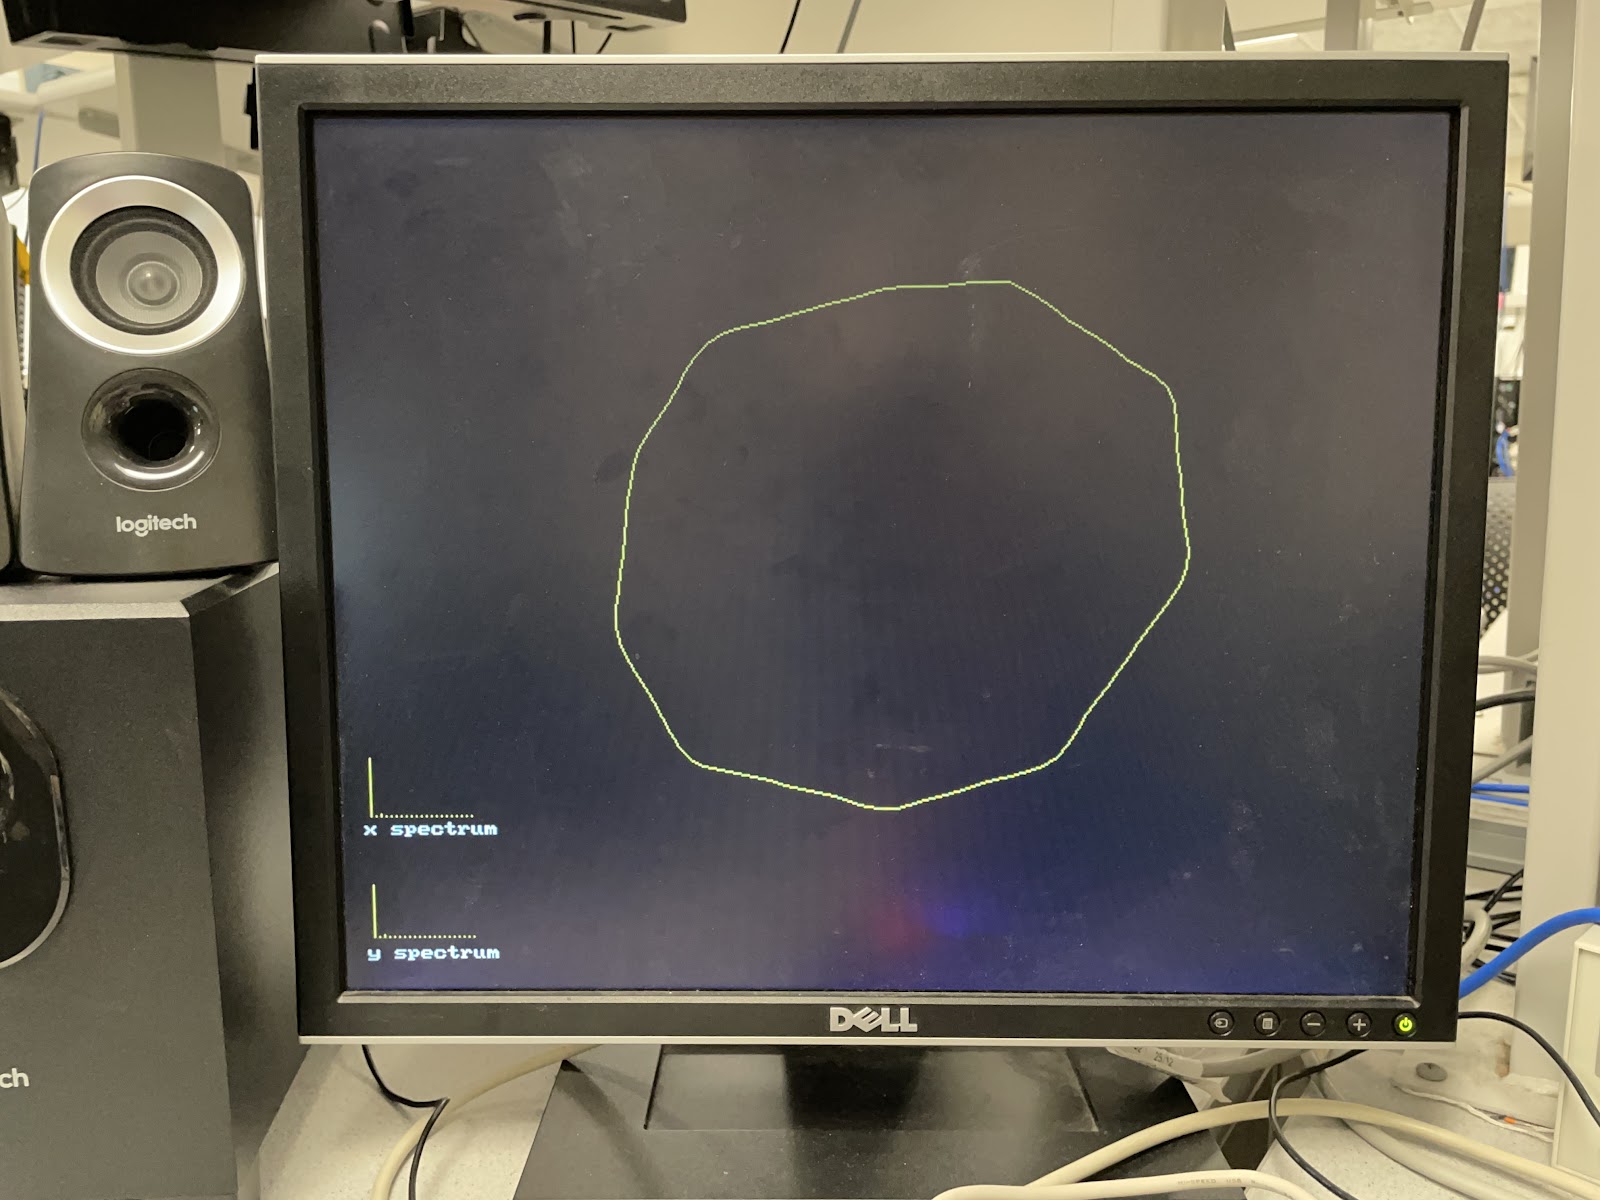
Table 1. Timing of the analysis and synthesis done on host for different kinds of input image. Note that 21 harmonics are used.
Note that synthesis is computed on both the host and FPGA because the audio system requires that the next value to output to the DAC is ready at 48 kHz, which gives approximately 20 uSec until the next value, whereas the VGA allows a lower rate of update. In order to meet this timing constraint, we implemented the synthesis part on the FPGA just for the audio system, i.e. synthesis is implemented both on the host for the VGA and in the FPGA for the audio. The synthesis state machine runs at 50 MHz, and using parallelism all the computations are finished within one cycle. Therefore, it is less than 0.02 uSec per synthesis on the FPGA, which is within the timing requirements for the audio system. In Table 1, we only have timings that combine the synthesis and output to VGA because it was difficult for us to measure without the VGA output. Despite this, the values are significantly larger than the audio system constraint, indicating that the synthesis implementation on the FPGA is much faster than that on the host.
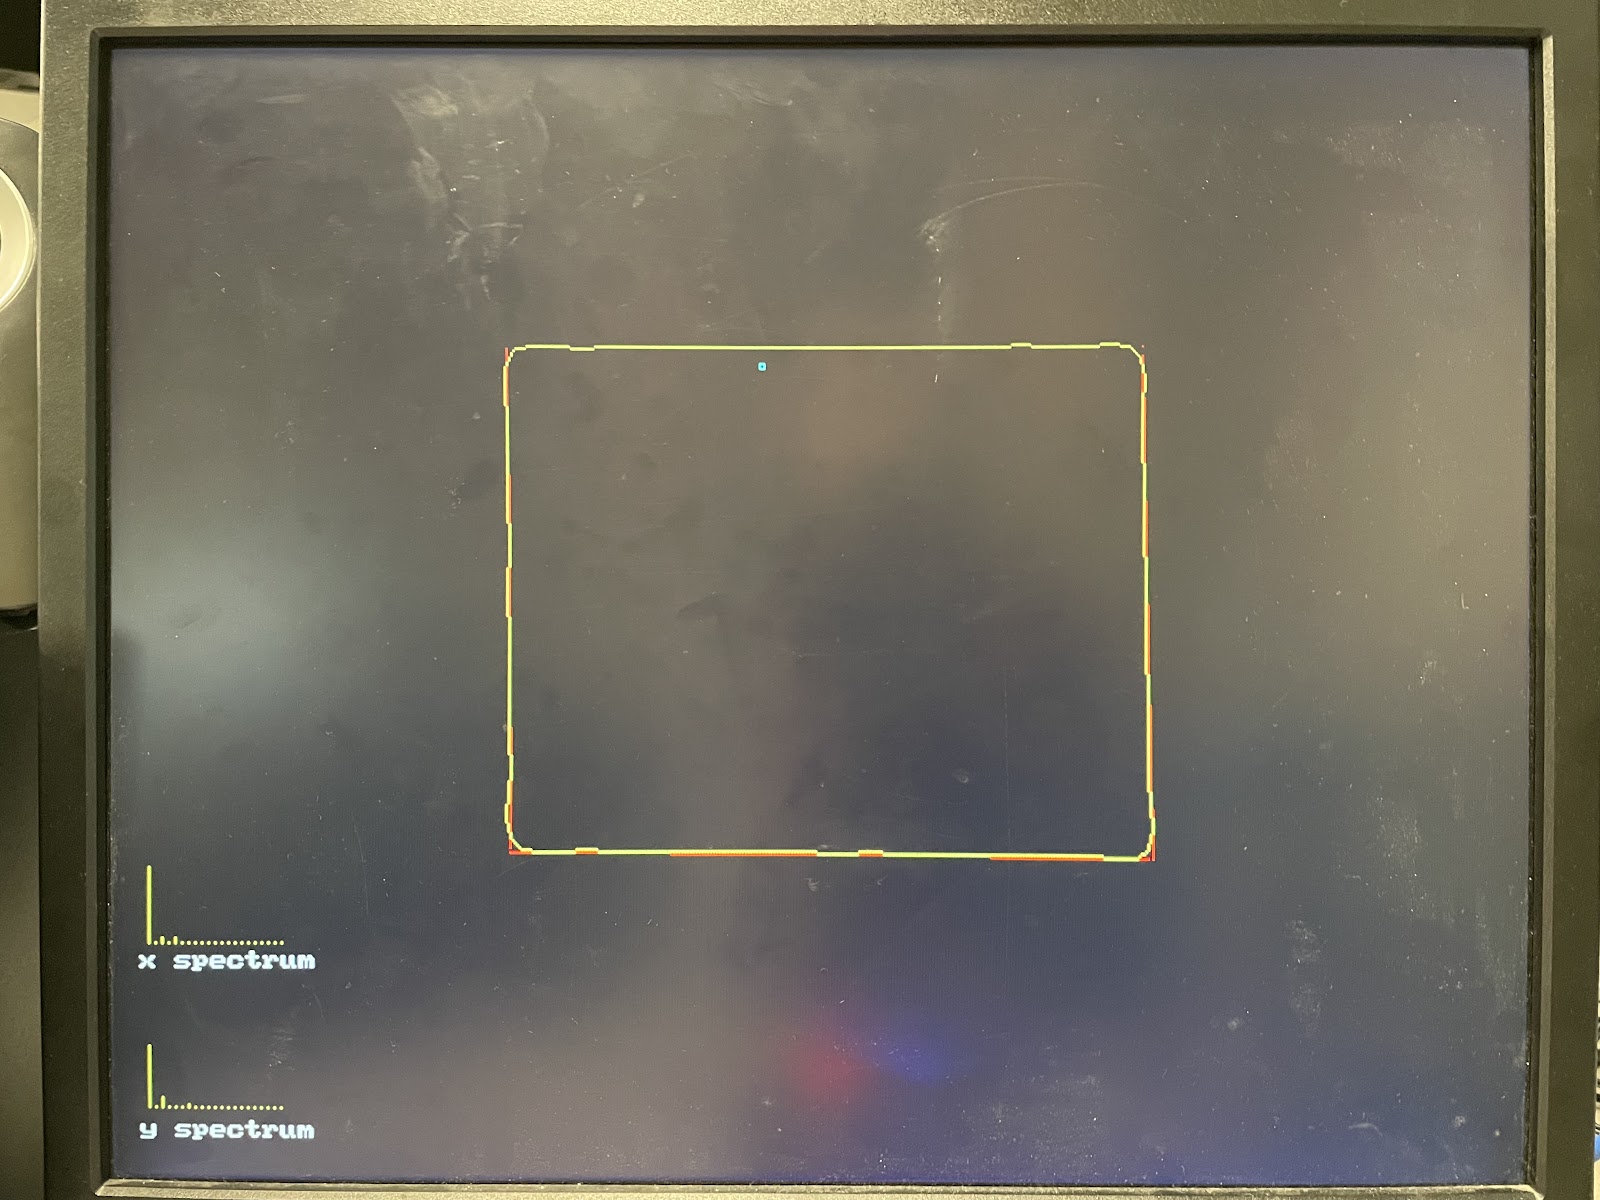
For our project, we define accuracy as how accurately the system redraws the input image. The first column in Table 1 shows that the accuracy decreases as the shape of the user input has increasing complexity and more sharp edges. This is expected as the Fourier drawing requires higher frequencies, or more harmonics, to successfully represent the details, as shown by the x and y spectrums in the lower left corners of the images.
In terms of usability, we provide several features that we found to be useful when we were testing our system. Table 2 is the list of the user interface features that our system provides. Also, we included some interesting visual features. For instance, when we morph the image, we show the progress of morphing both on the VGA and sound, as shown in Figure 9.
To input user image on the VGA; the number of clicks can be changed in the host code; automatically makes a closed image
Mouse right click
To stop clicking before the number of clicks is reached; automatically makes a closed image
Redraw input image
‘r’ in SSH terminal
Morph current image to a different image
‘m’ in SSH terminal
Change the amplitude of a harmonic
‘c’ in SSH terminal
Table 2. Table for features
Fig.9. Morphing.
5. Conclusions
This project had many different ways to be implemented and applied. Initially, we were planning to use two sets of VGA and FPGA and experiment how the noise during transmission will affect the Fourier drawing in the second set. We planned to use the sound signal as the transmission mechanism, so after analyzing and synthesizing the input image using the first set of VGA and FPGA, we would output the sound to the second set. If we could make this system real-time, then we would be able to see interesting visual effects that the noise added to the transmitted sound. Also, this could lead to interesting applications, such as the changes that a person’s voice could have on the transmitted sound could be different from that of another person. Although we couldn’t get this far due to the deadline, we believe this can be an interesting application of our project. We have used some of the codes from the course website as our reference codes, and our code is publicly available through Github. Our idea comes from various sources, including Youtube videos and 5760 professors, but they do not require intellectual property considerations.
6. Appendix A
The group approves this report for inclusion on the course website. The group approves the video for inclusion on the course Youtube channel.
7. Additional Appendices
[1] Fourier series drawing. https://youtu.be/r6sGWTCMz2k
[2] The course website: https://people.ece.cornell.edu/land/courses/ece5760/
[3] Audio bus master state machine example: https://people.ece.cornell.edu/land/courses/ece5760/DE1_SOC/HPS_peripherials/DSP_index.html
[4] An Algebra of Geometric Shapes. https://ieeexplore.ieee.org/document/