Spring Oscillators
This program aims to numerically solve for the displacement of a mass-spring system, a simple harmonic oscillator, in 2-D. A harmonic oscillator is a system in which the mass, m, is displaced from its equilibrium position, and experiences a restoring force F proportional to the displacement and the spring constant, k, according to Hooke’s Law, which is stated below in the table of equations. An animation from Wikipedia is shown below:

In two dimensions, each dimension is treated independently, and Hooke’s Law in each dimension gets treated independently. To solve for the displacement in each dimension, x and y, Newton’s second law is employed with a delta time, dT, of 0.1. Since, the displacement is solved in 2-D the harmonic oscillator needs to be started with an initial displacement, ix, at an angle, theta. The table of equations is given below.

The spring-mass oscillator code accepts the following parameters: the spring constant (k), the mass (m), the initial displacement (ix), and the angle of initial displacement (theta) measure in radians. The figure below shows the results for the arguments [100, 1, 1, pi/3] for 100 units of time.
Another interesting problem is the coupled oscillator problem in 1-D. In this scenario, two masses are attached in between by a spring, and this system is attached by two springs to a fixed wall. Energy is transferred between these two oscillators. Analytically, the equations to solve this system can be rather cumbersome, but using Hooke’s and Newton’s laws, one can solve this system numerically. The system of coupled oscillators can be considered as two identical free oscillators that are mutually coupled. This system leads to the resulting differential equations:


The above equations can be difficult to solve. However, using the concept of a simple harmonic oscillator, the equations in the table below can be derived. The subscript 1 and 2 correspond to the two individual oscillator system coupled together.
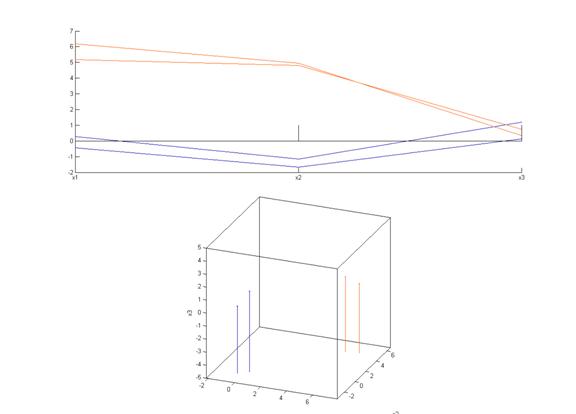
The coupled oscillator code was run with the following parameters: the masses (m1, m2), the spring constants (k1, k2, k3), and the initial displacements (x1, x2). The figure below shows the displacement of both oscillators using the parameters [1, 1, 50, 66, 50, 40, -40]. This can be verified using this coupled oscillator applet.
Lorenz Attractor and Julia Set Fractal
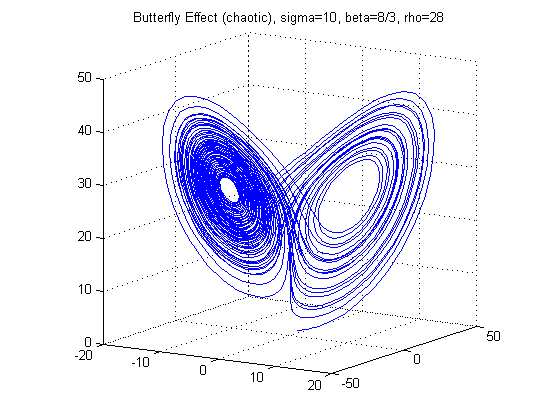
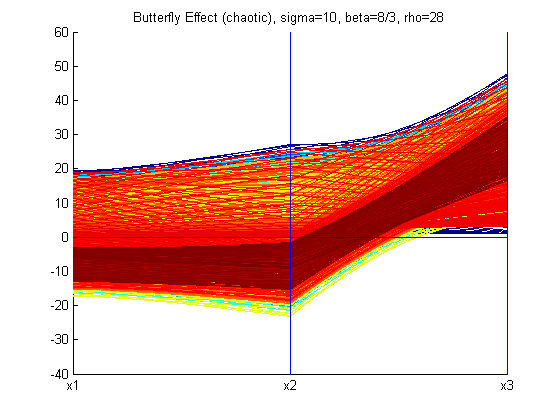
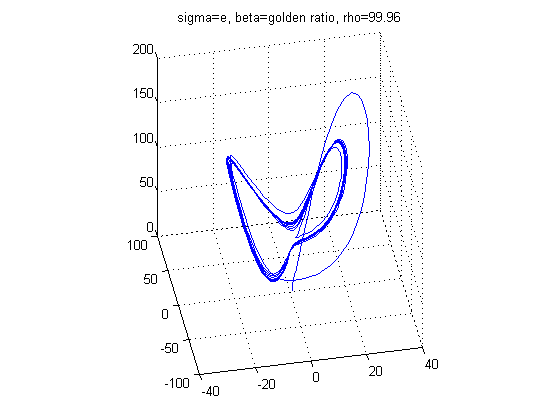
The Lorenz Attractor was introduced by Edward Lorenz in 1963. It is a nonlinear, 3-D, and deterministic system. It is noted for its butterfly shape and it is known for its chaotic flow behavior. It is a dynamical system which evolves in a non-repeating pattern. The Lorenz Attractor is a good example of a dynamical system that should be graphed in parallel coordinates to visualize its properties. The Lorenz Attractor is given by the following equations:


With different values of σ, ρ, and β the structure of the Lorenz Attractor can be controlled and interesting patterns such as a torus, T (3,2), can be plotted both in Cartesian coordinates and parallel coordinates. The code for Lorenz Attractor requires solving a non-stiff differential equation. The differential equation is solved using the two Matlab scripts - lorenz.m and sol.m. The figures below show the Lorenz Attractor for various values of σ, ρ, and β in Cartesian coordinates, and parallel coordinates with the start point (1, 1, 1).
 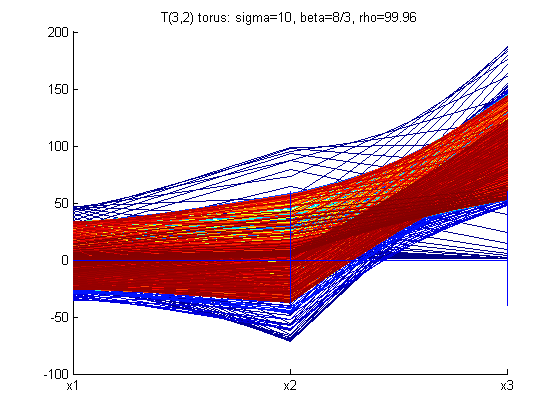
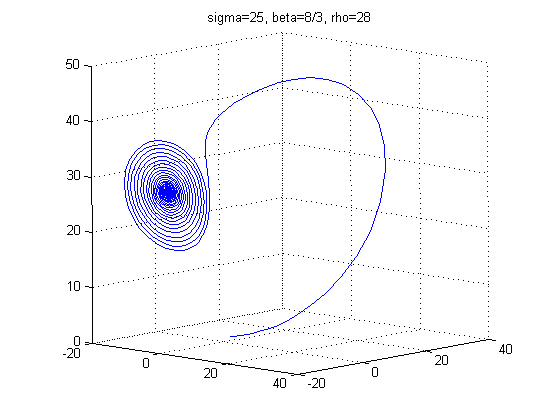 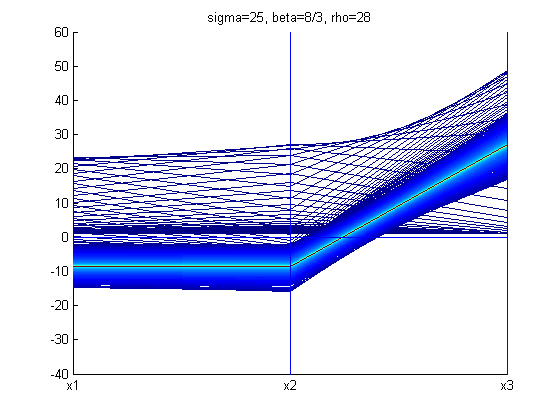
 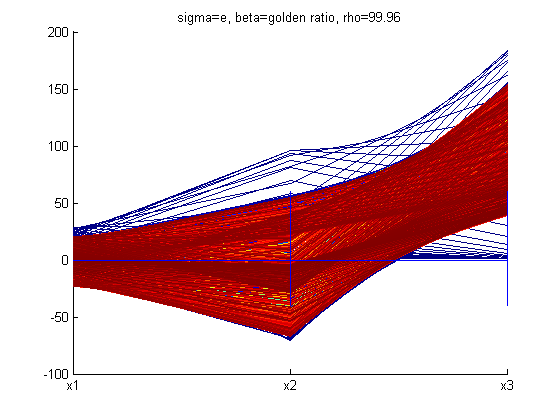
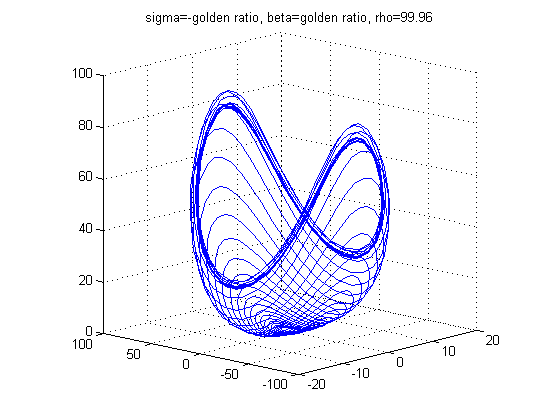 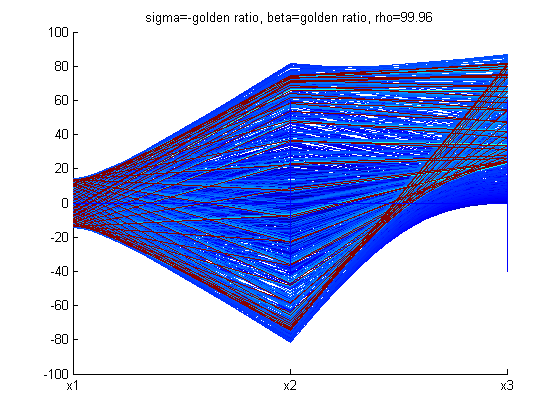
From the figures above, one can see that the Lorenz Attractor yields interesting results based on different values of σ, ρ, and β. A lot of time can be spent on this dynamic system to reveal fascinating structures. Another interesting problem to examine is a fractal, which is a complex dynamical system. The complex dynamical system called the Julia set was picked to examine because it can use a set of quadratic polynomials to calculate values of the fractal. From Wikipedia, if f is a polynomial, then J(f) is the boundary of the filled Julia set; that is, those points whose orbits under f remain bounded. The family of quadratic polynomials is a popular complex dynamical system and it can be expressed as the follows:


The parameter plane of quadratic polynomials, which is the plane of possible values of c, gives rise to the Mandelbrot set. For the purpose of this project, a simple backwards iteration algorithm for fc was coded to visualize the Julia set. Better algorithms can produce all of the parts of the Julia set image, however, implementing such algorithms is beyond the scope of this project. The backwards iteration algorithm was coded for and is described as follows:


Below are figures of some Julia set images calculated using backwards iteration algorithm in Cartesian coordinates and parallel coordinates.
 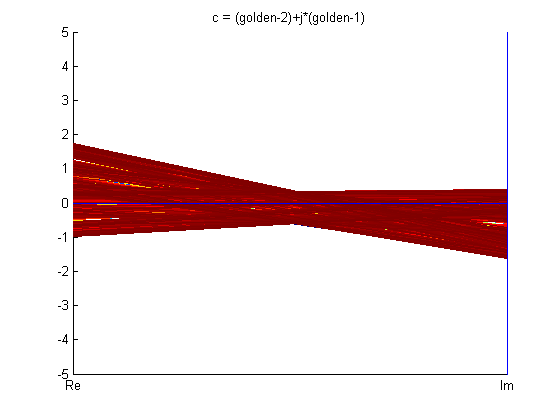
 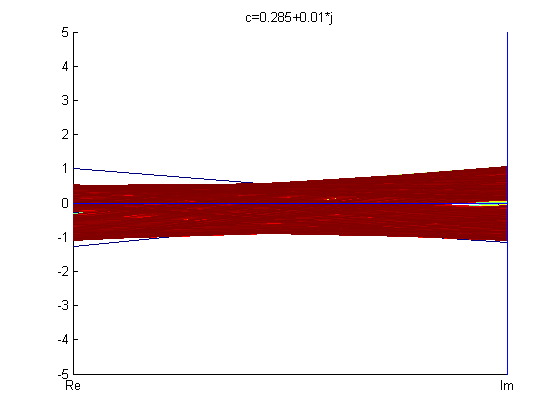
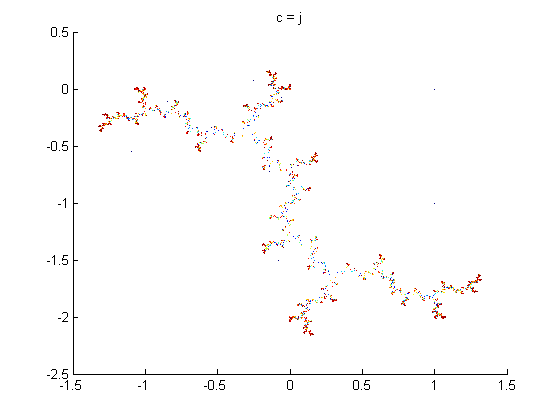 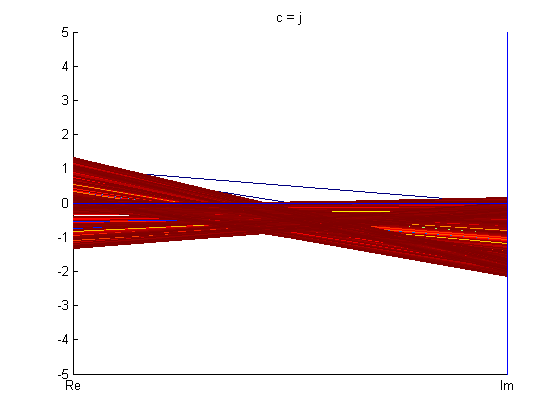
From the fractals in PC shown above, one can see that parallel coordinates, in some sense, is restrictive when it comes to visualizing these fractals.
Clustering
Graphing multi-dimensional data in parallel coordinates can lead to easy visualization. However, graphing the multi-dimensional data doesn’t explain the structure of the data for analysis purposes. The following sections explain the structure of the multivariate datasets for further analysis.
Clustering is one of the fundamental techniques of finding structure in a dataset. It groups similar data points into a cluster and then statistics can be run on those clusters, and knowledge can be discovered in these clusters. Clustering is often used to classify datasets into subgroups. These subgroups are formed because they satisfy some distance measure constraint, which can be a common property shared by all the members of the subgroup.
Several clustering algorithms exist, and all of them have their strengths and weaknesses. Clustering algorithms fall into the following categories: hierarchical, partitioning, evolutionary, and constraint-based. This project deals with partitioning algorithms, especially, k-means algorithm. In this set of algorithms, the dataset is partitioned into non-overlapping clusters. The k-means technique involves calculating the centroid of the dataset repeatedly until you have k centroids i.e. k clusters. The centroid, C, of an n-dimensional dataset with m entries can be calculated as shown below. The symbol d i denotes a single n-dimensional entry in the dataset.

The above formula calculates the centroid of the dataset; it is also the mean of the dataset. In an n-dimensional dataset of m entries, the centroid will have n-dimensions, and the sum of the squared error (SSE) of a cluster in the dataset can be calculated as shown below. SSE helps in understanding how distributed the members of a cluster are around the cluster’s centroid.

The issue with k-means algorithm is that results can strongly depend on the initial guess of the centroids. It is not known how many clusters are in the dataset, therefore, the value of k needs to be guessed or should be defined. The algorithm is sensitive with respect to outliers and can cause wild swings in the centroid leading to unbalanced clusters. Another limitation is that a local optimum computed for a cluster need not be a global optimum for the entire dataset. This is why a bisecting k-means algorithm was employed on the dataset. The algorithm is outlined as follows:

The advantage of bisecting k-means algorithm is that there is no initialization of the centroids. However, the desired number of clusters still needs to be defined. The bisecting k-means algorithm produces almost uniform clusters with a greater similarity amongst the members of the clusters. The clusters produced by bisecting k-means algorithm have less entropy than the clusters produced by the basic k-means algorithm. The total SSE of the entire dataset is the summation of every cluster’s SSE. The total SSE needs to be reduced for optimal clustering and this is achieved by the post-processing act of step 7.
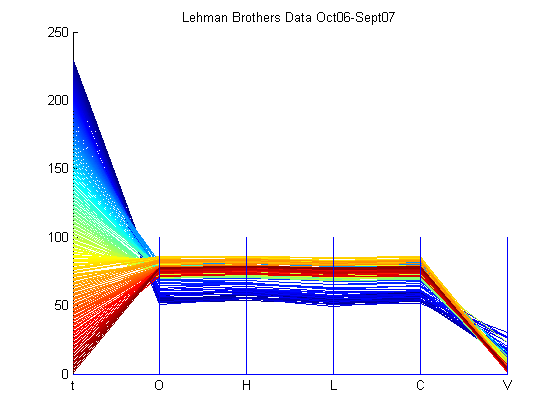
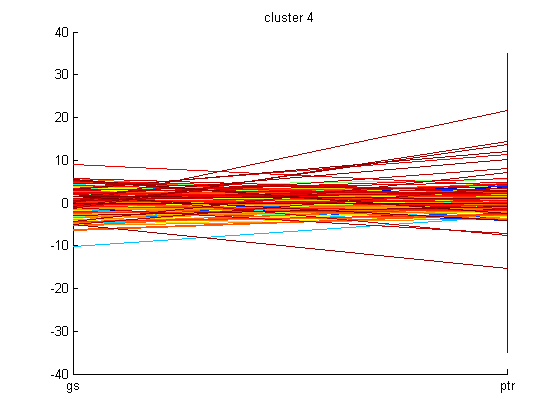
Now that the clustering technique used has been explained, a financial dataset was used to show clustering in parallel coordinates. Financial data, in the format of date, opening price, high price, low price, closing price, and volume, of Lehman Brothers was selected to analyze by the clustering program. The time period of the data is from October 2006 to September 2007, which is numbered from 0 to 230. The dataset, which is available in the Appendix, was loaded using importfile.m. The number of desired clusters, k, was picked as 4. The results are shown below.
 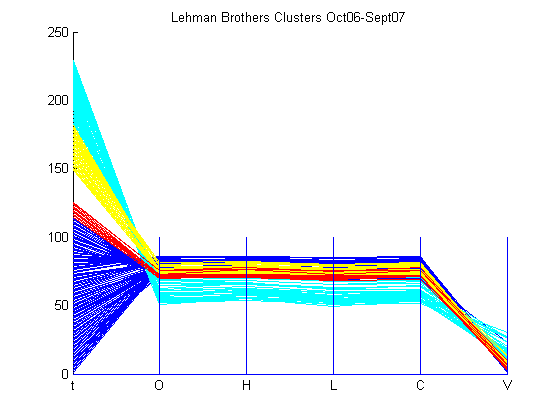
The total number of data points is 230, however, only 208 points were clustered. This can be attributed to the points that failed to be in the desired number of clusters because their inclusion would increase SSE. From the clusters, one can see that 4 time periods have been highlighted. If one were knowledgeable about the financial market during these time period, they can analyze all the dimensions of the dataset in one pass. For example, the worst episode of subprime mortgage crisis hit the market around mid-July 2007 to early-September 2007 and one can notice that the cyan cluster exemplifies the impact of this crisis on the stock value of Lehman Brothers. The stock has lost value than what it was in October 2006, which is marked by the blue cluster. However, one can notice that the cyan cluster has exceptional volume in comparison to other clusters. This can be viewed as traders bargain hunting and loading up on the Lehman Brothers’ stock for future appreciation of their money. The red cluster signifies the first show of the subprime mortgage crisis’ head in February 2007, and it is clear that the stock value of Lehman Brother’s decreased. Then, the stock value rose a bit as the yellow cluster conveys before the crisis stormed through the market once again in mid-July 2007. Overall, clustering can be very useful in finding structures in datasets and explaining certain aspects of the dataset.
Principal Component Analysis (PCA)
Principal Component Analysis (PCA) is common technique used for finding the principle components of a dataset. This is often useful in dimension reduction, reconstruction of the original dataset, and also, in finding out which dimension affects the dataset the most. It can be used to find patterns in the dataset as well. Essentially, PCA is a transformation, which transforms the dataset to a new coordinate system such that the greatest variance by any projection of the dataset comes to lie on the first coordinate, this is the principal component. PCA is computed by calculating the covariance matrix of the n-dimensional dataset. Covariance is defined as the amount by which dimensions of a dataset vary from the mean with respect to each other. Eigenvectors are found for this covariance matrix. These Eigenvectors describe the patterns and characteristics present in the dataset. The basic PCA algorithm is outlined below.

After finding the principal components of the dataset, the reconstructed data can be shown to be:

The above equation will return the original data solely in terms of the eigenvectors chosen in step 4. If all the eigenvectors were selected, then the original data will be restored perfectly. The equations shown below support the retrieval of the original data.

After performing PCA, dimension reduction can be performed and the dataset can be reconstructed by using only some of the principal components. Following this, one can think about applying cluster analysis to group these principal components together to see if any of these dimensions are related to each other. This can prove useful in drawing associations in multivariate datasets.
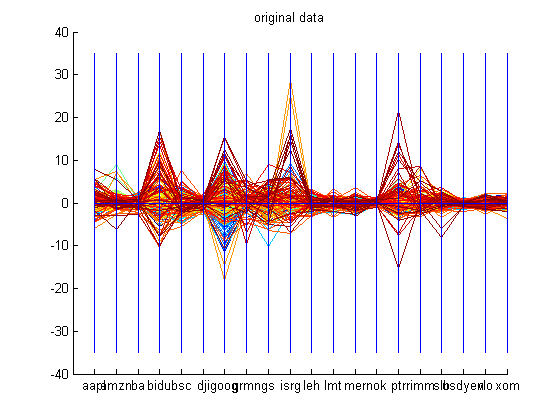
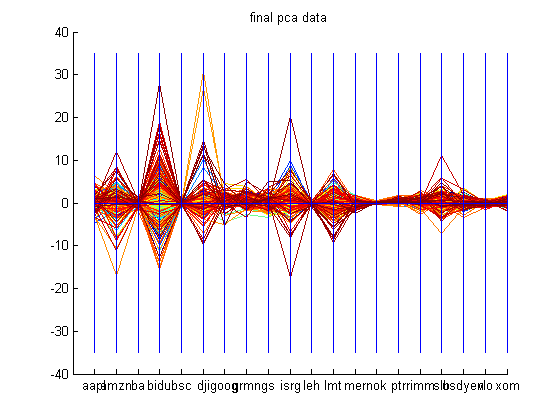
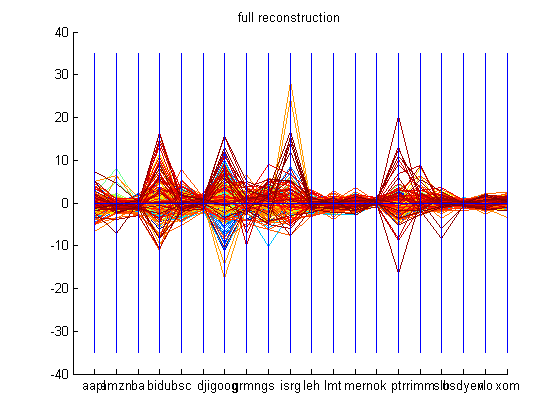
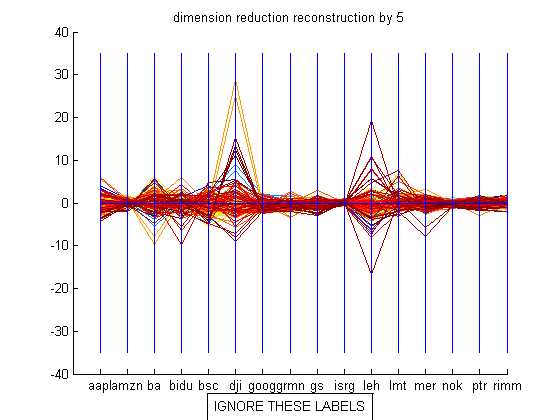
The dataset used to demonstrate the PCA code was financial data of the following companies: Apple, Amazon.com, Boeing, Baidu.com, Bear Sterns, Dow Jones Industrial Average Index, Google, Garmin, Goldman Sachs, Intuitive Surgical, Lehman Brothers, Lockheed Martin, Merrill Lynch, Nokia, Petro China, Research in Motion, Schlumberger, USD-Yen, Valero, and Exxon Mobil from October 29 th 2006 to October 28 th 2007. The datasets are available in the Appendix. These companies were picked because of their activity during the time period mentioned and they span over five sectors of the market. First, the closing prices for all these companies are retrieved and the derivative is calculated using the central difference formula. The entire dataset has 20 dimensions with each company’s change in closing price being a dimension. Now, principal component analysis is conducted on this dataset. The reconstruction is done with 15 dimensions and most of the attributes of the original dataset is captured. The graphs shown below demonstrate PCA on the dataset mentioned above. The labels for the graph which reconstructs the original data by using only 15 principal components should be ignored.
After conducting PCA, basic k-means algorithm with k=5 was employed on the computed eigenvectors to cluster the principal components. The graphs of all these clusters are shown below.
 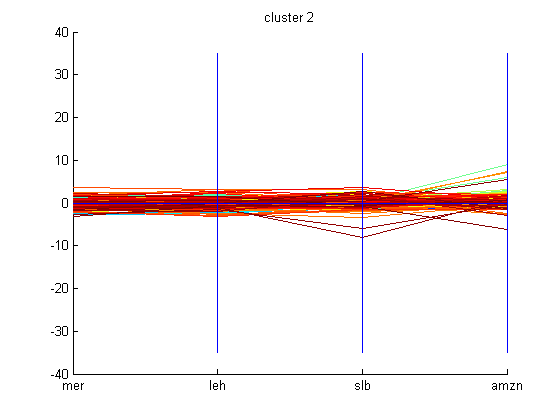
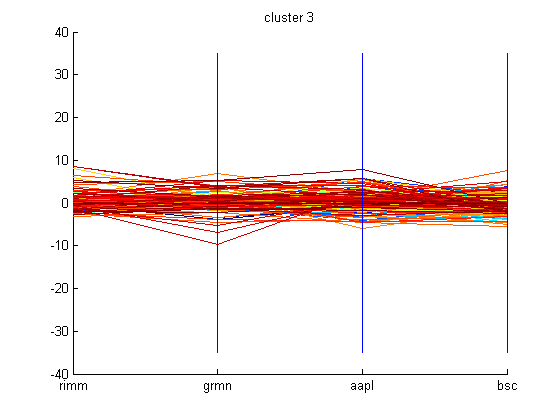 

Someone following the market during the time period mentioned can interpret why some of these companies are grouped together in clusters. Using basic k-means clustering technique may not be the appropriate technique to use to cluster these companies. However, one can still try to see if these clusters indicate anything. Since, the dataset is made up of the derivatives of the closing prices of the companies then it makes sense that the clustering is related to the change in closing price of these companies. One can examine the cluster graphs shown above and can realize that the companies with momentum such as Google, Baidu, and Intuitive Surgical form a cluster because their stock price swings a good amount based on market sentiment. While, cluster 3 swings in a moderate fashion based on market sentiment. At first, it was thought that these companies were clustered because of their year-to-date return, however, this was proven to be incorrect based on the year-to-date return values of these companies retrieved from Scottrade. In a way, higher the swing, then the investment is riskier. Cluster 1 shows companies that are less risky and their swing based on market sentiment is small when compared to companies with great momentum present in cluster 5.
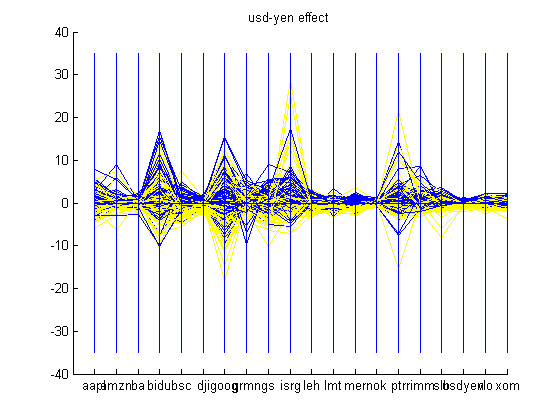
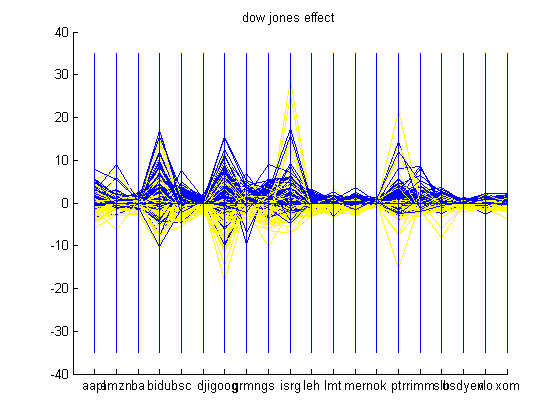
An interesting problem that was noticed while following the market for a few months was effects of the change in USD-Yen. It seemed as if every time the Yen rose against the USD, the market would be in the red. This can be attributed to the carry trade, in which, investors borrow low-yielding currency such as the Yen, and lend high-yielding currency such as USD. Consequently, if the Yen rises against the USD, then investors experience a loss and the market goes down. Another trend that is common is the change in Dow Jones Industrial Average Index. If Dow Jones rises, then chances are that other stocks will rise too. The two graphs shown below show the effect of the change in USD-Yen and Dow Jones on some of the companies looked at. Blue is encoded as a positive change and yellow is encoded as a negative change in USD-Yen and Dow Jones. One can realize which companies beat the market on a bearish day i.e. these companies will have yellow components in the positive side of the scale. An example of this is Intuitive Surgical in both graphs shown below.
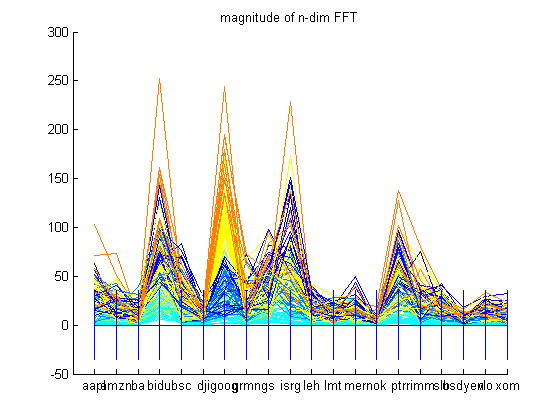
Financial data can be treated as a time-series data. If a Fast Fourier Transform (FFT) of the dataset is taken, then one can see what frequencies this dataset is made of. The amplitudes of the frequency spectrum indicate the higher frequency components present in the dataset. In the financial scenario, this can roughly be translated into the volatility of a company’s stock. One can see that overvalued companies such as Baidu, Google, Intuitive Surgical, and Petro China have the largest amplitudes in the frequency spectrum graphed below. This translates to volatility or great changes in the prices of these stocks over the time period. If one looks at the historic values of Google in the time period given, Google has increased from approximately $475 to $675 in the time period of October 2006 to October 2007. A peak in the amplitude frequency can be seen at Merrill Lynch in the graph below. This peak can be attributed to volatility as historic data suggests that Merrill Lynch has had an up and down year leading to peak in the FFT. Merrill Lynch started at $84, then shot up to $98, fell to $79, climbed to $94, fell to $70, climbed to $76, and then dropped to $66. Another company which has its value change a lot is Baidu, which appreciated from $86 to $355 in the time period given, thus, it has a large frequency amplitude due to this appreciation.
Grand Tour
In high-dimension, it gets very hard for humans to visualize the structure of a massive multidimensional dataset. For example, in Cartesian coordinates a 3-D structure can be viewed from all different angles in all three dimensions and then the viewer can interpret the structure of the dataset. However, in parallel coordinates this can get very vague and is difficult to do, especially, when the dataset is massive with numerous points. This is where Asimov’s Grand Tour algorithm aids in accomplishing this task. Wegman and Luo applied the Grand Tour algorithm to Inselberg’s parallel coordinates to come up with a better understanding of the dataset especially after the dataset has gone through the procedures of clustering, regression, and data pruning. All permutations of all the dimensions of the dataset is considered in the Grand Tour rotation of the dataset. The Grand Tour algorithm provides a generalized rotation of the coordinate axes in a high-dimensional space. This is accompanied by full-dimensional plots allowed by parallel coordinate display and 2-D plots of two of the several dimensions in the dataset, also known as a scatterplot matrix. Subsequently, the data analyst can explore data which is both high-dimensional and massive in size.
As mentioned above, Grand Tour algorithm is the viewing of a dataset by rotating it through different angles. The Grand Tour algorithm, also a torus method, is extended to n-dimensional space and it is outlined below.
- Let
 be the canonical basis vector of length n. The 1 is the j th position. The e j are the unit vectors for each coordinate axis in the initial position. A rigid rotation of these axes to a new position, based on time t, with basis vectors be the canonical basis vector of length n. The 1 is the j th position. The e j are the unit vectors for each coordinate axis in the initial position. A rigid rotation of these axes to a new position, based on time t, with basis vectors  is needed. The dataset has m-entries, with each entry being is needed. The dataset has m-entries, with each entry being  . The representation of x i in the a jcoordinate system is given as: . The representation of x i in the a jcoordinate system is given as:  , where, , where,  , j=1…d and i=1…m. , j=1…d and i=1…m.
- Goal is to find a generalized rotation, Q, such that
 . Rather than rotating through an axis in 3-D space, the rotation needs to be done in a plane in n-dimensional space. The generalized rotation matrix, Q, is built up from a series of rotations in individual two-flats. In n-space, there are n canonical basis vectors, and, thus, . Rather than rotating through an axis in 3-D space, the rotation needs to be done in a plane in n-dimensional space. The generalized rotation matrix, Q, is built up from a series of rotations in individual two-flats. In n-space, there are n canonical basis vectors, and, thus,  distinct two-flats formed by the canonical basis vectors. distinct two-flats formed by the canonical basis vectors.
- Let
 rotates in the rotates in the  plane through an angle of θ. Then, Q is defined as: plane through an angle of θ. Then, Q is defined as:  . The restrictions on . The restrictions on  are 0≤ are 0≤  ≤2π, 1≤i≤j≤n. The vector ≤2π, 1≤i≤j≤n. The vector  can be thought of as a point on a p-dimensional torus, where p = can be thought of as a point on a p-dimensional torus, where p =  . The individual factors of . The individual factors of  are n x n matrices given by: are n x n matrices given by:
In the above matrix, the cosine and sine entries are in the i-th and j-th columns and rows.
Describe a space filling path on the p-dimensional torus. This can be composed as  . In this equation, . In this equation,  is a sequence of mutually irrational real numbers and is a sequence of mutually irrational real numbers and  is interpreted modulo 2π. A sequence of mutually irrational numbers is irrational numbers without any linear combinations. Examples of irrational numbers can be found here. The canonical unit vector for each coordinate axis at time t described by the grand tour algorithm is an orthogonal linear combination, is interpreted modulo 2π. A sequence of mutually irrational numbers is irrational numbers without any linear combinations. Examples of irrational numbers can be found here. The canonical unit vector for each coordinate axis at time t described by the grand tour algorithm is an orthogonal linear combination,  . .
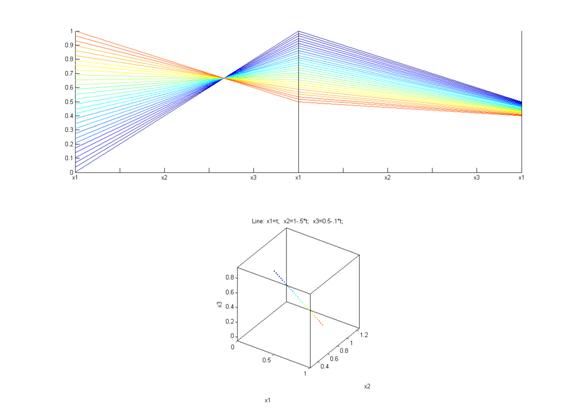
This code for the Grand Tour algorithm performs as discussed by the outline above. However, midway through the code the dataset is changed to the “pruned” data as discussed by the next section. These lines of code have been marked in the given code and can be removed. The code for the Grand Tour uses a synthetic dataset, pollen, which is provided in the Appendix and can be found here. The pollen dataset has been graphed for convenience below.
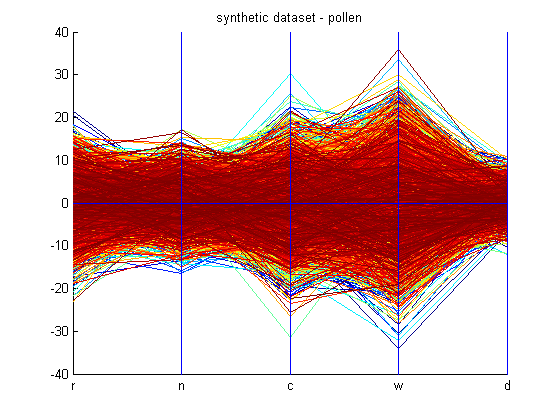
This synthetic dataset has a six-dimensional internal structure, which reveals the word “ EUREKA,” as shown by this figure. This word is revealed when the Grand Tour is performed on it. However, pruning the dataset is not explained in any of the research papers read. Therefore, a scheme has been coded up using clustering to “prune” the dataset by finding clusters in the clustered dataset, and so on. This yields different results. But, when a scheme using density plots was developed to prune the dataset, shown in the next section, then the Grand Tour yielded different results, but still no “ EUREKA.” The research papers read don’t explain how they have reduced the 3848 points in thepollen dataset to 99 points in the pollen dataset to find “ EUREKA.” Limitations of the pruning technique in the next section will touch more on this on this retreival of these 99 points in the dataset. Here are the animations, 1, 2, 3, and 4, of the Grand Tour algorithm on the “pruned” dataset. Animation number 4 records the Grand Tour executed on dimension 2 vs dimension 3. As one can see, there is no “ EUREKA,” however, one can closely examine that the structure of the dataset remains the same even though it is being rotating through all angles in any 2 of the n dimensions. Grand Tour algorithm is useful for finding structure and visualizing the n-dimensional dataset from different angles to get a better understanding of the dataset.
Density Plots
As one can imagine, massive multidimensional datasets when graphed in parallel coordinates leads to a great deal of visual clutter. A good example is the pollen dataset used in the previous section. It is nearly impossible to visualize the relevant structure of the dataset, a technique such as clustering could help, but basic k-means clustering can pick arbitrarily initialized leading to futile results. Data pruning using brushing and hue saturation, also known as highlighting, is an excellent way of indentifying correlations among attributes or the presence of interesting clusters. Density plots are a way of visualizing pertinent information from a cluttered parallel coordinates by considering the overlaps of the graphed points in parallel coordinates (polylines, if you are thinking in Cartesian coordinates). Creating a density plot involves finding the areas through which the most number of points pass through and assigning a frequency value to this area. This density plot will show the most frequented areas of the plot the brightest, and this can help the data analyst visualize the densest structure of the dataset. There are several ways of highlighting pertinent information in a parallel coordinates plot. One common way is to use a Silicon Graphics workstation to accomplish the highlighting task. Since, this Silicon Graphics workstation enables the user to control the raster and the image through software, then one can easily add up all the pixel values and come up with the density plot almost instantly. Then, the high density regions can be stored and the low density regions can be pruned away. Using this technique, the pollen dataset was pruned by Wegman to retrieve “ EUREKA” from the dataset. Unfortunately, Silicon Graphics workstations are obsolete and the company is dead, therefore, a novel scheme had to be developed to accomplish this same task. A symposium paper by Artero, Oliveira, and Levkowitz mentioned in the Appendix was referenced to create density plot to retrieve structures within a dataset.
Before the algorithm is discussed the pixel resolution of the graphed plot needs to be known. A sample Matlab plot was used to figure out what was the pixel resolution of the plot. VisionX, a computer vision software package from Professor Reeves, was used in finding this pixel resolution. The pixel resolution of a Matlab plot is approximately 435 by 343 pixels. The discrete raster representation of the Matlab plot is the input into the algorithm discussed. The algorithm uses a frequency matrix which stores the frequency of every pixel being hit by the drawn lines in the original parallel coordinates plot. Then, once all these frequencies are found, the nonzero frequencies and their indices in the frequency matrix are manipulated in finding two pixels. Bresenham’s line algorithm, a famous computer graphics line drawing algorithm that can be found here, is used to draw a line through these two pixels. This line is stored in the output discrete raster representation and it should be clear that when the same pixel is passed through more than once, the pixel value is incremented in the discrete raster representation. In this way, less dense regions have low frequency values and are colored lighter than denser regions with higher frequency values. This frequency plot, known as "IPC frequency plot" in the algorithm displayed below, is converted to a density plot by applying a smoothing filter as shown below. This is just a regular 3 x 3 mean filter.
The algorithm discussed above is described in detail below:

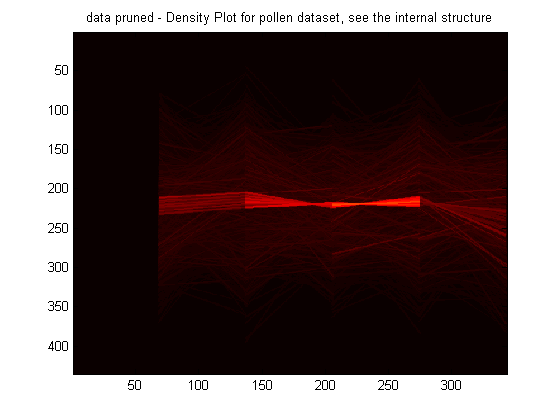
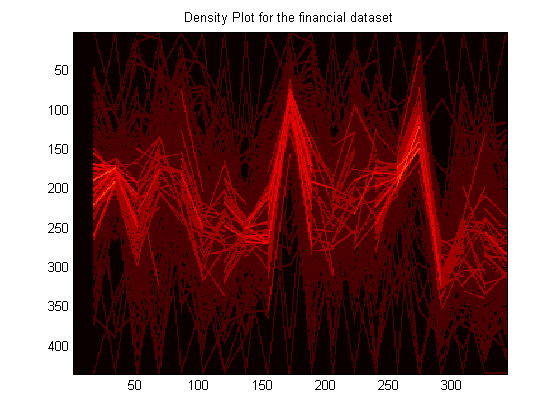
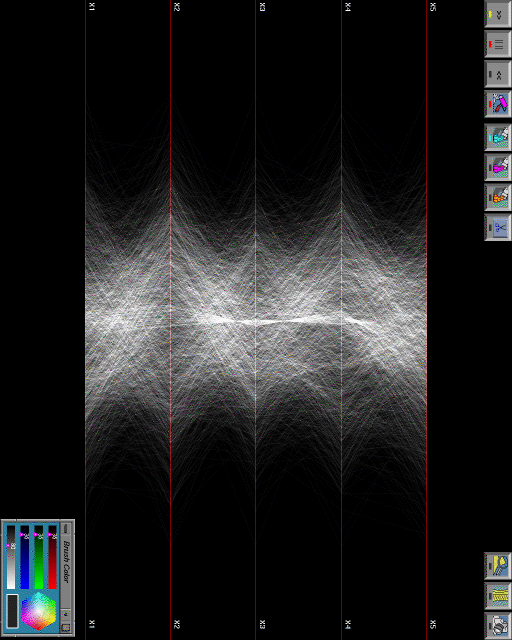
The density plot is obtained by applying the smoothing filter prior to step 3.2. density.m is executed on the pollen dataset. The density plot for the pollen dataset is shown below. As the reader can clearly see, there is a very well defined structure of high density in the dataset and it has been highlighted a bright red compared to the rest of the dataset. Using a Silicon Graphics workstation, Wegman highlighted this structure, which is also shown below. One can examine how similar these structures are. Another dataset examined for its density and structure is the financial dataset used throughout this project and it is also shown below.
Once the density plot is calculated, the data analyst would like to know what points are in these dense regions. Well, this problem is not an easy one to solve. The complexity of the problem relies on the fact that the density plot used a discrete raster representation, an image, to show the dense regions. However, these dense regions are in an image file encoded in pixel values and they do not correspond to points in the dataset. A recovery has to be made. Since there are no research papers written on this aspect of the problem, and Wegman seemed to have done it somehow. Given the time constraints of this project, an intuitive algorithm, based on the reversal of the density plot algorithm mentioned, was devised as stated below:

The code for retrieval, which uses the stored x, y, and auxiliary matrix from density.m, is executed on the density plot of the pollen dataset. The resulting parallel coordinates plot is shown below. The points retrieved by the density plot as being a member of the dense region is colored red, while the rest of the dataset is colored gray. These points result in a pruning of the pollen dataset. The plot is shown below.
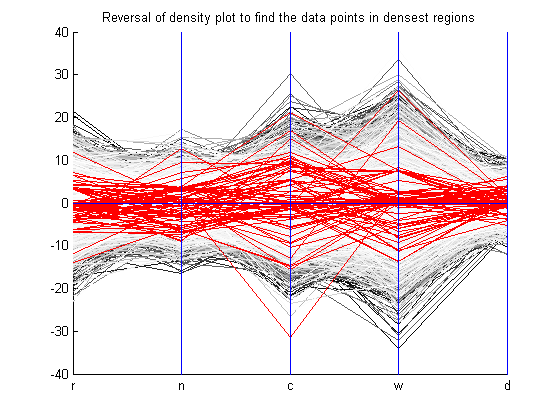
Looking at the plot above, there are several points missing. Experimenting with the threshold value can probably fix this. Also, coming up with a better algorithm to retrieve the data points in the dense structure from a discrete raster representation will enable a better grasp of the structure on which the Grand Tour algorithm can be run on. The Grand Tour algorithm discussed above was run on this pruned dataset, which is highlighted in red in the above figure, to see if the word "EUREKA" was displayed. Unfortunately, it wasn't. This means that the dataset is not adequately retreived, hence, a better algorithm needs to be implemented. The animations are provided in the Grand Tour section and the Appendix.
|

