Introduction
Neurobiologists and people studying animal behavior often want to present visual stimuli to animals(1). Characterizing the motion of a stimulus for comparision with other stimuli is not well defined at present. We are attempting to figure out a scheme for measuring the strength or intensity of a motion sequence. The first application is in spider visual courting displays.
New material since this Journal Club presentation
Possible Methods
There are several ways of estimating motion. The two basic approaches are object based (e.g. 2) and image based methods. Object based methods use information about the 3D geometry of the structure generating the motion to estimate parameters such as joint rotation or limb velocity. Image based methods use only the information that might be available from a single video tape, or that might be observed by an animal under test. We chose to concentrate on image based methods because we need to compare video sequences as well as computer graphic models of spiders.
Two separate image based schemes were implemented:
I is the array of intensities
at every point in a frame, and v is the vector velocity of the
pixel thendI/dt = -grad(I) dot vv
gives,v = -(grad(I) dot (dI/dt))/mag(I)2
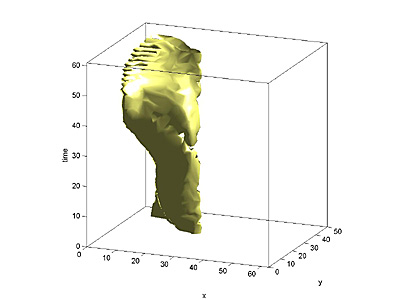
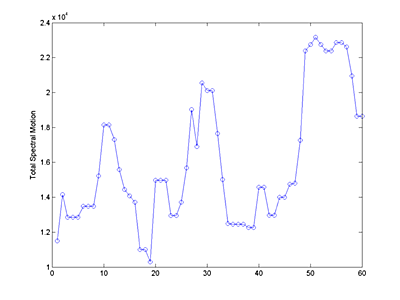
The resulting 3D speed field (2 space dimensions, plus time) was plotted
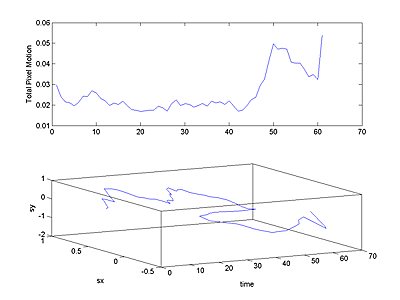
as a volumetric isosurface. Also, for each frame, the total pixel motion
was estimated by summing the speeds of all pixels. An estimate of the scale
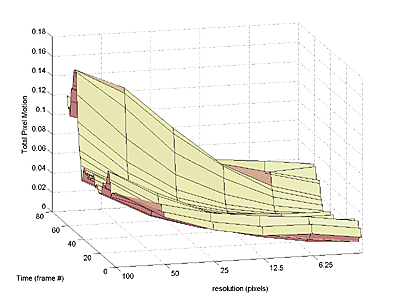
of the motion (size of the moving object) was made by repeating the calculation
on downsampled versions of the image until only 4 to 8 (highly averaged) pixels
were left in the image. Details of motion show in the early passes, but only
large scale motion showed up in the final passes. The resulting surface of
total pixel motion versus time and scale shows the size distribution of motion.
The programs
The following matlab programs implemented the various features noted above. In all cases a slightly downsampled version of the animation was used for analysis.
References