
Not even nearly ready yet!
Introduction
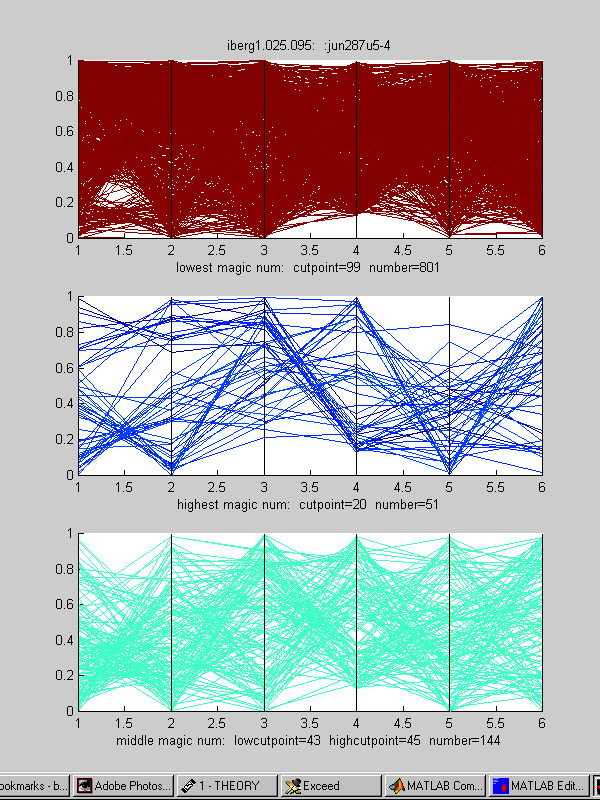
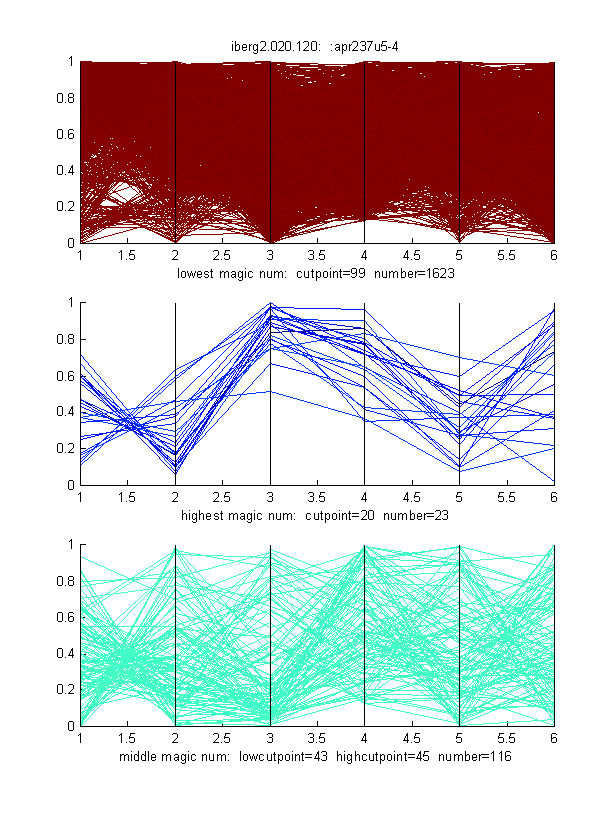
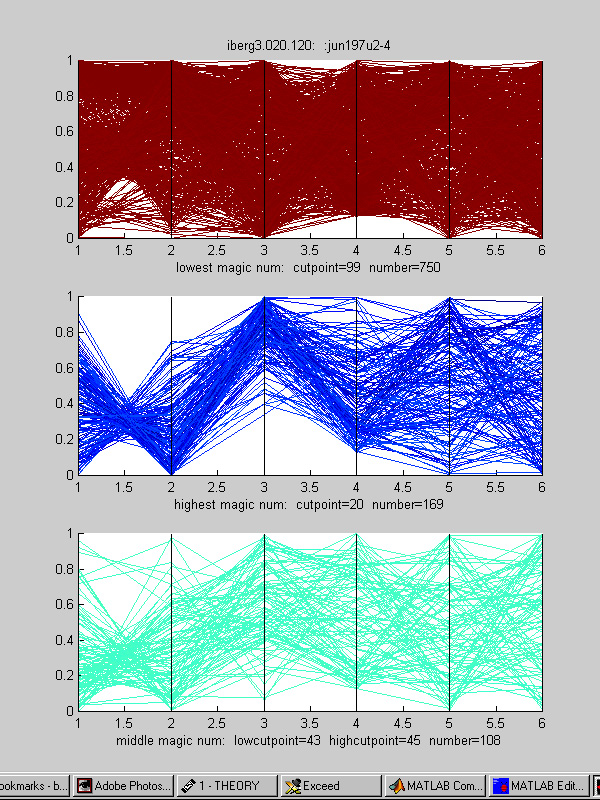
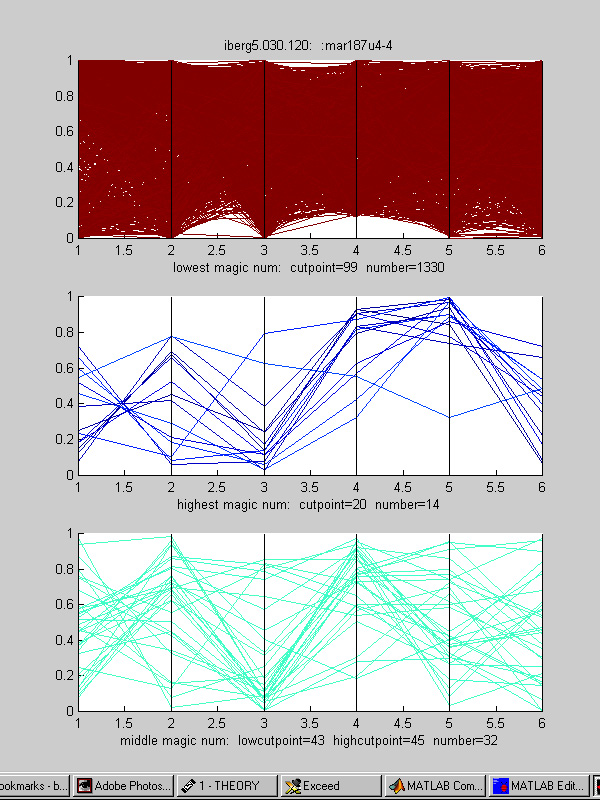
Inselberg () and Wegman () showed that a visualization system based on parallel coordinates could be useful in understanding high-dimensional data sets.
We are currently working with a 6-parameter system.
The Code
First try at parallel cood in Matlab.
Results
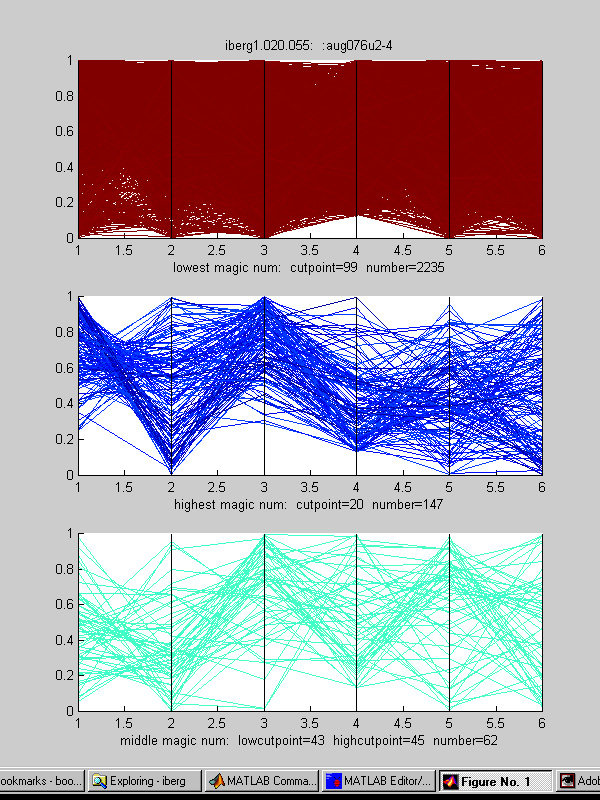
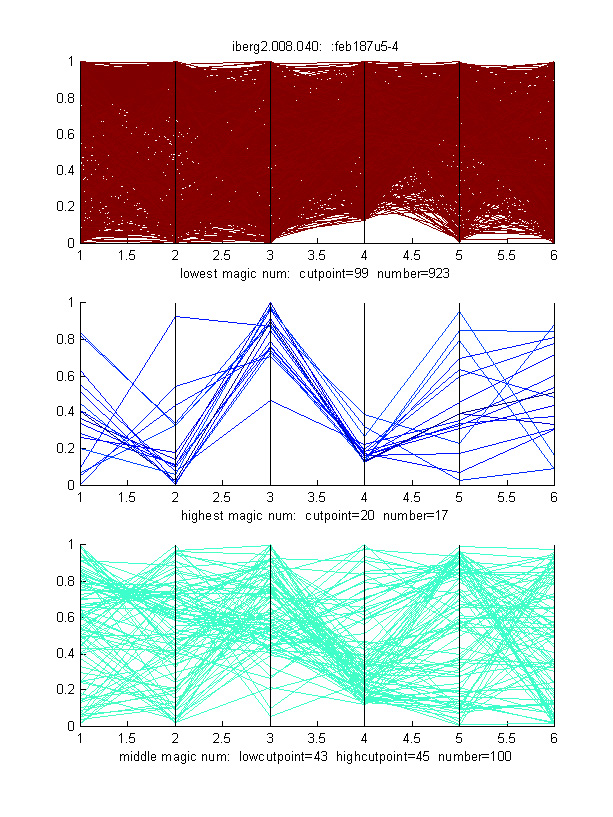
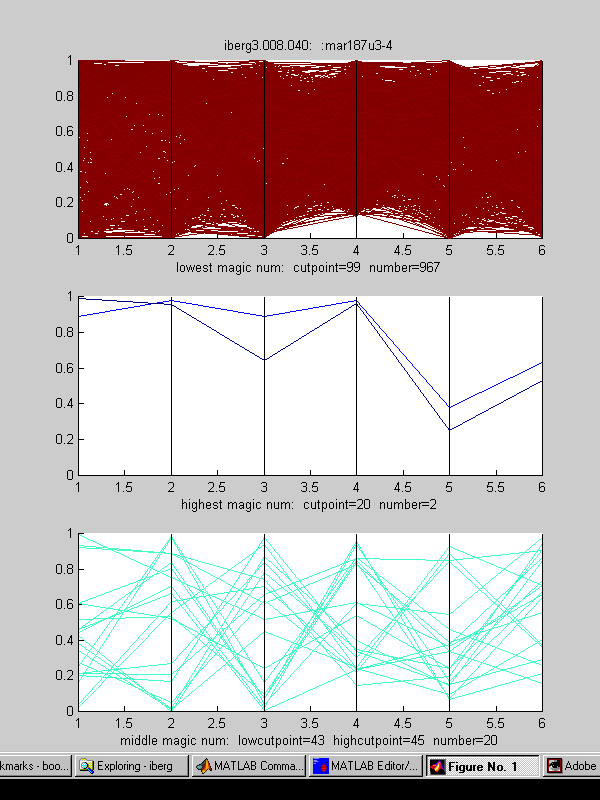
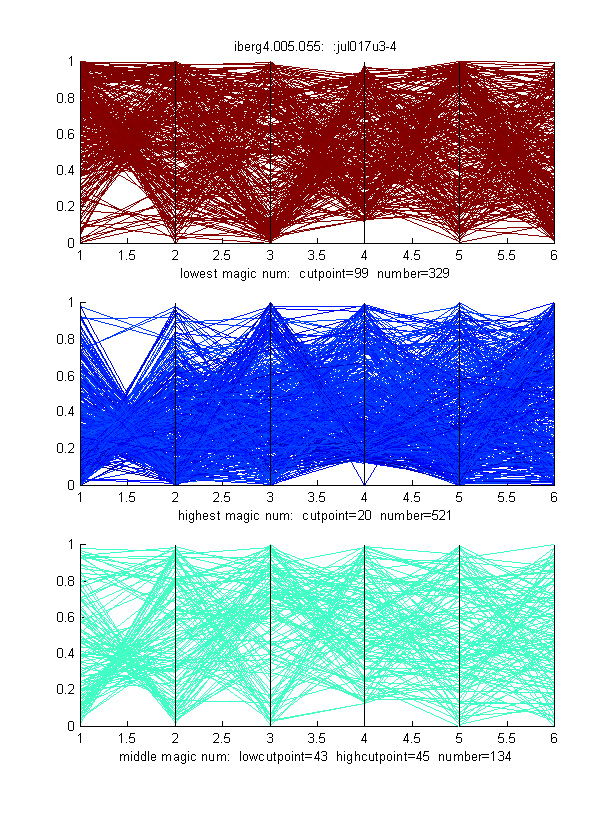
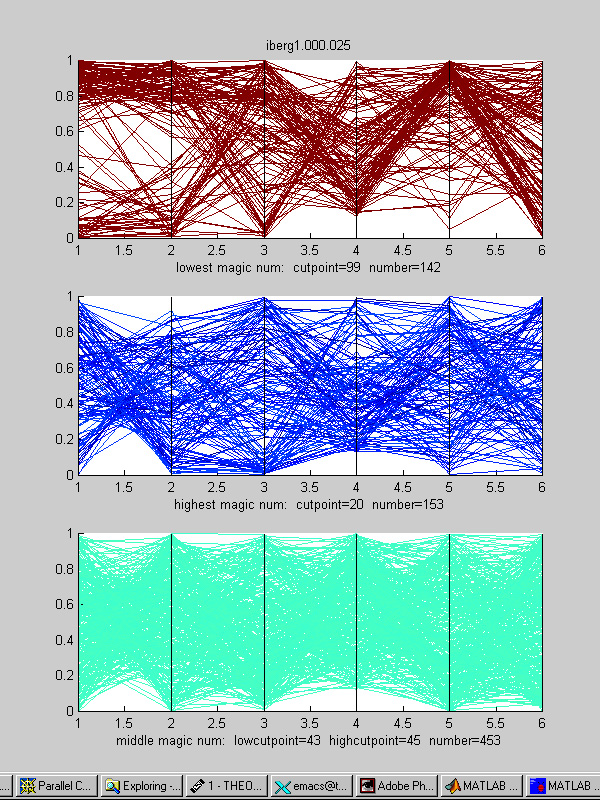
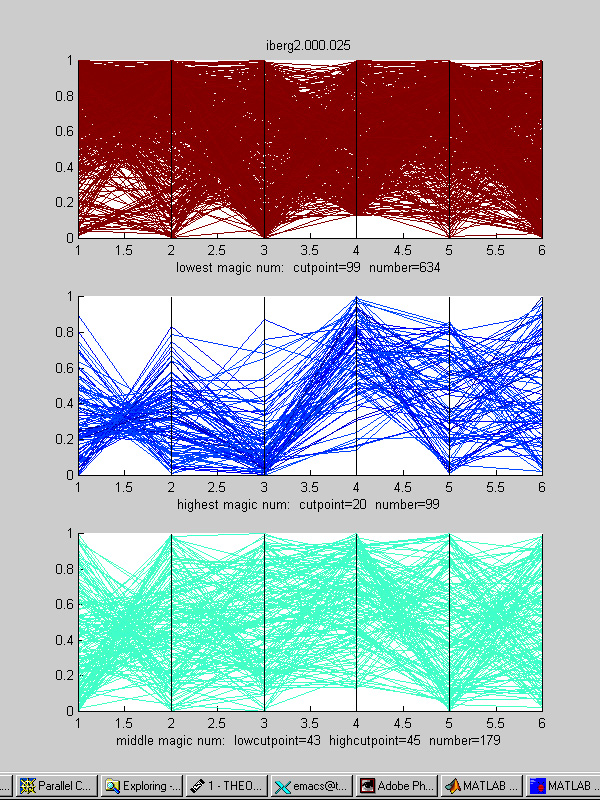
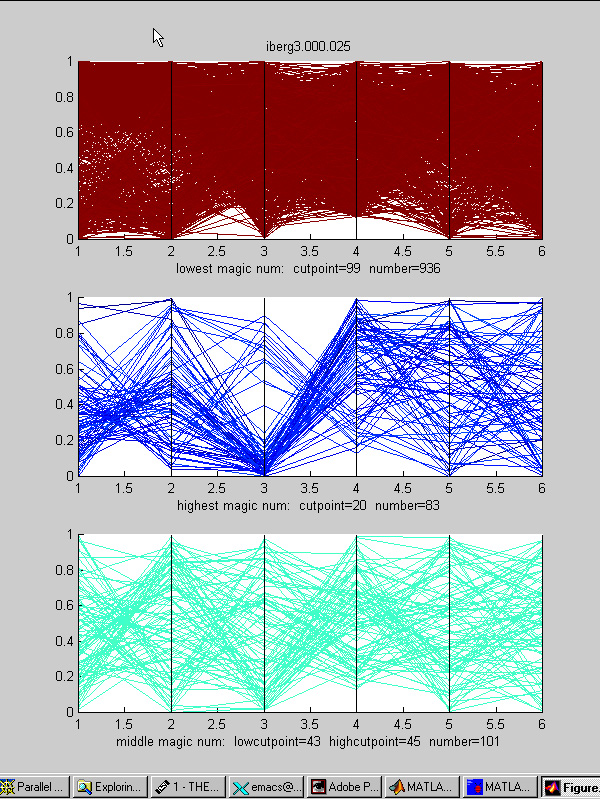
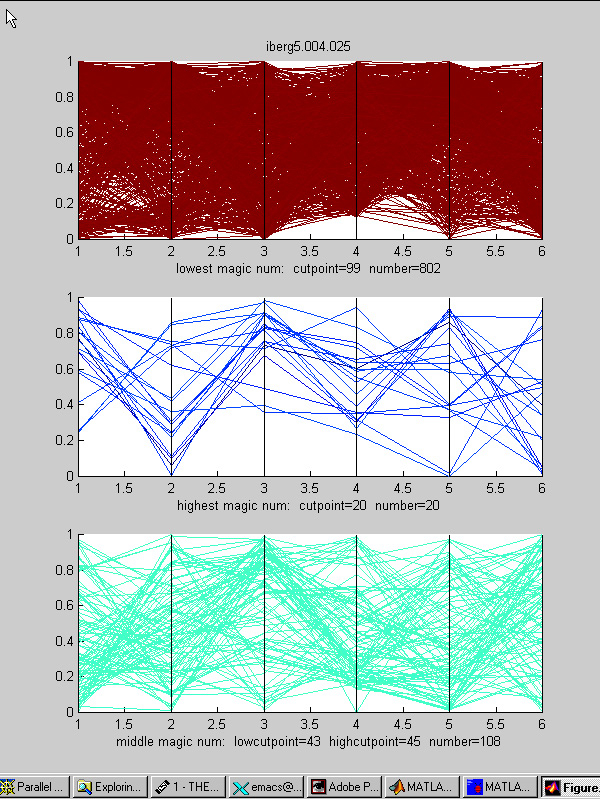
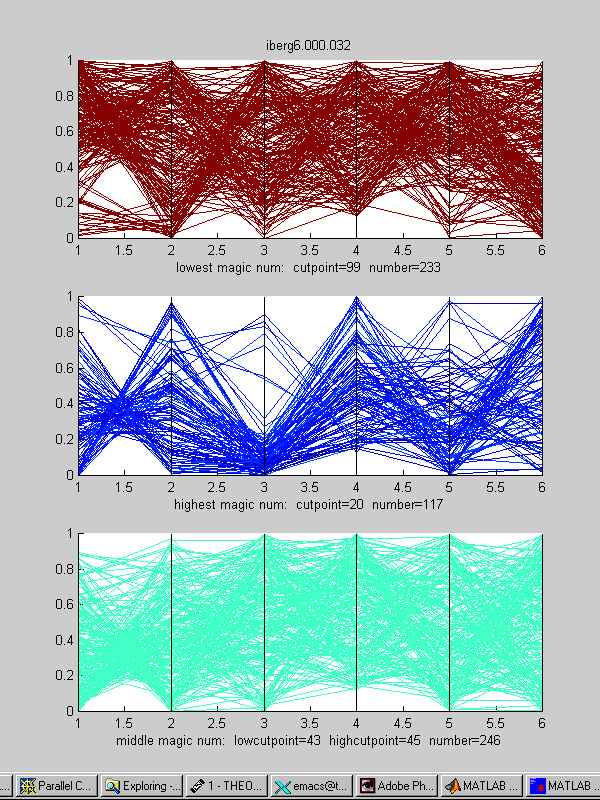
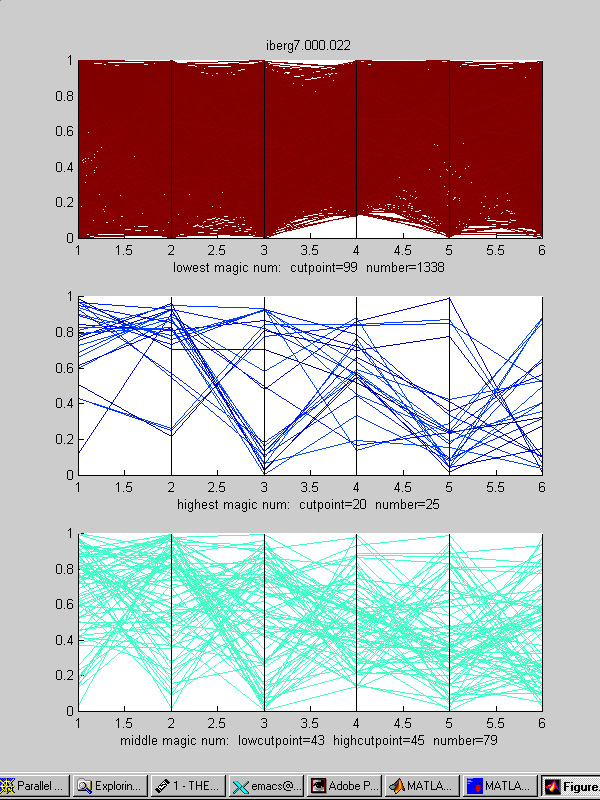
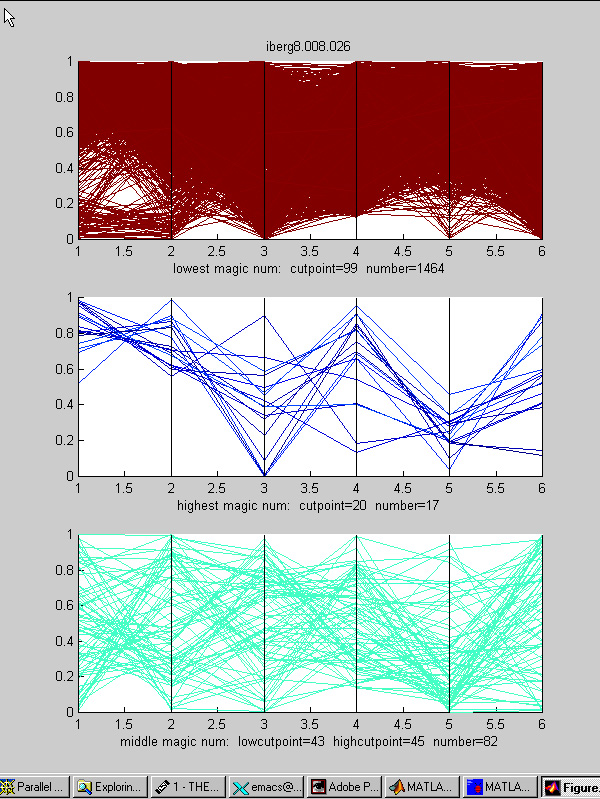
Each of the following images is based on 10,000 random parameter selections in 6-space. The parameter axes are: