"A mouse that detects your stress"
project soundbyte
In the past five weeks, we have considered and built three projects, ranging from: optical sensing, electromyography (EMG), and galvanic skin response detection. Initially, our project was using an optical sensor and EMG to detect finger movement for applications, such as: playing piano and Morse code. However, after completing the hardware, due to issues with the hardware we could no longer measure a valid signal. We switched directions and built a stress sensing computer mouse utilizing galvanic skin response and heart rate. Our goal is to use this device to measure changes in the autonomic nervous system. The device vibrates to the user’s heartbeat, increasing the user’s awareness of his/her stress level. In order to test and prove the functionality of the device, we pair this hardware with a game tuned to increase the user’s stress level by increasing the speed of a 1-D maze Falldown-style game.
The final product.
High Level Design top
Rationale and Source of Project Idea
Stress is a physiological and biological response to a stressors such as environmental condition or stimulus. As our body encountered a difficult situation, our body prepared itself with focus, strength and heightened alertness. Our nervous system responds to a threat by releasing a flood of stress hormones, including adrenaline and cortisol. These hormones rouse the body for emergency action. The Galvanic Skin Response (GSR) corresponds to the surface resistance of the user’s skin. At high levels of stress, the sweat glands in the hands increase activity, increasing the salt and moisture content of the skin thus reducing surface resistance.
For this objective, we have designed a biometric sensing computer mouse that takes into consideration heart rate and galvanic skin response in order to detect the different conductance of the skin when a person is under stress or when not. In order to stimulate stress, we invite the user to play the Falldown game. As the user is getting closer to the end of the game, his/her stress level is expected to increase, the ball will start to move faster and the game stimulates the user to increase his/her concentration on the game.
Logical Structure
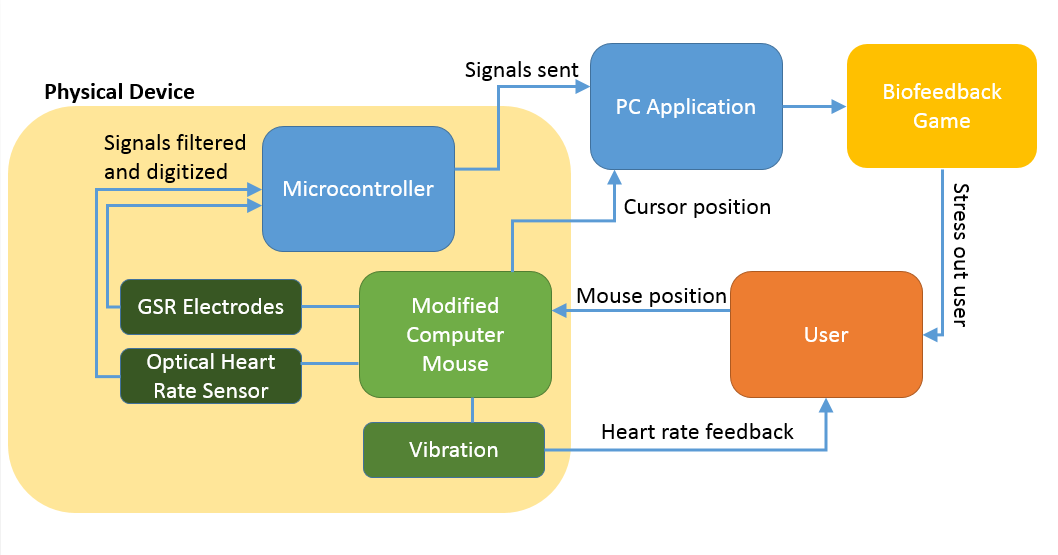
High-level block diagram.
Relationship of Design to Available Standards
Based on FDA Regulation, this device is considered as Class II Medical Device. The most important FDA Standards that need to be considered is the electrical safety. Since our device is line-powered, it is important for us to describe the design features that assure the patient will be isolated from AC line voltage under any condition of electrical component failure. We will also take into consideration the effect of any line-powered accessories that connect to the device, and the use of a line-powered battery charger if the device is powered by a low voltage battery. In order to prevent the heat produced by the electrical energy to cause injury to the subject’s skin, the average current density should not exceed 0.25 Watts per square centimeter. In addition, the device needs to satisfy other industrial standards, specifically UL 544 or any other electrical safety standard.
Existing Patents
There are several patents that discuss a galvanic skin response. For instance, US6415176B1 mentioned a skin-conducting sensor as a wearable device, specifically gloves. The device includes an on-board power source and a source of illumination that provides a continuous visual indication of skin conductivity. While in US3870034, the configuration of the device is a strap. The device is like a wristwatch which houses an oscillator circuit, a battery, a sound emitting device and a pair of spaced electrodes located on the opposite ends of the casing so that the wearer may conveniently touch the two electrodes with two fingers.
Past Designs: Optical Sensor and EMG for Gesture Control top
Hardware Design
Operational Description
The operating principle of the optical gesture recognition is to measure the changes in reflectance at multiple points along the wrist to detect changes in the underlying tissue structure of the wrist. Differential optical pairs measure optical reflectivity of IR (880nm) light at two points along the wrist. As the tendons shift position due to muscle contractions for the fingers, the differential optical reflectivity can be measured. These values are input as features to the machine learning classifier.
Figure 1 to 3 are the hardware designs of our optical sensor idea. Figure 1 shows the optical sensor circuit, which comprises of mainly INA121, 100k TrimPot, and BJT Transistors. The recorded signal was buffered, filtered (both actively and passively), and amplified with two gain stages (gain of 30 for each stage). For the first stage amplifier, we used an instrumentation amplifier INA121.
At the beginning, we soldered the IRs and Phototransistors on a electrical board and then used glue to stabilize the whole system in the configuration that will place nicely on the user’s wrist. However, after testing that setup, the obtained signals was not as good as we wanted; therefore, we decided to design a better housing for the IRs and Phototransistors. As the result, a hard housing as shown in Figure 2 was 3D printed. At the same time, we also designed a flexible housing which could wrap around user’s wrist. However, before we attempted to test out these configurations, the signal was no longer there. As a consequence, we decided to move on with our second design idea: using EMG signal to play a piano.
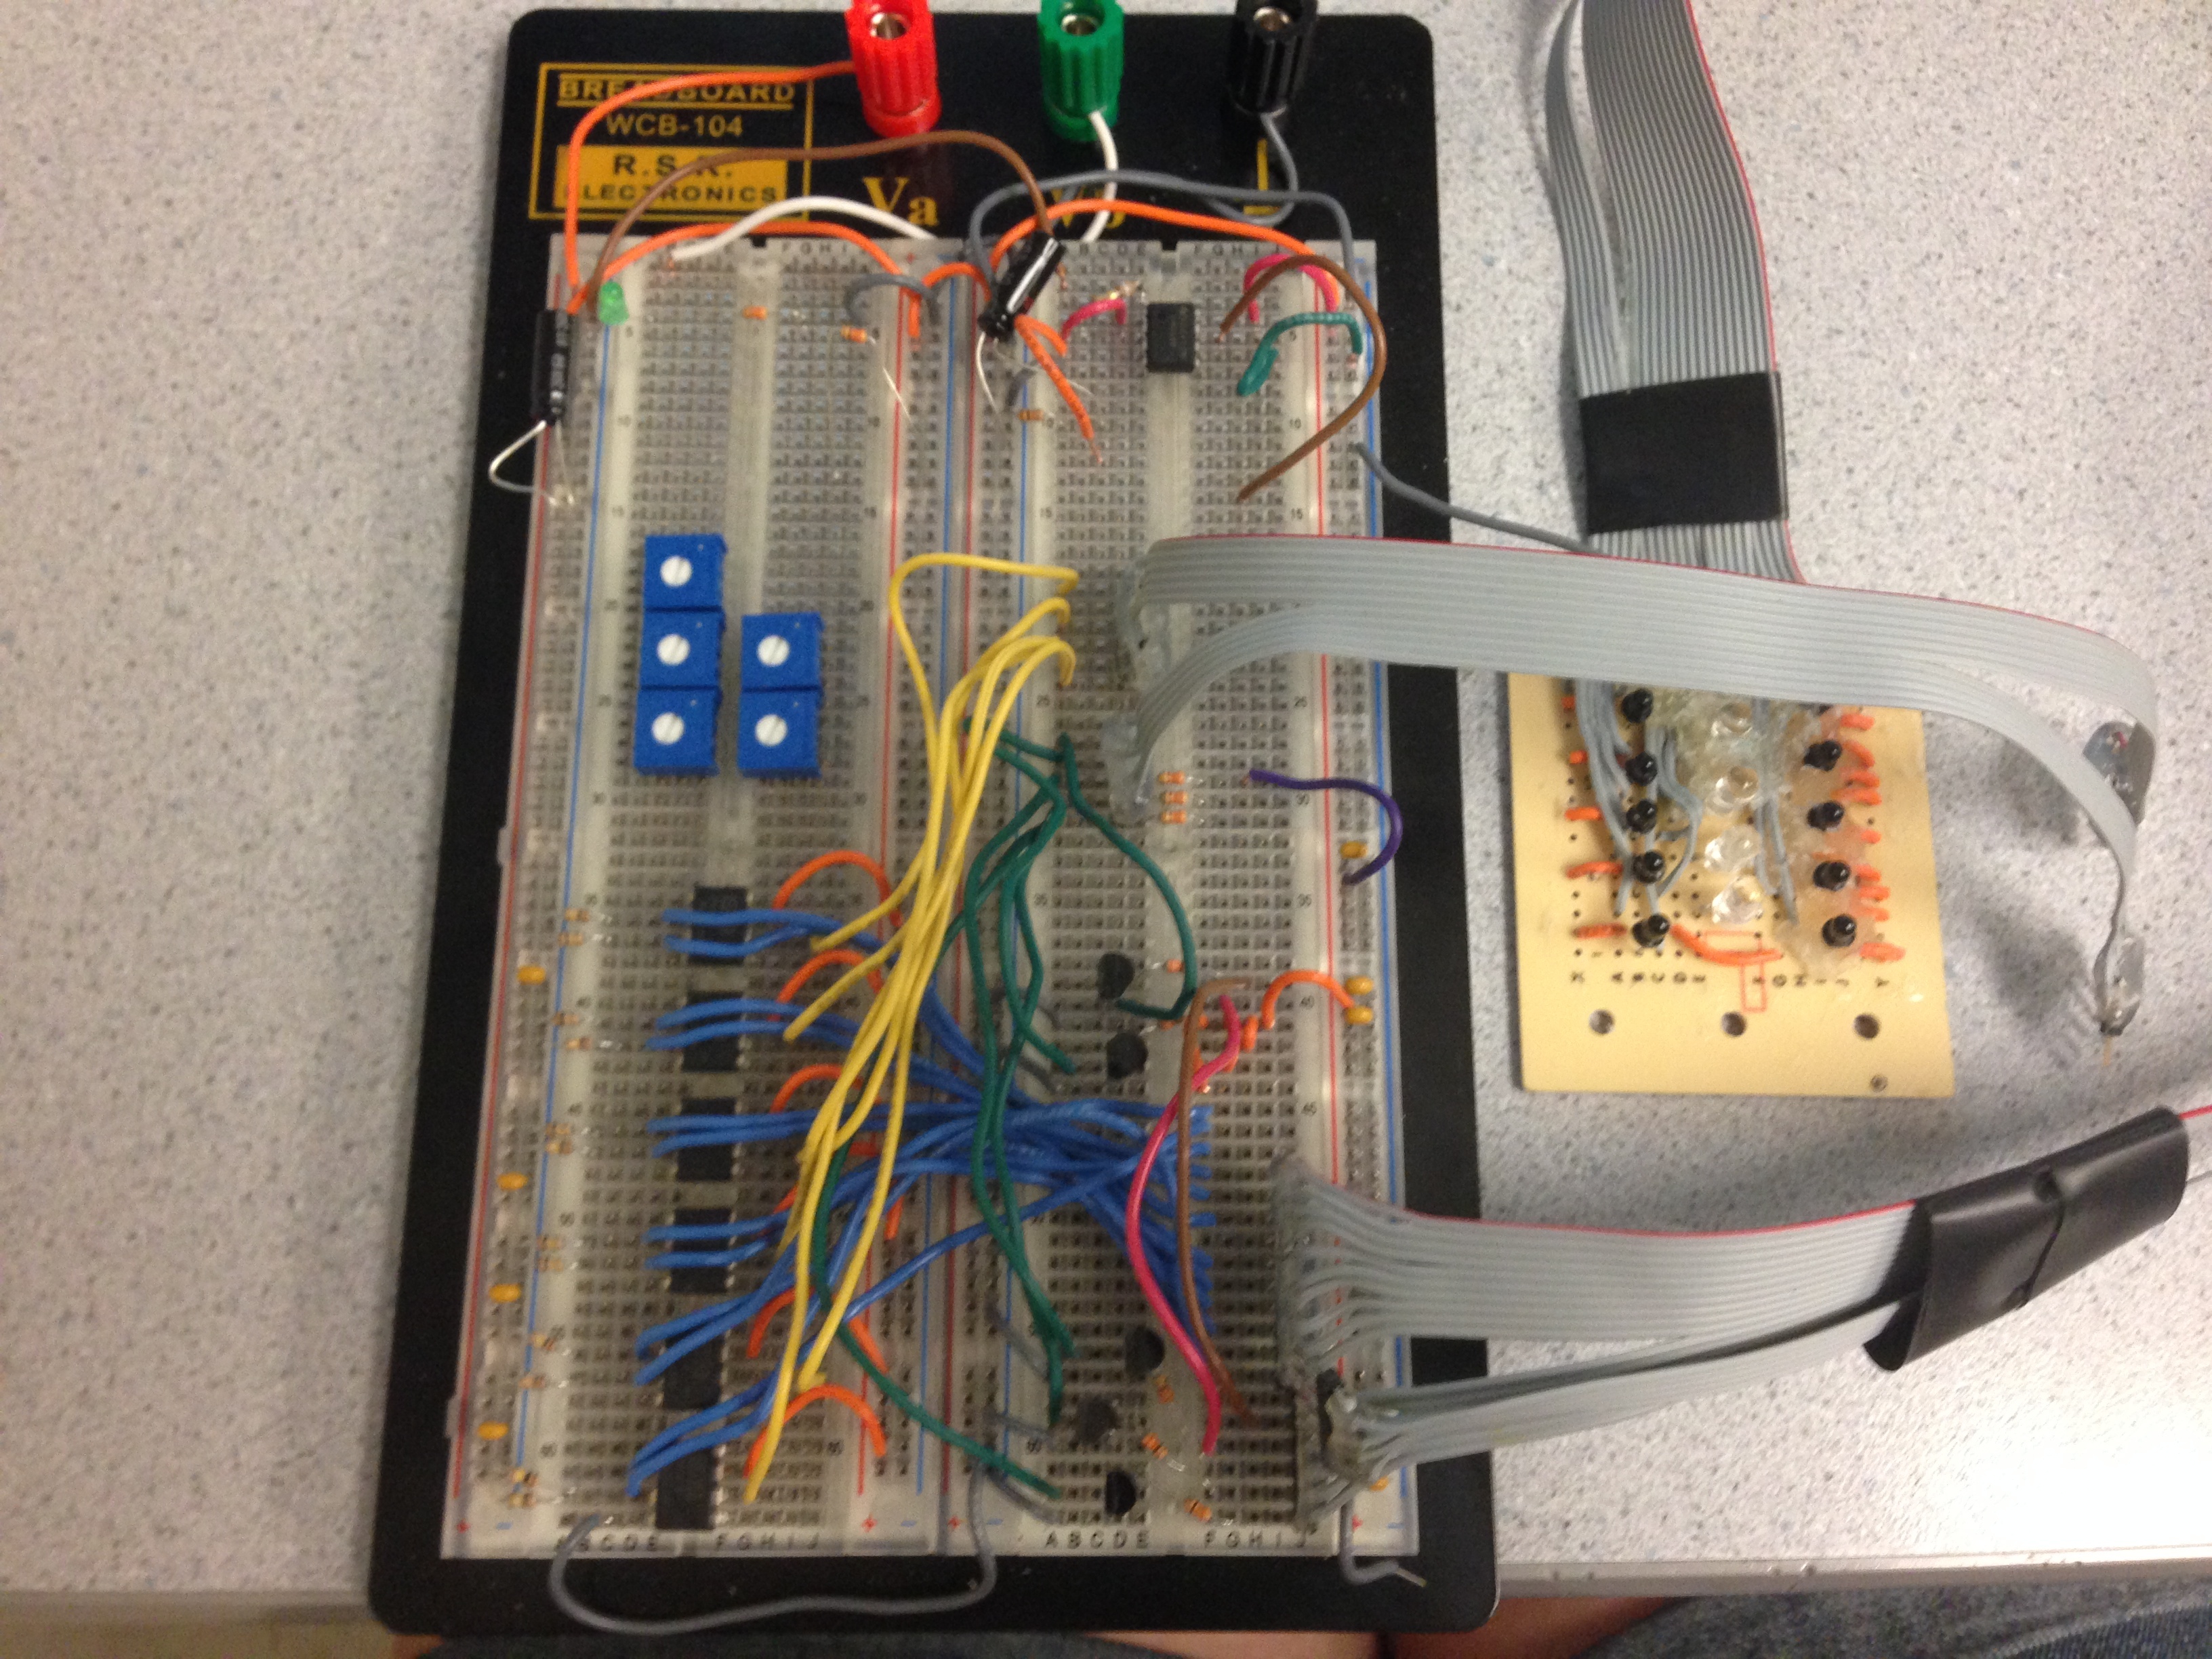
Figure 1. Optical Sensor Idea Hardware
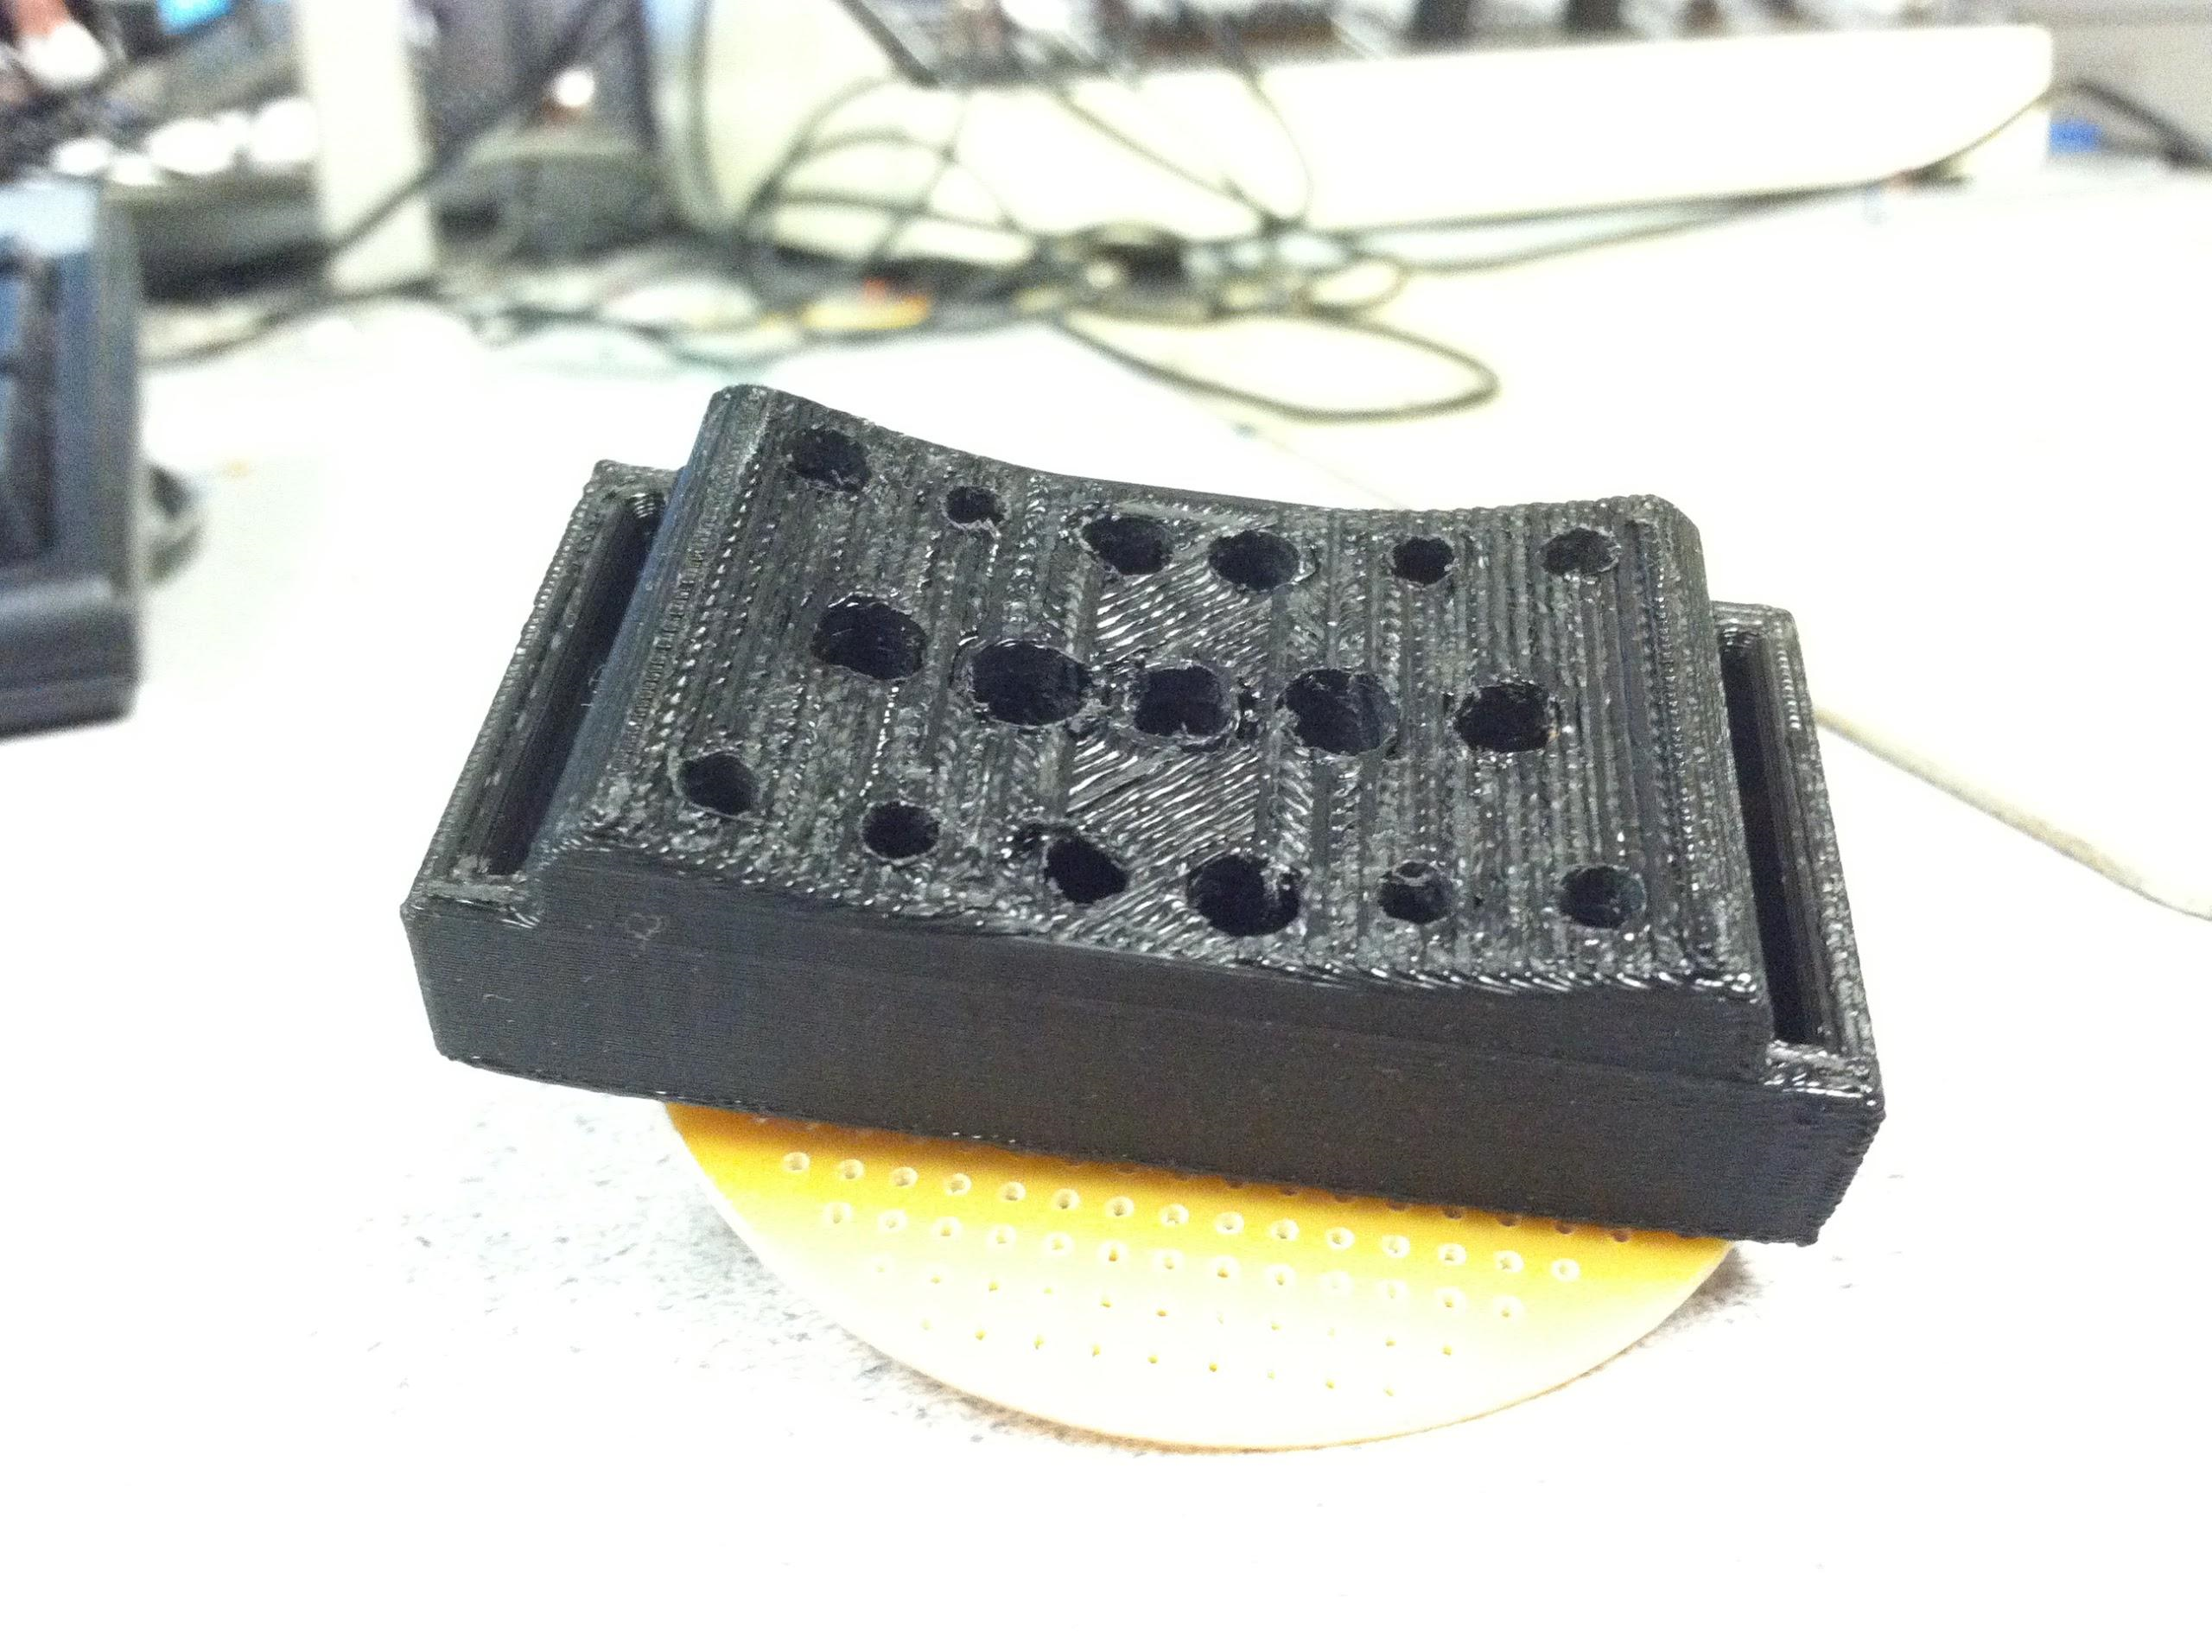
Figure 2. IRs and Phototransistors Housing
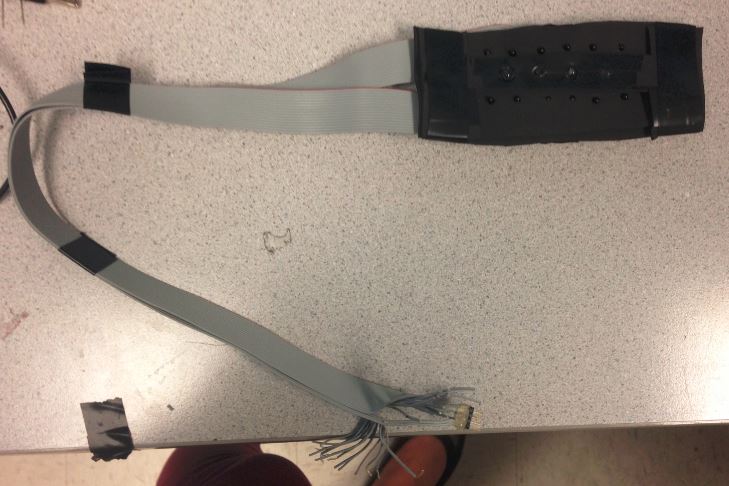
Figure 3. Flexible IRs and Phototransistors Housing
Figure 4 shows the EMG circuit which was our second design idea. The wet electrodes are coupled to the circuit via two 1uF capacitors. By capacitively coupling the inputs, we eliminate any possibility of DC current flowing through the user while severely increasing the AC impedance, thus reducing possible AC current through the user, even though the circuit is electrically isolated from ground. The signal passes through a two-stage passive band-pass filter before the pre-amp. We used an instrumentation amplifier INA121 with gain of 22 as our first stage amplifier. Using its low input bias current (3fA) and high common-mode rejection (84dB), this initial amplification stage increased the SNR enough for further amplification. This signal then passes through an additional passive filtering stage before two non-inverting amplifiers. The final signal is high pass filtered and level shifted to around 1.5V, which allows it to pass effectively through the optical isolator. After having a good signal for one channel, we decided to duplicate that circuit for three more channels. However, after wiring 2 more circuits, the signal was no longer there. We attempted troubleshooting but we failed in receiving any valid signals after that. As a result, we moved on to our most recent idea: Biometric Sensing Computer Mouse.
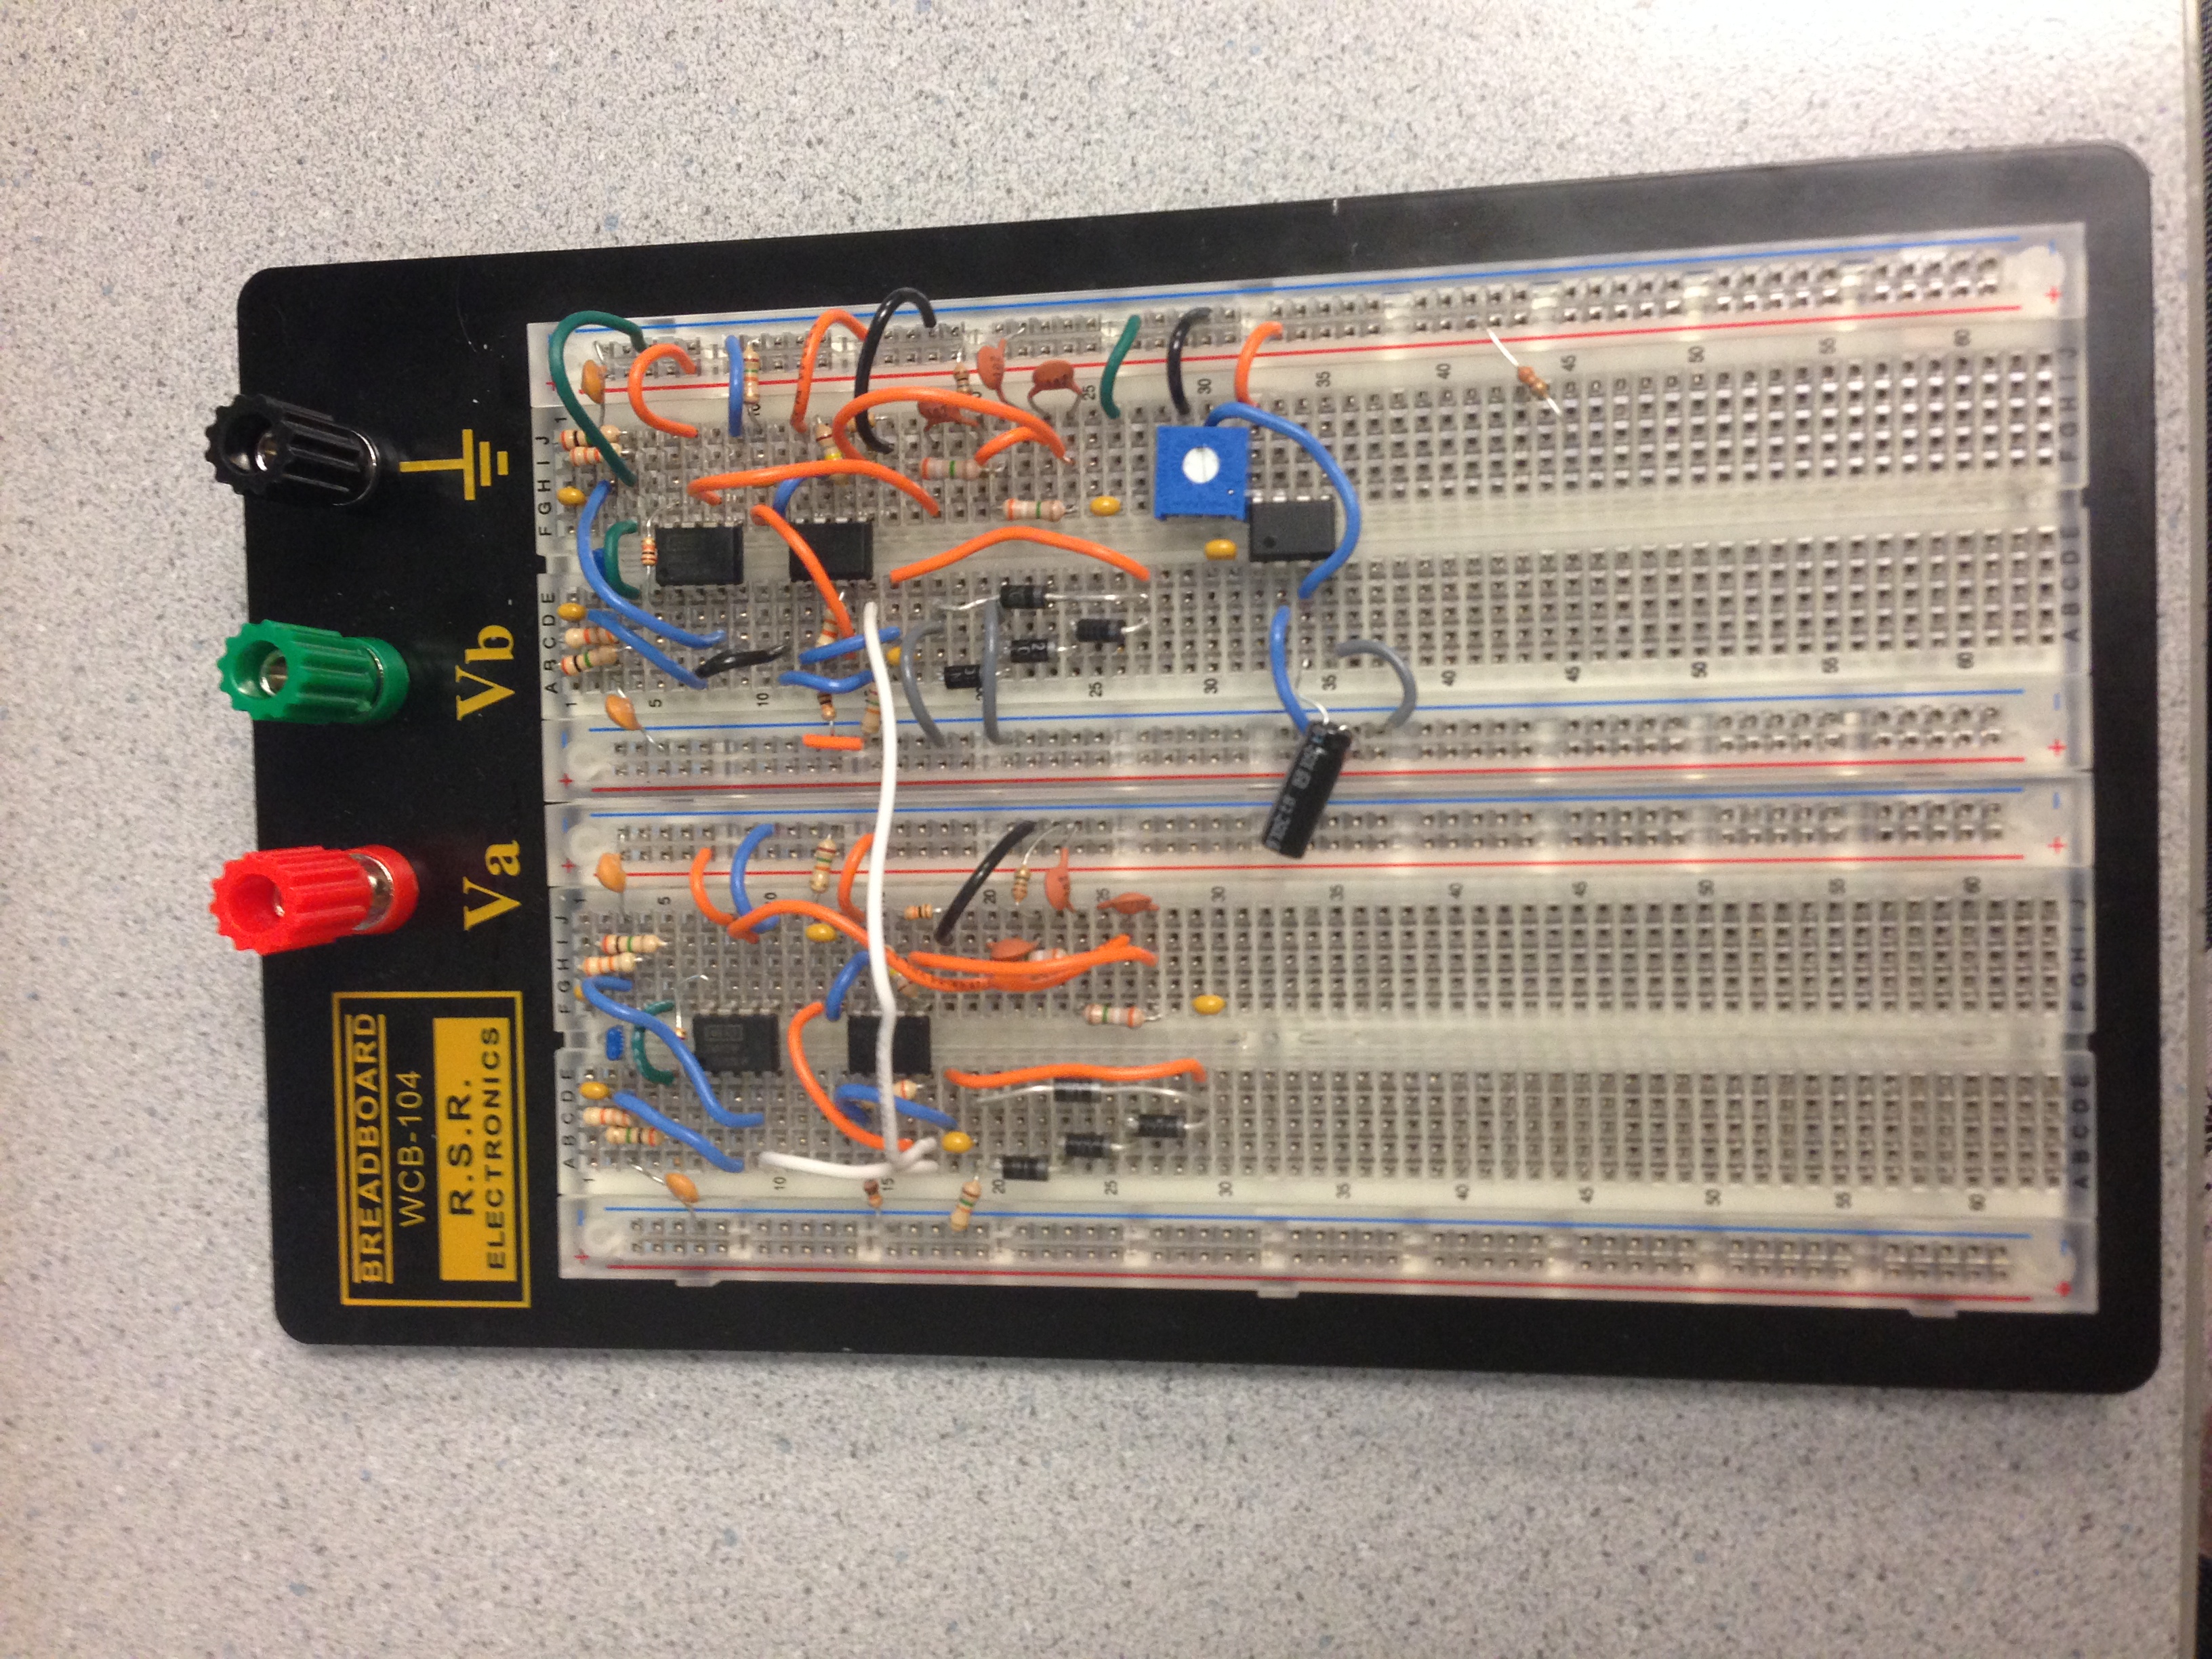
Figure 4. EMG Idea Hardware
Components
Design Idea 1: Optical Sensor
IR and Phototransistors Housing
In this system, we used 6 IRs and 12 Phototransistors. We organized these equipments as between two rows of Phototransistors, there was a row of IRs. While making the housing, we decided to have the IRs and Phototransistors that are on the side to be slightly higher than others. In other words, we would like to create a dip at the center of the housing so that it fits well to user’s wrist.
INA121
The INA121 was used as a pre-amp in this system. As an instrumentation amplifier, it has the characteristics of having a very high common mode rejection ratio and a high input impedance. This INA121 also has internal load limiting diodes that drain off excess current in the case of overvoltage. A gain of 1.05 was used for this stage with a feedback resistor of 1M Ohms. The gain formula for the INA121 is gain = 50k/Rg + 1. This amplifier was used to acquire the signals.
Design Idea 2: EMG Circuit
Electrodes and Passive Filtering
The electrodes used in our system are Uni-Patch Specialty Electrode from Covidien. Both electrodes are coated with electrode gel before being attached to user’s skin area. One electrode will be placed on a single arm muscle while the other is on the elbow for grounding. In order to contract the muscle , the user pushes on the desk bottom. In contrast to relax their muscle, user is asked to straighten their arm. In attempt to produce muscle force, there is an exchange of ions across muscle fibre membranes resulting in small electrical current signaling the muscle fibres to contract. By having the electrode applied on the skin surface, the signal off the muscle, EMG, can be measured. The signal is capacitively coupled to the passive filter stage, which is tuned to a 0.16Hz high pass filter and a low pass filter for 3.3kHz.
INA121
The INA121 was used as a pre-amp in this system. As an instrumentation amplifier, it has the characteristics of having a very high common mode rejection ratio and a high input impedance. This INA121 also has internal load limiting diodes that drain off excess current in the case of overvoltage. The instrumentation amp reference voltage was connected to the feedback of an LM358 tuned to a 1Hz low pass filter. This in effect subtracts the low pass signal resulting in a high pass signal. A gain of 22 was used for this stage with a feedback resistor of 2.4KOhms. The gain formula for the INA121 is gain = 50k/Rg + 1. This amplifier was used to acquire the signals.
LM358 amplification
Two LM358 were used as non-inverting amplifiers for signal before it gets to the ADC. A total gain of 250 was established in this stage. In order to satisfy the requirement for the optical isolator to be purely positive, the final output of the amplification stage went through a level shifter to provide a DC offset of 1.5V. This was achieved by buffering a voltage divider voltage and using it as a reference ground for a passive high pass filter.
IL300 optical isolation
The isolation circuit used an amplifier to with servo feedback to drive the internal LED in the IL300. The negative terminal of the input amplifier is set at a voltage dependent on the current Ip1 multiplied by the value of R1. This feedback thus ensures the current If flowing through the LED emitter is throttled such that the optical receivers have enough current to transfer the original signal without distortion. The values of R1 and R2 determine the total gain of the subsystem. The ratio R2/R1 is directly proportional to the gain of the signal measured at Vout. We chose values that would fit within the voltage swing allowed by the LM358 amplifiers we were using. Since the LEDs worked in one direction, there were several limitations to the optical amplifier. Mainly, negative signals were cut off and could not be transmitted across the optical isolator, and as a result the signals were DC offset. This resulted 50% loss in effective resolution. However, this was acceptable for the final results.

Figure 7. Circuit of IL300 optical isolation
DCP010515 isolated power supply
The isolated power supply was used for the most of the circuit besides the non-isolated side of the optical isolator. It sourced an isolated +12V, -12V, and 0V signal. The output of the isolated power supply was slightly noisy due to the internal oscillator, and as a result 10uF and .1uF capacitors were added to reduce this noise. Additional capacitors were added near amplifiers and consumers of high current in order to maintain a consistent voltage supply for all components.
Hardware Testing
Design Idea 1: Optical Sensor
To verify the proper functionality of our circuit, we probed directly to the outlet of INA 121 for a single channel. Then we moved each finger individually to see whether there was any difference in the oscilloscope signals from the optical sensor. Since it was clear that each finger could be differentiated by a single optical channel circuit, we scaled the number of circuits to six channels. However, interference from multiple LEDs resulted in saturation in multiple channels of the optical sensors. As a result we modified our approach to time multiplex the activation of each LED. Ideally this approach would allow for 30 different measurements to be taken, with six sensor values for each activation of one of the five LEDs. However, since at this point we could no longer detect valid signals, we stopped using the optical approach.
Design Idea 2: EMG Circuit
To verify proper functionality of our circuit, we systematically tested each stage separately. Using an oscilloscope, we confirmed proper functionality of the isolated power supply, making sure to reduce noise on the power lines to achieve more consistent signals. Different loads were tested on this power supply to ensure the power supply would remain consistent with burst loads.
We then tested the proper frequency response of the INA121 circuit with the low pass feedback. In order to verify the pre-amp stage worked properly, we measured the signal of a function generator across a voltage divider. After we confirmed the signal was properly amplified through the capacitive coupling and pre-amp, we tested to make sure we could pick up an ECG signal from the human body using the capacitive electrodes. This was done initially without the isolated power supply in order to test the validity of the circuit without endangering the test subject. The same tests were then performed using the isolated power supply, making sure that the signal was still acceptable and identical to that measured before with the un-isolated power supply.
The optical isolator was first tested by measuring the output voltage through a resistor based on a signal input through the emitter LED. The value of the input resistor was varied until the voltage measured across the output resistor was similar to that of the input signal. The servo feedback was added, and the value of R1 was tuned until the input signal at the output of the feedback amplifier was equivalent to that of the original signal. The output gain was then adjusted until the optical isolation circuit worked within the acceptable voltage swing of the LM358 op amps. After it was discovered that the optical isolator did not transmit signals that were in the negative range, a DC offset was added to the amplifier circuit. This DC value was varied in order to ensure the output signal would remain within range.
With the optical isolator functioning correctly, we tested the circuit with the wet electrodes connected to the bicep and elbow as ground. Using this setup, we were able to effectively detect action potentials from the muscles.
Software Design
Embedded Software
Design Idea 1 and 2: Optical/EMG GestureDetector
The software stack used for the biosensing mouse was very similar to that used for the gesture detector. The Arduino design environment as well as the Atmega 2560 microcontroller was used for development, and Processing was used for the development of the PC application. The embedded code primarily read values from the ADC. Multiple sequences were tested in order to measure the optical sensor values with different combinations of stimulating IR LEDs. That is, the LEDs were time multiplexed in order to measure from different sensors and avoid saturation on the optical sensor channels. The intensities of the LEDs were also variable via low-pass filtered pulse-width modulation. The intensities of the LEDs were varied via the PC side graphical user interface.
For the PC applications, the integrated ControlP5 library was used (developed by Andreas Schlegel) was used to create the GUI for this application. Three separate PC applications were created for this portion of the project. handTrackerVis is shown in the figure below, which includes the training of the machine learning classifier as well as a visual input to visualize the sensor channels while testing. Five buttons on the top of the GUI allow a user to indicate what fingers the user is moving. The “record value” button prints the analog sensing values as well as the fingers selected to a comma separated value (.csv) file, which is later referenced by the machine learning classifier. The white bars correspond to the six optical sensor pairs on the sensing hardware, while the five selection bars on the right side of the GUI vary the LED output intensity via the microcontroller.
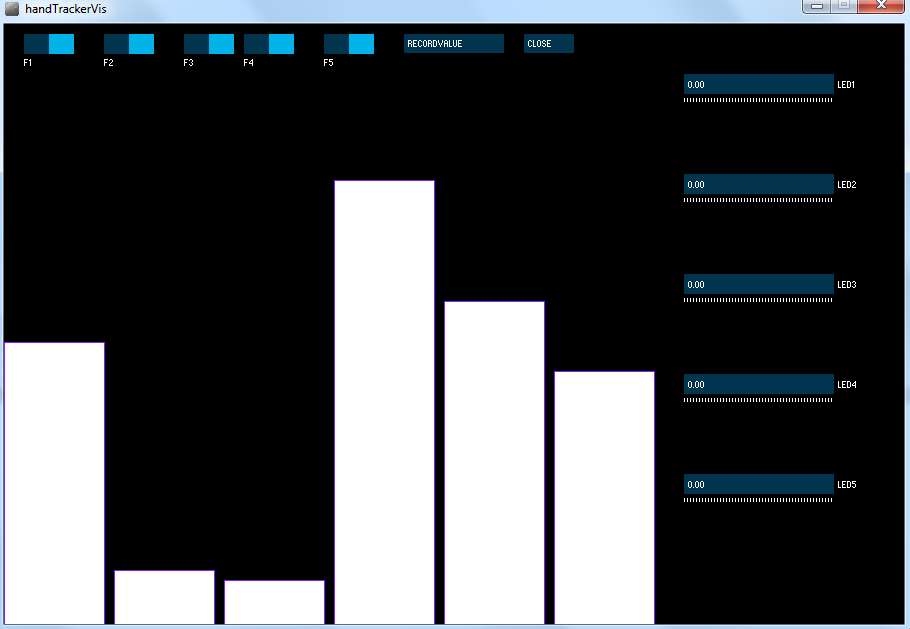
Figure 8. The handTrackerVis GUI to record hand position and optical sensor values. Each white bar corresponds to an optical sensor value, while the selection bars on the right side control the intensity of each of the five stimulating infrared LEDs on the sensor.
In addition to the data acquisition GUI, another application called handTrackerSVM was developed to utilize the values recorded by the sensor to train a support vector machine (SVM) for machine learning classification. A SVM works by separating a search space using multiple hyperplanes. Based on ground truth and recorded sensor values, the SVM can classify which fingers are contracted based on new sensor values. We use these results to measure the effectiveness of the SVM in sensing hand position.
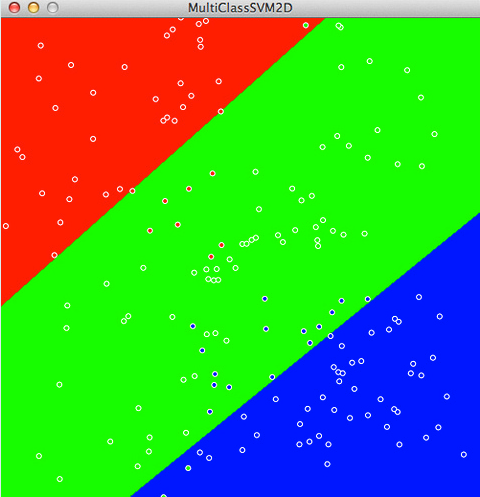
Figure 9. Visualization on the SVM operation, in which SVM separates a search space using multiple hyperplanes. These results then are used to measure the effectiveness of the SVM in sensing hand position.
The final application, handTrackerPiano, uses the values streamed from the microcontroller to play a piano based on the optical sensor values. This application uses the open source SoundCipher library for Processing, which provides an interface to play instrumental tones. In this case, the application uses piano tones from middle C to G (261 - 392 Hz) in five whole note steps. Each tone is played when the corresponding finger on the hand is contracted, similar to a real piano. The hand positions are also determined via SVM.
Software Testing
The software developed for the gesture detector was actually developed in order to visualize and debug the analog circuitry of the device. The software was developed before the hardware in order to verify functionality of the analog circuit and ensure that the signals for different hand positions could be differentiated. The GUI was first tested, before the other functionalities such as the CSV file writing and real-time LED adjustment were added. The SVM application was tested with known test data to ensure the SVM was functional. However, since the hardware was bugged before we could acquire any valid data, the SVM was never tested on actual hand position optical sensor data. The piano application was tested by manually triggering the input values to produce sounds. Testing was completed by ear to make sure the piano worked properly.
Biometric Sensing Computer Mouse top
Hardware Design
Operational Description
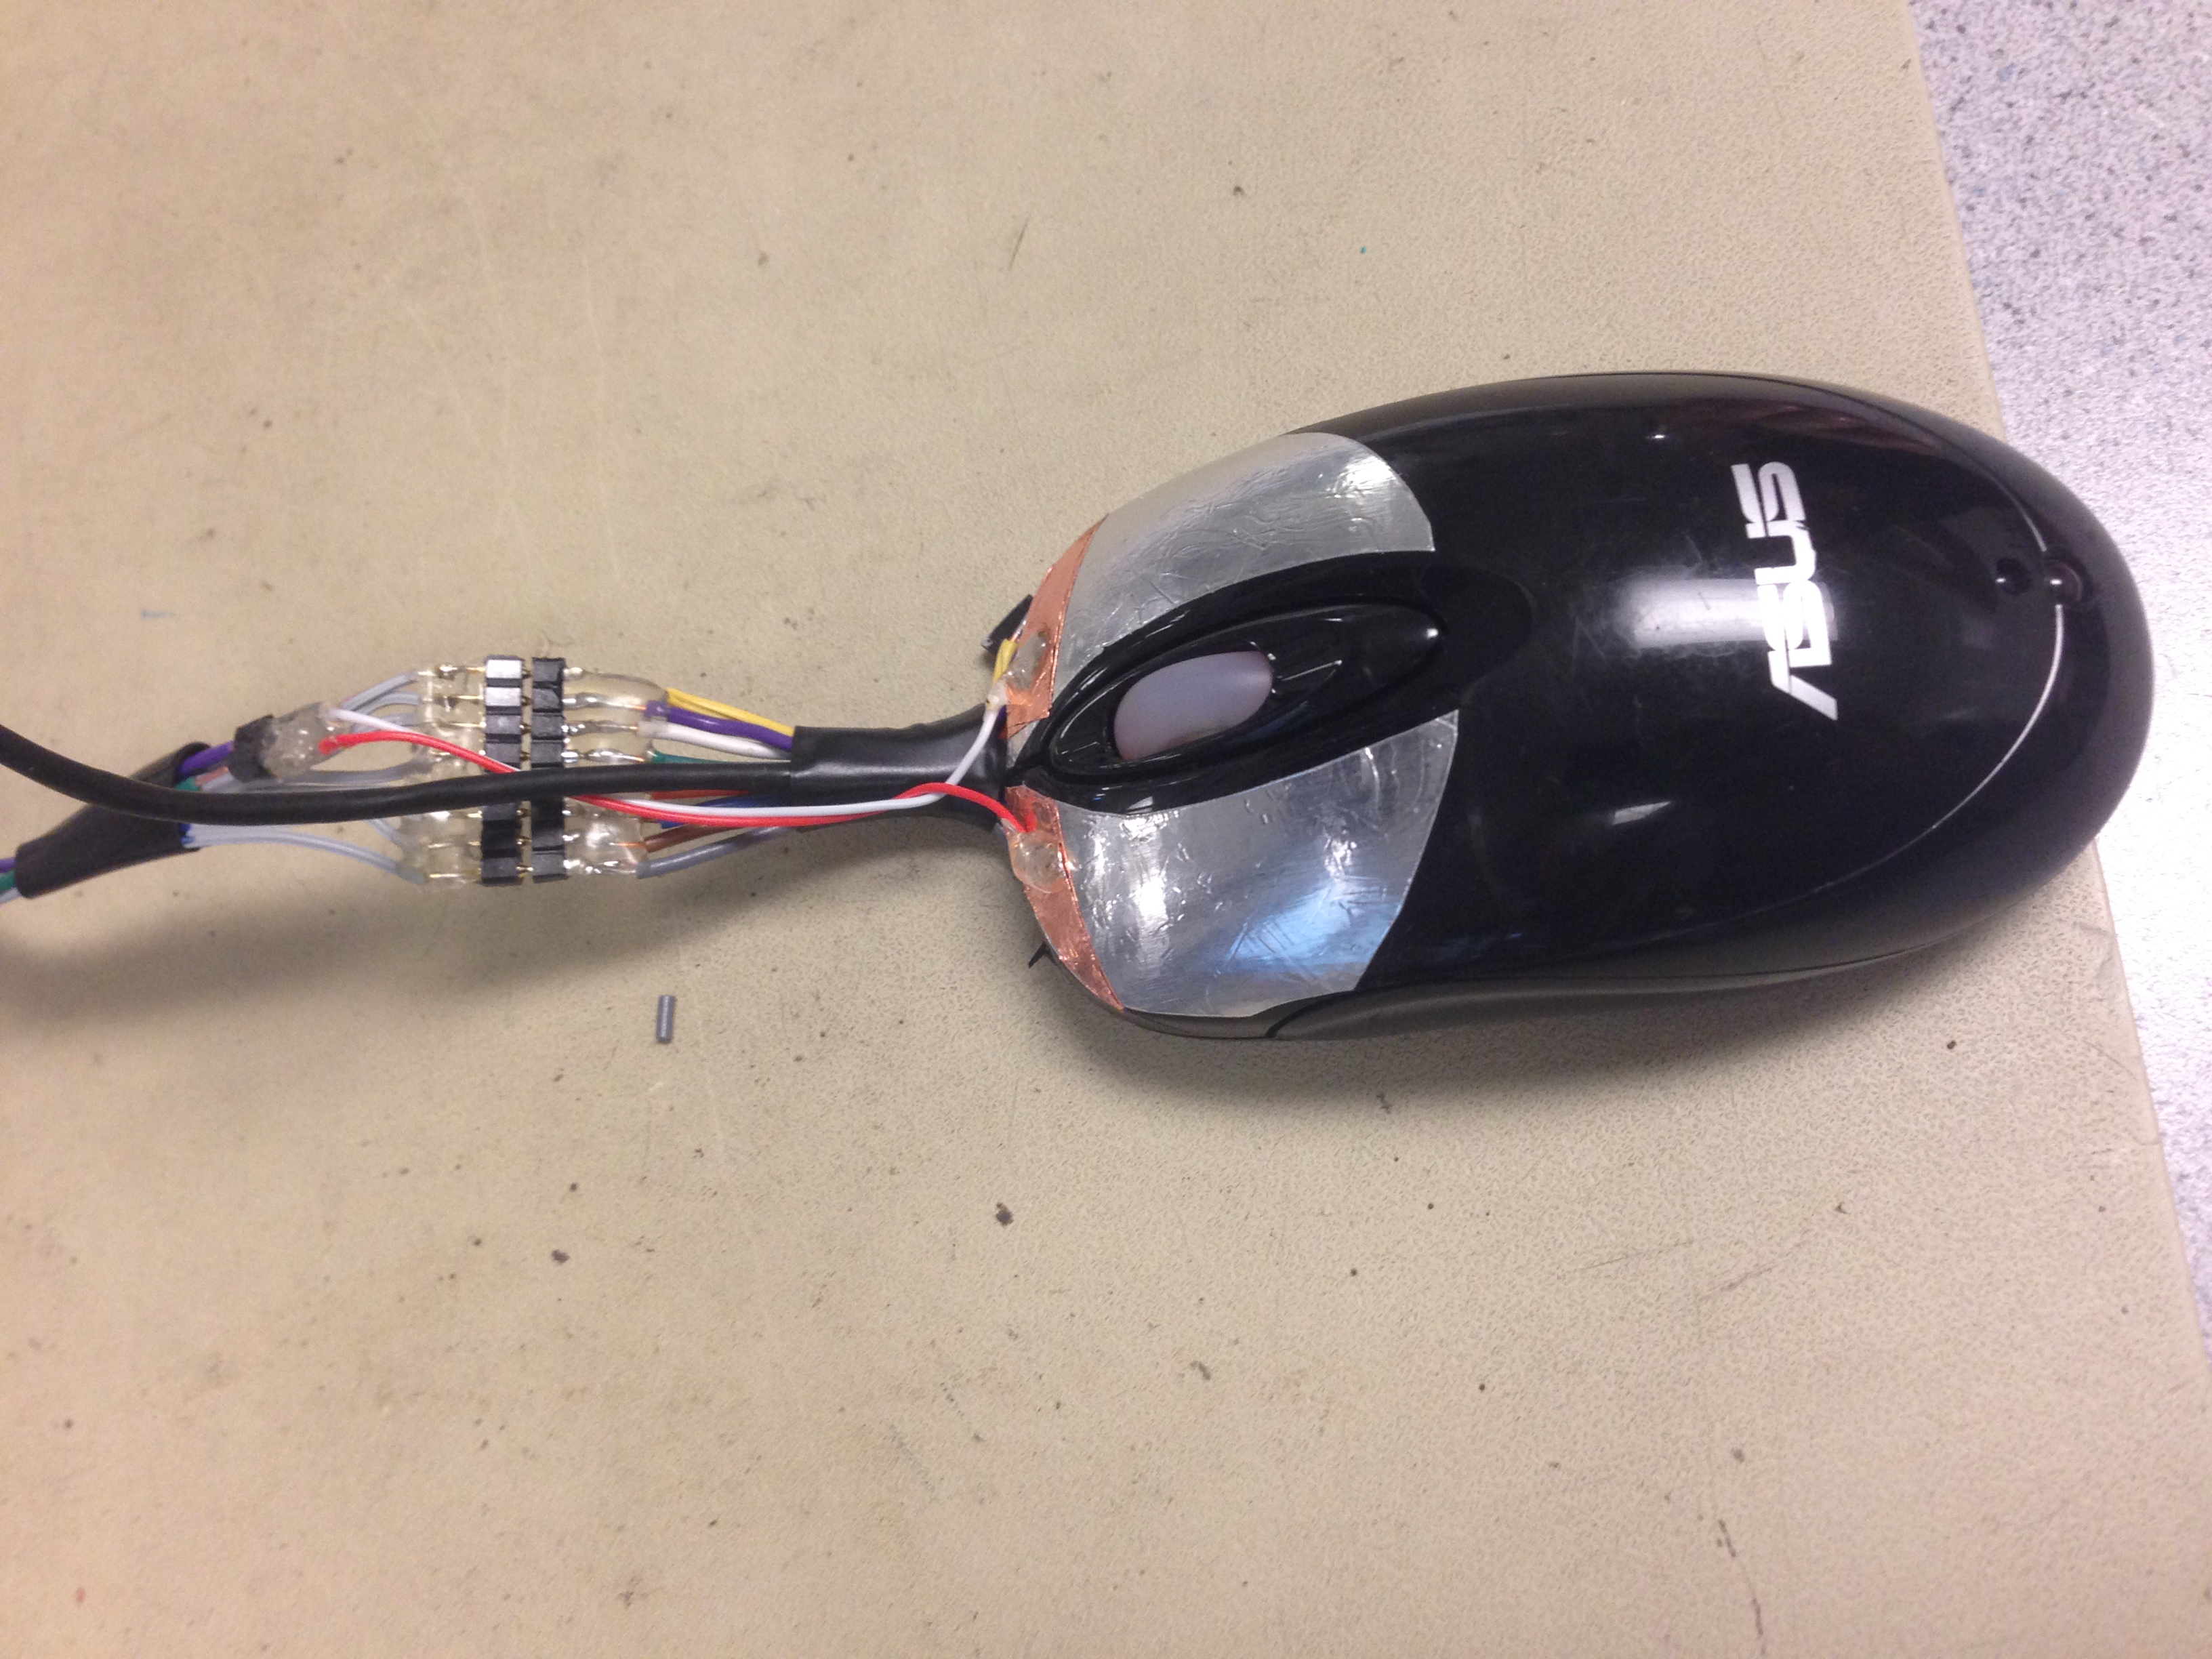
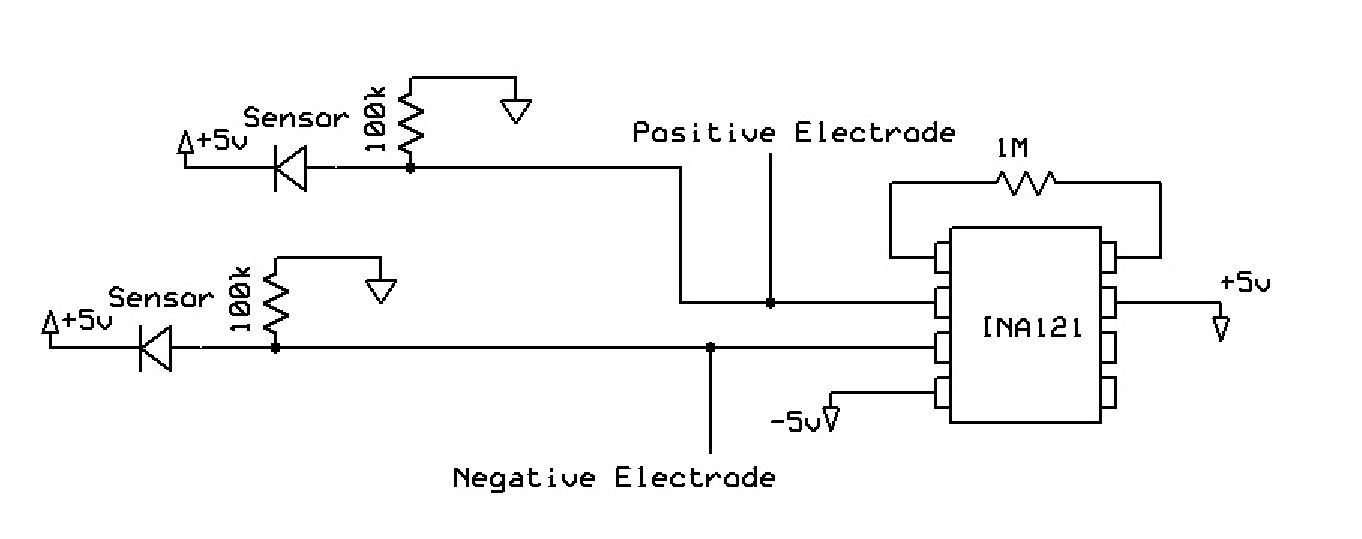
In this design, illustrated in Figure 5 and 6, the skin surface resistance, which is the galvanic skin response, is measured by the use of 2 electrode pads where the index and middle fingers lay. This uses a basic resistive divider style circuit, where the leads are measured by an instrumentation amplifier in order to provide extremely high input impedance for unskewed measurement. At the same time, the pulse rate in the palm of user’s hand is also measured by the use of infrared LED and phototransistor. Then the signal is processed by a differential amplifier and filter. In addition, a vibrating motor is used to alert the user of his/her heart beat and autonomic nervous system. This motor is directly driven by the microcontroller output. The role of the Arduino in our design is to take analog-to-digital measurements from the amplified signal.

Figure 5. Biometric Sensing Computer Mouse
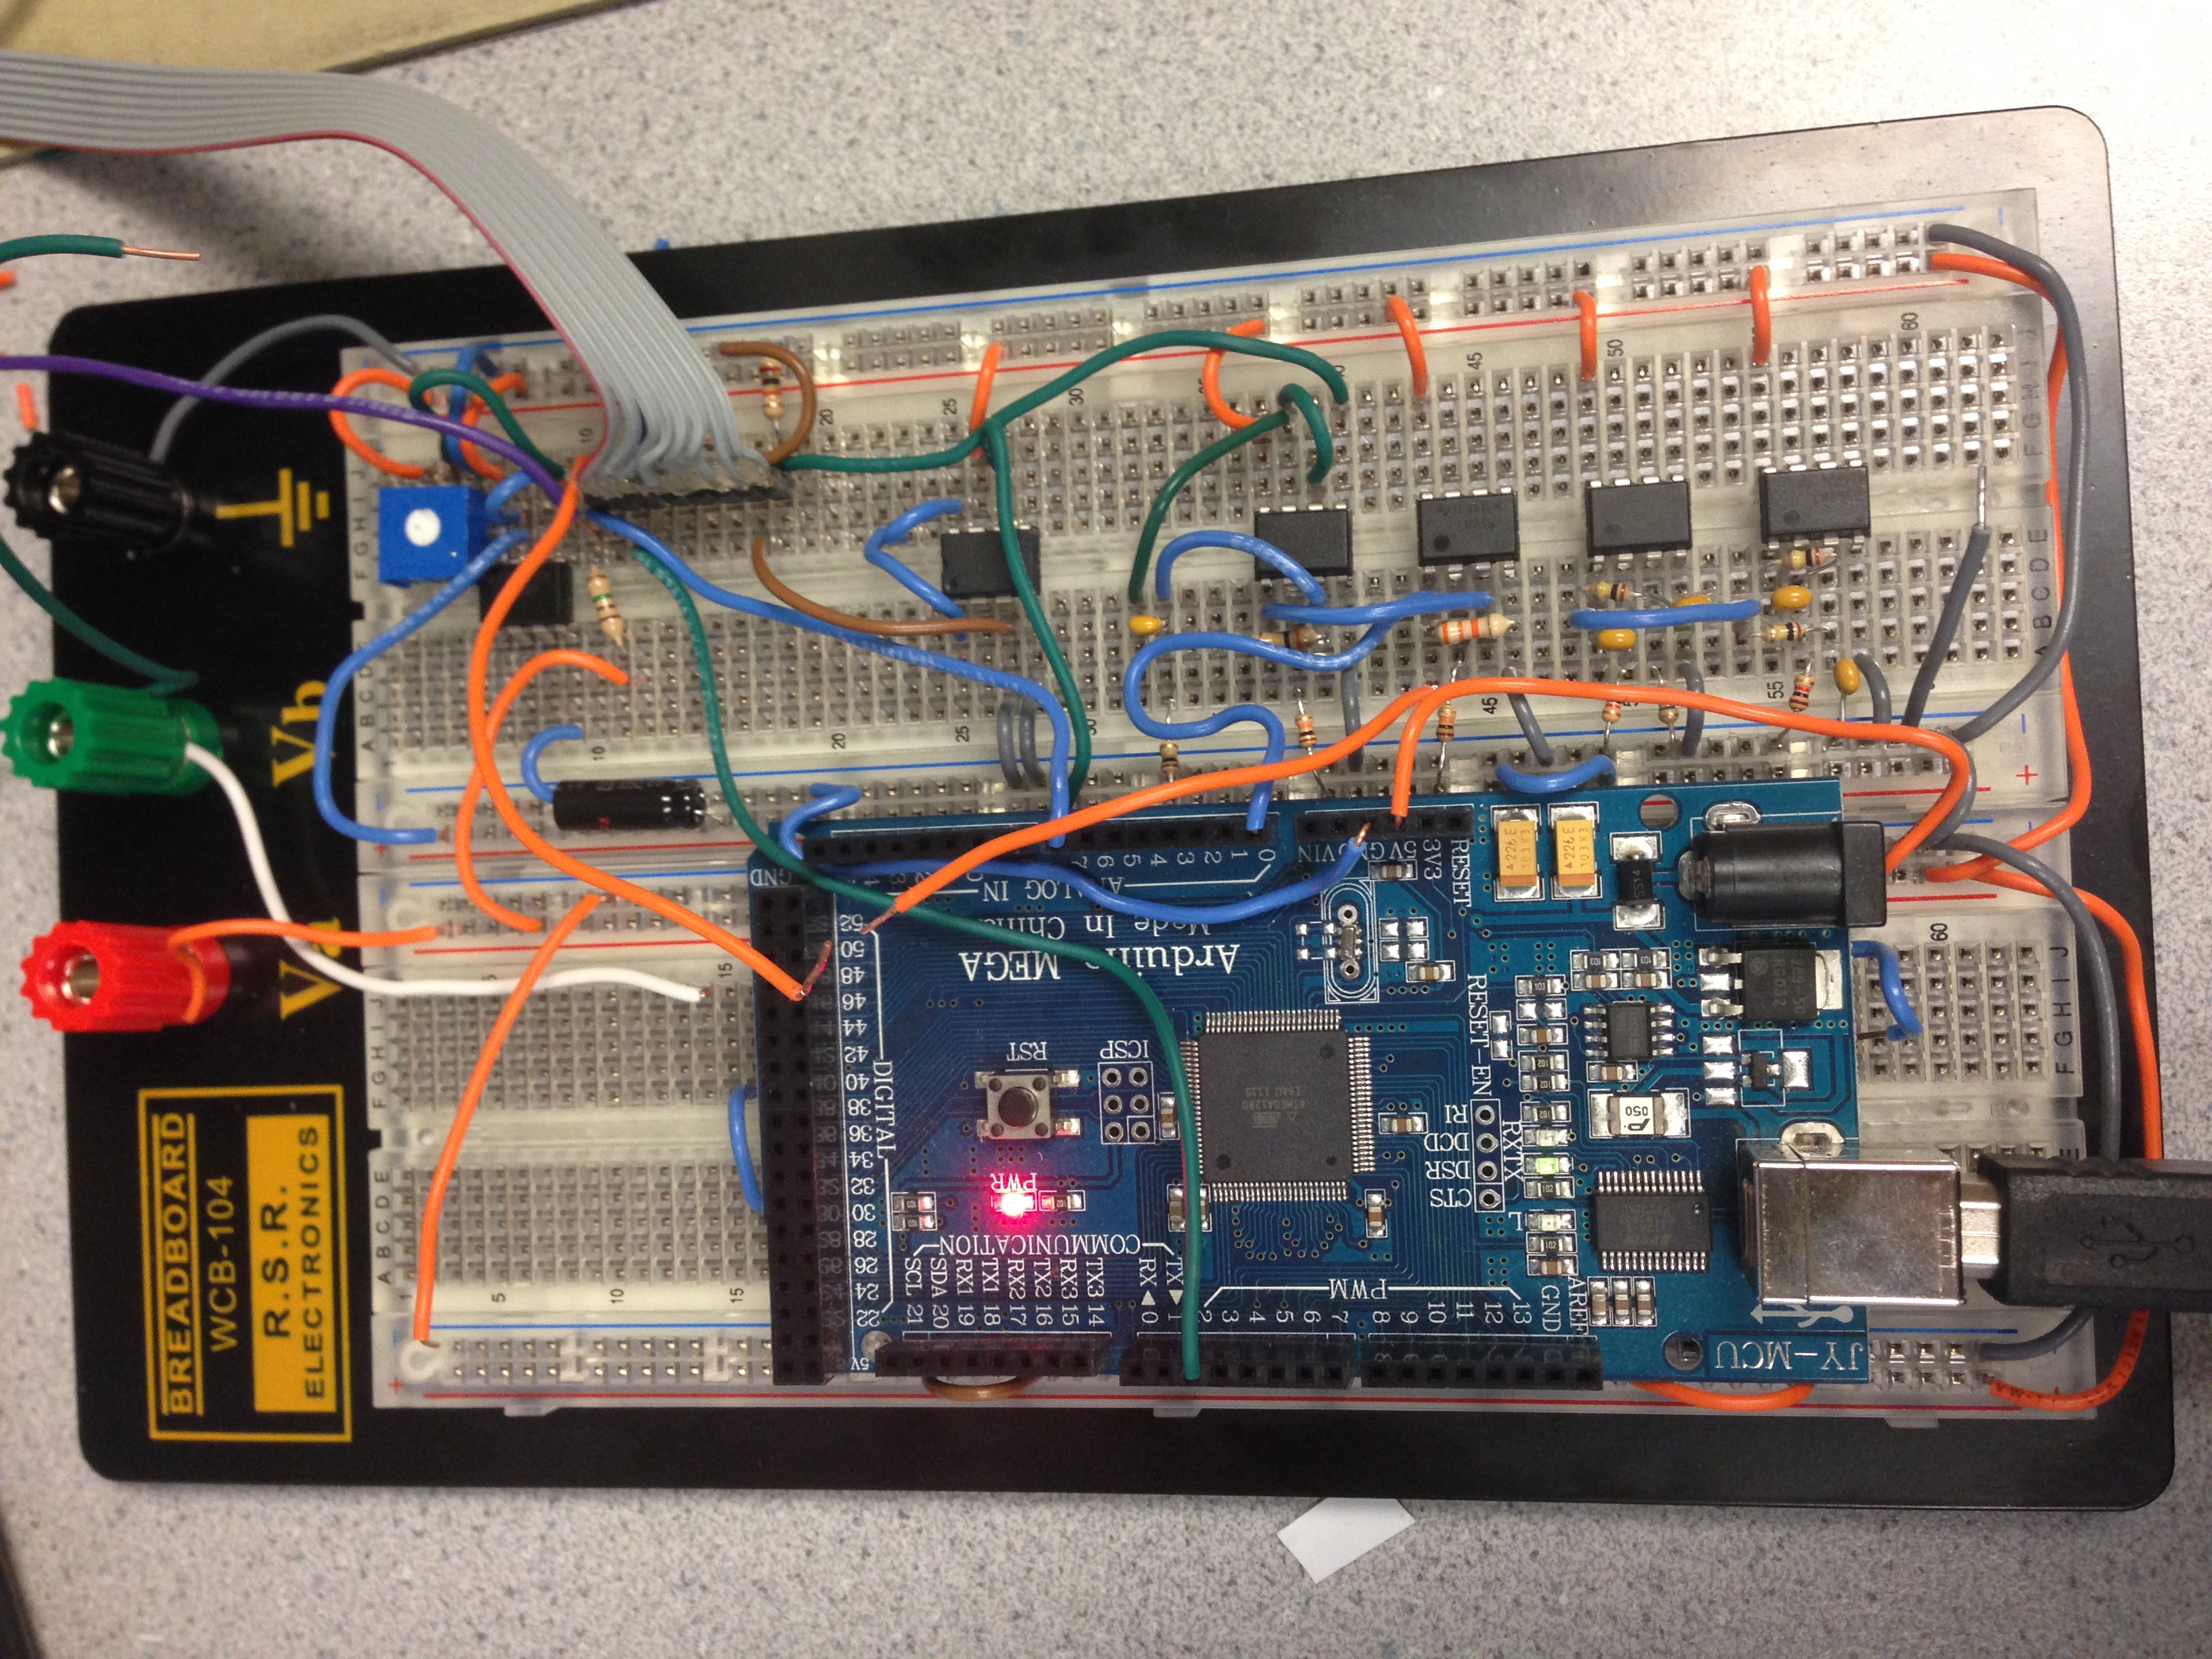
Figure 6. Galvanic Skin Response Device Circuit
Components
Mouse
The mouse component consists of 2 electrode pads where the index and middle fingers lay to measure a galvanic skin response. At the base of the mouse is an infrared LED and PNZ150-ND NPN phototransistor to measure the user’s pulse rate in the palm of his or her hand. Within the mouse is a vibrating disc motor that pulses at the heart rate of the user.
Arduino
An arduino is used to take analog-to-digital measurements from the differential amplifier and the amplifier. We used the onboard 6 channel analog-to-digital (A/D) converter of the Atmega controllers for Arduino to read the analog sensors. This converter has 10 bit resolution and returning integers from 0 to 1023.
INA121
The INA121 was used as a pre-amp in this system. As an instrumentation amplifier, it has the characteristics of having a very high common mode rejection ratio and a high input impedance. This INA121 also has internal load limiting diodes that drain off excess current in the case of overvoltage. The instrumentation amp reference voltage was connected to the feedback of an LM358 tuned to a 1Hz low pass filter. This in effect subtracts the low pass signal resulting in a high pass signal. A gain of 1.05 was used for this stage with a feedback resistor of 1M. The gain formula for the INA121 is gain = 50k/Rg + 1. This amplifier was used to acquire the signals.
Filters/Amplifier
We used three types of filters in this design. To remove the DC offset from amplification, we used a passive low pass filter (cutoff frequency is at 10 Hz) before the input to our first amplification stage. An active bandpass filter/amplification stage as well as several passive low pass filters were used to remove 100 Hz noise from overhead lights. We bandpassed our signal so only frequencies between 1Hz and 8Hz could pass through. We used two gain stages with 30 gain each to increase the input signal to the ADC for easier peak detection. We split the gain stage into 2 op amps because 100 gain in a single stage saturated our signal.
Vibrating Motor
A 28821 Parallax vibration motor was used in this design to notify the user of his/her autonomic nervous system. It was directly controlled by the 5V logic signal from the microcontroller. Capacitors were added to the leads of the motor to provide some degree of noise back-emf reduction. However, the operation of the motor provided enough noise to render the analog measurements useless while the motor was running.
Hardware Testing
To verify the proper the functionality of the circuit, we used the Ohmmeter to check the resistance measured across the index and middle fingers. The hardware was also tested with the Falldown Game. As the user was playing the game, we confirmed our hypothesis that there is a decrease in resistance of the GSR (corresponding to increased perspiration) over time as the user gets more stressed. The heart rate was tested individually before installation into the mouse to verify functionality. All components were loaded into the mouse and mechanical functionality was tested before electrical connections were wired. Different values of series resistance were also tested to tune the output of the GSR signal to be within range.
Software Design
Embedded Software
For this project, the Arduino design environment was used for the microcontroller development. An Arduino Mega 2560 was used (utilizing the Atmega 2560 chip) for the signal acquisition and actuation of the vibrating motors. Heart rate detection was implemented on the device using thresholding with amplitude and temporal hysteresis. Values from the optical and GSR circuit are read via the analog to digital converter, and the signals are kept in a small buffer. A heart rate is registered when the value increases past the threshold value, in this case 4V. A counter is started in order to measure the time since the peak in the optical signal was measured. The microcontroller continues to read the analog signals at 100Hz until a the next beat is detected. A limit on the time before the next detected peak prevents registration of false or wide peaks by waiting for .3s before allowing the next detected peak. This puts the upper bound for measured heartbeats at 180bpm, which is far above the intended maximum value to be measured using this device.
Upon a registration of a heartbeat, the beats per minute (BPM) information is calculated and sent along with the GSR readings to the PC side software through a serial connection. The Arduino microcontroller shows up as a standard COM port on the PC side, and the values are read 8-bit ASCII increments. The Arduino sends strings through the serial connection with the comma delimited encoded sensor and heart rate values, which are sent as serial events.
PC Side Software
The PC side software was written in Java with the open-source Processing design environment. The Processing environment is particularly useful for visual applications, and many open-source contributed libraries are available for use. For this project, the game was made by modifying another game written by Steve Dickie, a version of Falldown. Falldown is essentially a 1-D maze, where the user moves the mouse cursor to move a ball into a series of holes. The maze scrolls up, so the user must navigate through the holes to prevent the ball from reaching the top of the screen. Once the ball reaches the top of the screen, the game ends. The game was modified in this case to modulate the scrolling speed to the level of stress on the users part. In the ordinary version of the game, the speed of the scrolling increases with the score, so the maze becomes harder to navigate at later stages. The speed was linked to the user’s stress, so increases in stress (decreases in GSR resistance due to perspiration) resulted in an increasing scroll rate. This value was also modified to slow down the pace of the game as the user’s stress decreased. However this method was ineffective at producing large fluctuation in GSR since the user could remain calm and slow down the game to unstimulated levels.
The values from the microcontroller are passed into this program via the serial port. An initial starting sequence connects the COM port corresponding to the microcontroller with a serial connection. The buffer is configured to trigger a serial event upon the instance of a newline (\n) character. The serial event triggered allows the string transmitted by the serial buffer to be accepted, and the values are parsed into floating point values. The resulting values are used to modify the game and display on the game screen.

Figure 10. The game developed to vary stress levels. The ball is moved between the gaps in each level to prevent the ball from hitting the top of the screen, while the GSR and score are displayed on the top.
Low Level Software Description
The embedded software uses a single looping structure to read the values from the ADC. The time at each point in the loop is logged in order to provide a time base for the heart rate calculation. If a value is above the threshold, the current time is logged and the vibration motor is activated for 30mS. This allows the user to receive some feedback on his/her heartrate. Since the noise caused by the back-emf on the motor is great enough to significantly fluctuate the analog readings, no readings are taken during these 30mS and the microcontroller busy-waits until the time period ends. Following the vibration period, the heart rate is tracked in the method mentioned in the previous section.
					void loop()

					{

						curtime = millis();

						plethval = analogRead(A0);

						GSR = analogRead(A7);

						if (plethval < 300 && curtime > plethtime+400)

						{

							analogWrite(2, 255);

							delay(30);

							analogWrite(2, 0);

							heartrate = 60000/(curtime - plethtime);

							plethtime = curtime;

						}

						if(curtime > printtime+50)

						{

							printstuff();

							printtime = curtime;

						}


					}


					void printstuff(void)

					{

						Serial.print(heartrate);

						Serial.print(',');

						Serial.println(GSR);

					}
In the PC side application, the program receives serial strings from the microcontroller and parses them into appropriate values. The buffer is read until one instance of the newline character, and excess white space is trimmed. The string is then split by comma delimiters into the GSR and heart rate measurements. The analog voltage is converted into an impedance rating in ohms, and the GSR is shown. The value is then used to modify the speed of the game.
				void serialEvent (Serial myPort)

				{

					// get the ASCII string:

					String inString = myPort.readStringUntil('\n');


					if (inString != null)

					{

						// trim off any whitespace:

						inString = trim(inString);

						String[] q = splitTokens(inString, ",");


						// convert to an int and map to the screen height:

						inByte = parseInt(q[0]);

						inByte2 = parseInt(q[1]);

						inByte2 = (11*inByte2)/(1024-inByte2);


						if (GSR ==0) GSR = inByte2;

					}

					if(inByte2 < GSR || millis() > GSRtime + 3000)

					{

						GSRtime = millis();

						GSR=inByte2;

						s = s*1.03;

					} //else if (s > 1.2) s = s*.97;

				}
Software Testing
The biosensing mouse software was tested along with development to ensure functionality. The program was iteratively developed, where functions were added one at a time to ensure the program remained stable. For the embedded hardware, the correctness of the calculations was verified with a serial monitor and print statements. To ensure the heart rate and GSR measurements were correct and within range, results were simultaneously confirmed with a commercial optical heart rate tracker. The GSR was measured with a digital multimeter to confirm the accuracy of the skin resistance measurement. The PC side game was tested without connection to the microcontroller to ensure proper functionality. The serial communication was separately developed in order to verify correct function.
Results top
Speed of Execution
Our software design allows the galvanic skin response and the heart rate to be sampled at a rate of 100Hz. This allows a relatively continuous real time measurement of these values, adjusting values on the GUI almost instantaneously.
Accuracy
The heart rate measurement was accurate for specific situations. When a thumb was lightly pressed against the pulse oximeter portion of the mouse, the heart rate was accurate. This was checked by feeling one’s pulse in the carotid artery with one hand while feeling the rate of the vibrational pulses in the embedded disc motor within the mouse. If the thumb was pressed too firmly, blood flow was restricted from the thumb, resulting in poorer heart rate measurements. The heart rate measurement was inaccurate when measuring from the palm of one’s hand.
The galvanic skin response (GSR) was detected within 95% accuracy, which was checked using a digital multimeter. As predicted, the stress of the Falldown game decreased the user’s GSR readings for the duration of the game, as seen in Figure 11. The positioning of the hand and the pressure of the hand on the mouse electrode pads changed the GSR readings, as did the moisture content and temperature of the user’s index and middle fingers. For example, if the fingers were pressed more firmly on the pads, the GSR reading was lower. Another element that affected the GSR readings was the vibrational disc motor. When it vibrated, it created a magnetic field that altered the analog response of the GSR.
Safety
Safety was a primary concern throughout this project. A voltage difference of 5V was maintained between the two electrodes. With typical human resistance values ranging between 5MOhm to 100MOhm, only up to 1microA of current was run between the two electrode pads, which is within safety standards. According to the Occupational Safety and Health Administration, up to 5mA of current can be run through the human body safely.
All wires and connections were enclosed within the body of the mouse or insulate with hot glue or electrical tape to ensure patient and operator safety.
Interference with other's Designs
Due to the nature of our project, there should not be any interference with other people’s designs. The pulse oximeter of our design is covered by the user’s hand and should not be affected by external infrared light.
Useability
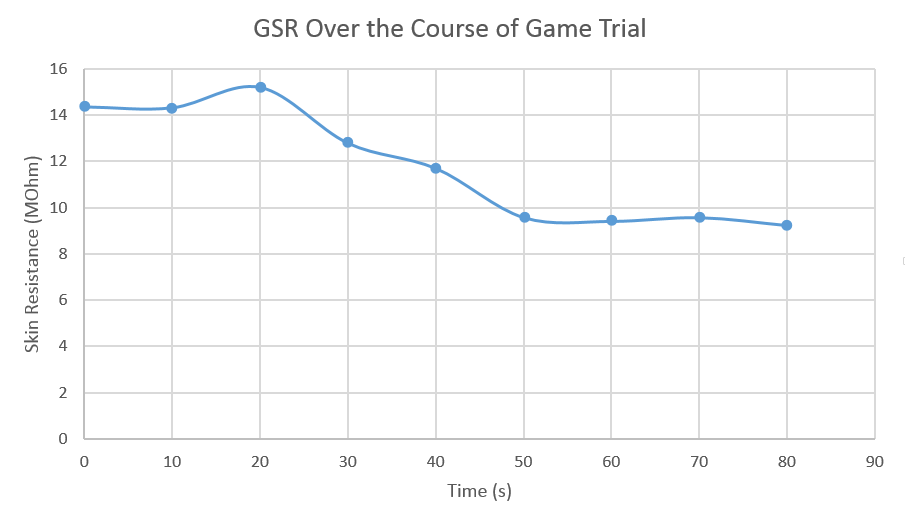
Figure 11. The change in skin resistance (MOhms) as time increases over the course of the game trial
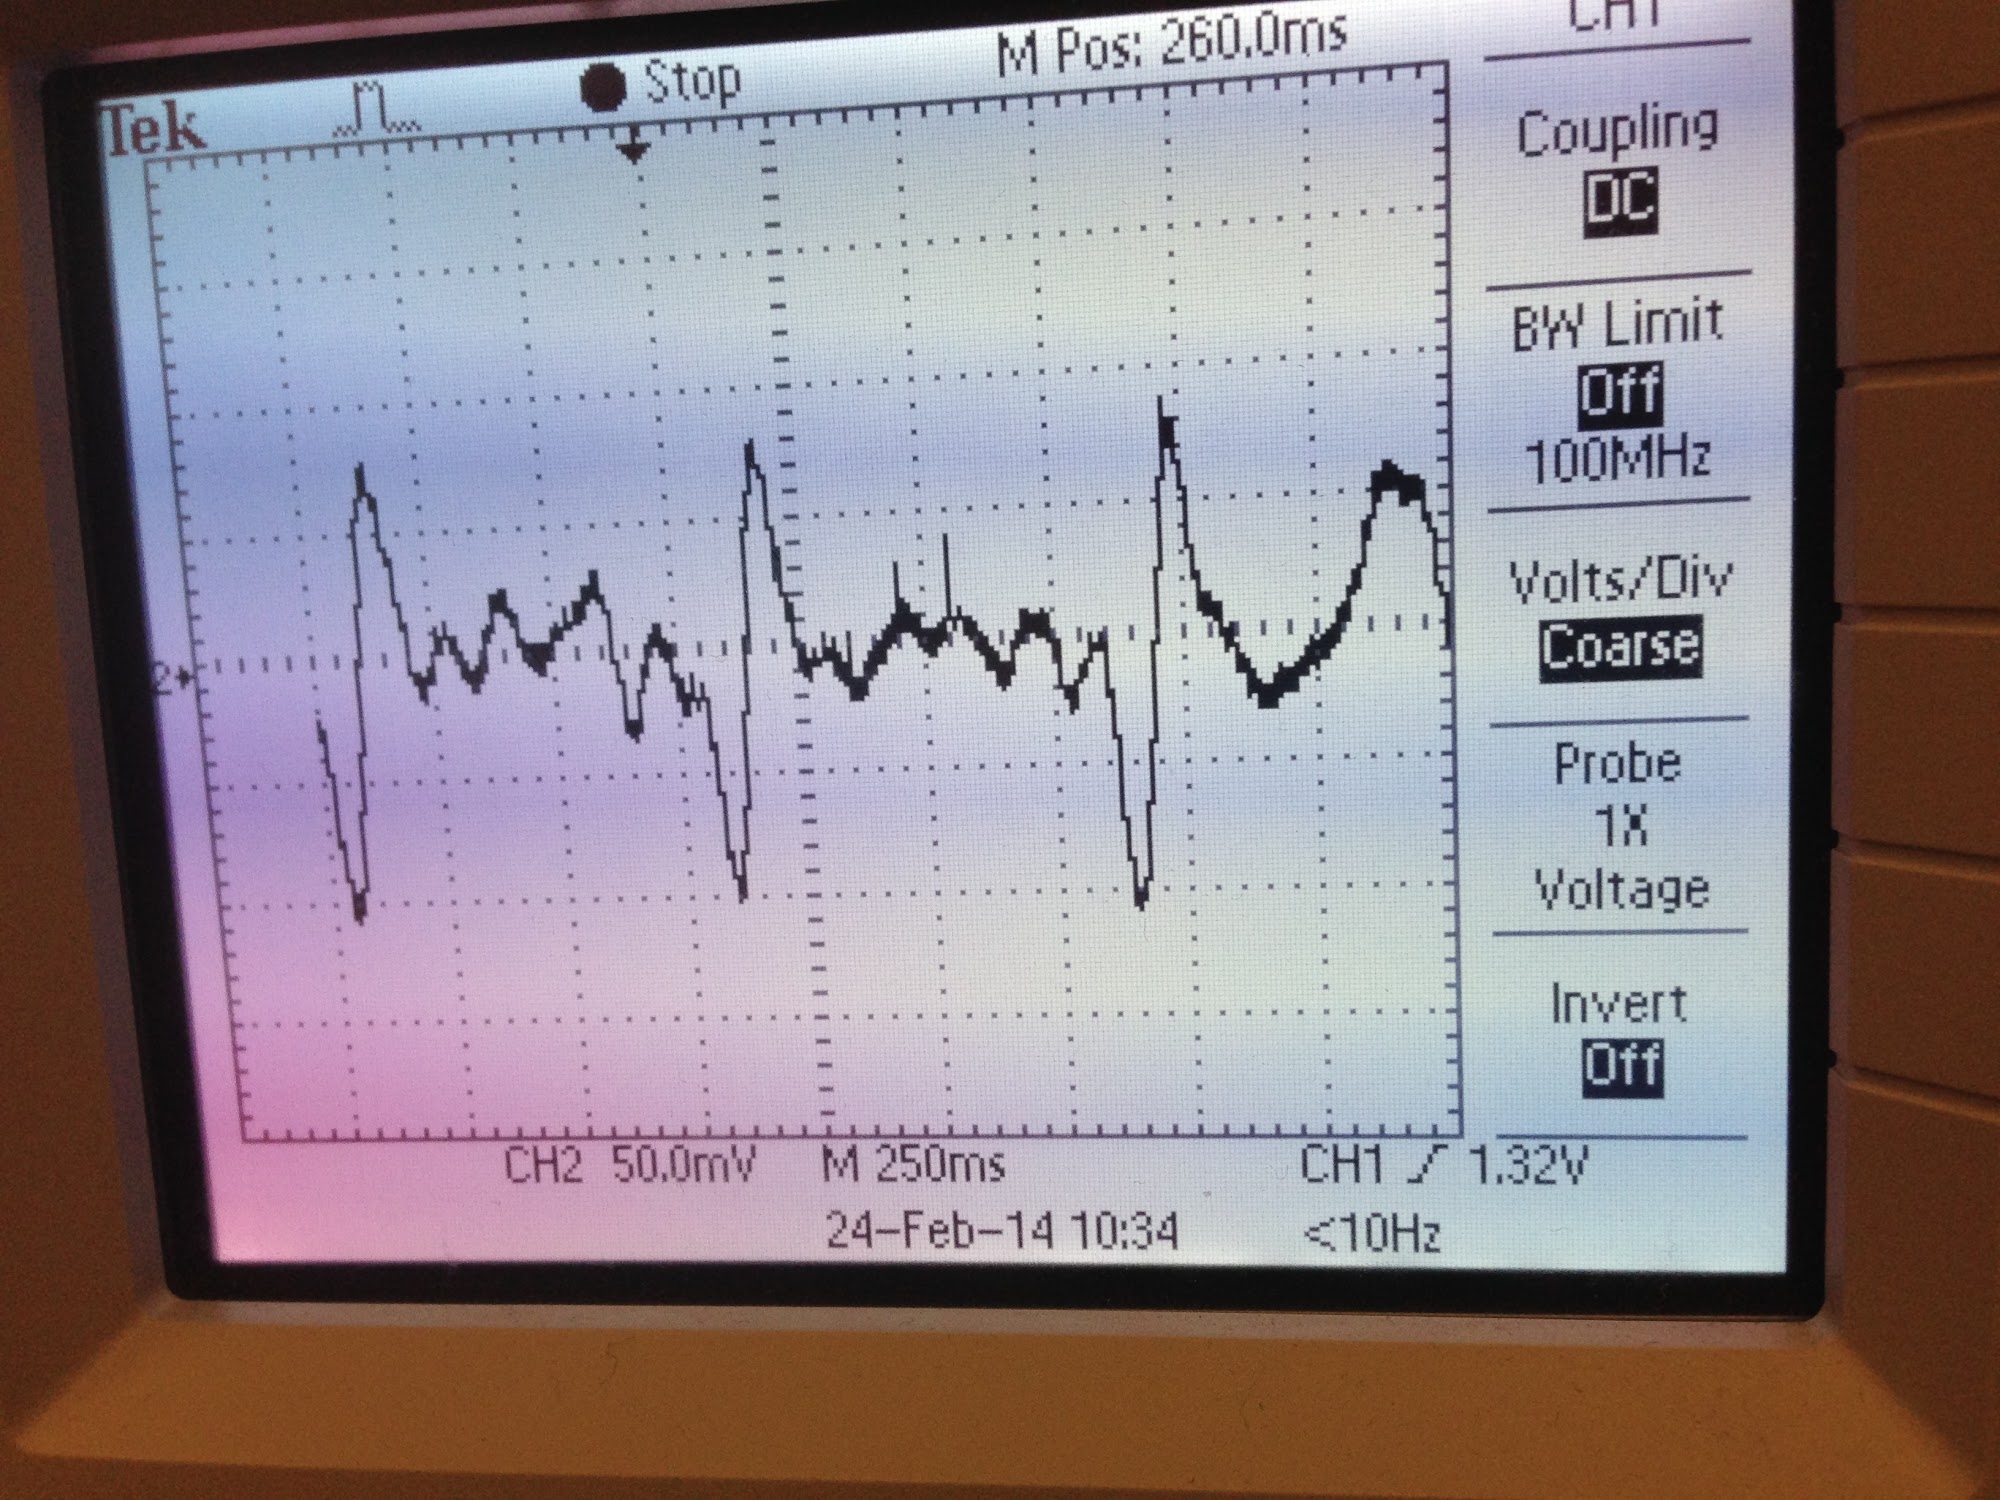
Figure 12. Signal collected from the Oscilloscope.
Conclusions top
Meeting of Expectations
While we were unable to complete our original project ideas, we were pleased with the functionality of our final design. The biometric sensing computer mouse was able to detect a user’s GSR, which allowed the software to detect the stress levels of a user. It was also able detect a user’s heart rate and to depict it using the embedded vibrational motor.
Things we would do Differently
With additional time and resources, this device could be further developed for more ergonomic and practical everyday use. For example, we could adjust the position of the pulse oximeter to be on the left side of the mouse where the thumb typically contacts a computer mouse. It is often difficult to detect blood flow in the palm of one’s hand - this change in position would increase the accuracy of heart rate readings.
We could also implement a temperature sensor on the mouse for additional biofeedback. This could then be incorporated with the Falldown game, perhaps as another factor for changing the speed of the falling ball.
With additional time, we would have changed the software so increased GSR increases the intensity of the vibrational pulses of the disc motor instead of or in conjunction with speeding up the Falldown game.
Lastly, we would have moved hardware from a solderless board to a PCB, to reduce parasitic capacitance, shorted circuitry, and loose connections.
How our design meets the applicable standards
To facilitate the debugging process of our device, we complied with RS-232 serial standards for UART communication. This standard is defined by the Electronics Industries Association (EIA). We also complied with USB standards for interfacing the mouse with a computer.
Use of Other's Design
We used and modified Steve Dickie’s Falldown game to translate a user’s GSR. His code is available publicly at http://processing.flosscience.com/intro-to-processing/learning-by-example/falldown. We also used the website of Joe Ballerini’s and Matthew Newberg’s pachinko machine as a template for this website.
Patent or Publishing Opportunities
We designed our device from scratch and did not reverse-engineer any past designs or similar products. We did not have to sign any non-disclosure forms to receive sample parts. In addition, to our knowledge, our device does not vioate any legal regulations.
Appendices top
A. Source Code
Optical Sensor and EMG for Gesture Control
Biometric Sensing Computer Mouse
B. Schematics
Full schematic of our optical sensor

Full schematic of our EMG circuit used for Gesture Control

Full schematic of our Biometric Sensing Computer Mouse
C. Division of Labor
| Eileen Liu | Ha Luu | Alex Ngai |
|---|---|---|
| flexible IR and PhTx housing | rigid IR and PhTx housing | 3D printed IR and PhTx housing |
| soldering | soldering | soldering |
| hardware building | hardware building | hardware building |
| documentation | documentation | software design |
| website | schematic drawings | documentation |
| website |
D. Instructions for Use for Biometric Sensing Computer Mouse
Patient:
- Place your hand on the mouse with index and middle fingers laid on 2 electrode pads
- Play the Falldown game
- Try to focus on the game as much as possible
Technician:
- Start the Falldown game
References top
This section provides links to external reference documents, code, and websites used throughout the project.
Datasheets
References
Acknowledgements top
We would like to thank Bruce Land and Roland Krieger for spending their time to help us debug and troubleshoot throughout the course of the class.
We would also like to thank Paul Swirhun and Shao-Yu Liang, the original designers of this website template.