ECE 5030
Data Acquisition Toolbox and GUI introduction
Introduction.
You will connect Matlab to the outside world using the DAQ toolbox. You will produce simple prototypes for an oscilloscope and signal generator.
Procedure:
- Download the simpleAI.m and simpleAO.m files from the DAQ programming page. Notice that these programs use the computer sound port to connect to the outside world. In this lab you will use the sound port for output, but use the National Instruments (NI) interface for input.
- When using the sound port as input or output, you need to use audio connections. There are three connections on an audio plug. Normally these would be called left, right and ground, but we will call them channel 1, channel 2 and ground. A typical plug is shown below. An input to the computer goes into the line input socket, usually denoted by a blue socket. An output from the computer plugs into the earphone socket (usually green).

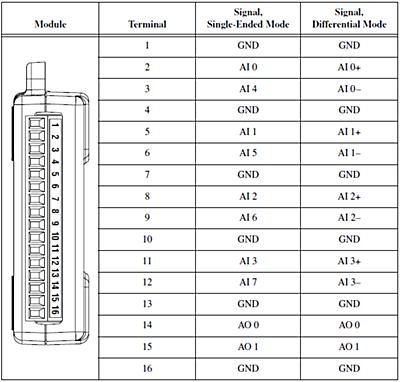
- The national Instruments USB-6008 connections are shown below and the full datasheet is here. You will need to connect to terminals 1 (gnd) and 2 (analog input 0) for single-ended input.

The code necessary to turn on the USB-6008 is below and would replace the similar code for the winsound device shown in the simpleAI.m demo code.
%define the input
adaptor = 'nidaq';
adaptorData = daqhwinfo(adaptor);
id = adaptorData.InstalledBoardIds{1} ;
Fs = 5000;
% Analog input object Configuration.
% Create an analog input object with two channels.
ai = analoginput(adaptor, id);
ch = addchannel(ai, [0 1]);
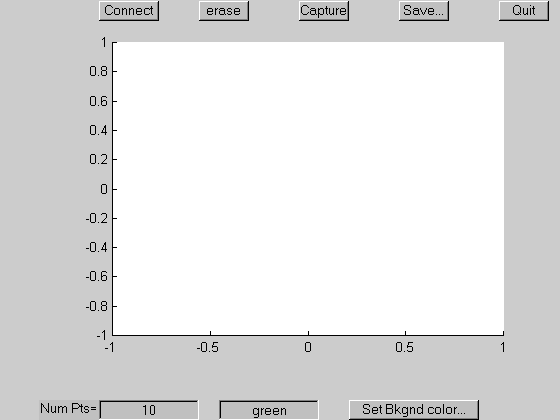
- Many programs will require a graphic user interface (GUI). The GUI page gives more detail. For this lab use this GUI example. This example performs the following functions.
- The Capture button starts the ginput function to collect the number of points specified in the NumPts edit box. If the NumPts edit box contains anything which is not a number or contains a number less than 1, then an appropriate error dialog box will appear when this button is pushed. As each mouse-click occurs, the program should plot the new point.
- The erase button erases the axes.
- The Connect button draws lines between the points collected by the capture button. If no points have yet been captured, pushing this button will cause an appropriate error dialog box to appear.
- The save button causes a uiputfile dialog box to appear. The x,y data which have been captured are stored to the file name specified in the dialog box. If no points have yet been captured, pushing this button will cause an appropriate error dialog box to appear.
- The NumPts edit field contains the number of points to be captured as mouse-clicks..
- The field to the right of it contains a string which will set the color of the line when the Connect button is pressed.
- The Set bkgnd color button causes a uisetcolor dialog box to appear. After a color is chosen in the dialog box, the axes background color is set to the new color. If the cancel button is pushed in the uisetcolor dialog box, the axes color should not change.

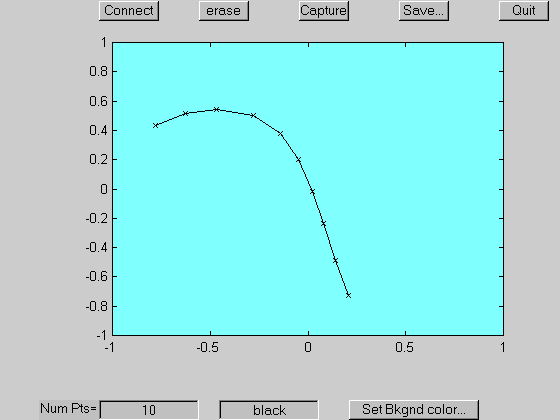
After a few points have been captured, the line color changed to black, and the background color changed to cyan, the figure might look like

Assignment
- Modify simpleAI.m to include:
- a run/stop button (instead of just quitting after 50 times through the loop).
- a plot of the waveform, like an oscilloscope.
- a sample rate of 10 Ksamples/sec on one channel using the NI device
- a listbox interactor to choose the duration of the sample collection of 0.01, 0.02, 0.05, 0.1, or 0.2 seconds.
For testing, connect a wave generator (for instance daqfcngen) to the NI input of the computer and show that you can record the voltages produced by the generator. Use the multimedia control panel to connect the computer's CD player to the sound input so you can look at more complex signals. The matlab function daqfcngen opens a window with GUI controls for a signal generator.
- Modify simpleAO.m to act like a physiological stimulator. It should:
- produce one pulse train every time you click a trigger button uicontrol.
- set three pulse train parameters with a slider or edit field:
- the number of pulses should vary from 1 to 10
- the pulse duration should vary from 1 mSec to 10 mSec.
- the pulse spacing should vary from 1 mSec to 10 mSec.
- the program should produce an error dialog if the spacing is less than the duration.
For testing you will need to connect the sound output of the computer to an oscilloscope.
Your written lab report should include the sections mentioned in the policy page.
June 2009 Copyright Cornell university


