ECE 5030
Electromyograph
Introduction.
In this assignment you will build an Electromyograph (EMG) and force sensor and correlate EMG signals with the force produced by a muscle. Any circuit which you attach to your body must be completely isolated from earth ground and the 110 volt grid. There is a good summary of EMG measurements entitled Important Factors in Surface EMG Measurement by Dr Scott Day.
Procedure
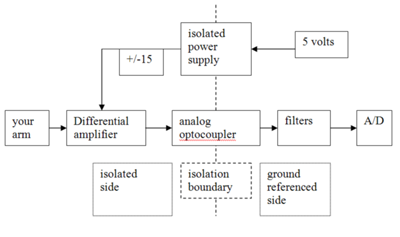
You will need an isolated power supply, an analog signal isolator, a differential amplifier and analog filters.
- A possible differential amplifier circuit. In the schematic, ignore the power supply opamp on the left. The input to the diff-amp has a lowpass filter. The opamp to the right is a highpass filter. The Texas Instruments INA121 is a good, low power diffamp.
- We will use a dc powered, transformer isolated power supply, the Texas Instruments DCP010515, to power the diffamp.
- The analog isolator will be either a Clare LOC110 (see appnote 107) or Vishay IL300 (see appnote 50).
A block diagram is shown below.
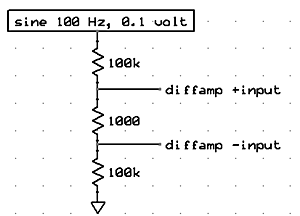
Rather than testing the circuit with actual electrodes on the arm, test with this circuit:
The force transducers we will be using are thin film units from AdaFruit. The transducers appear to be a force-dependent resistor.
Assignment
- Build a circuit based on the block diagram above. You will need to do a fair amount of experimenting. For testing, use a 1 millivolt sine wave applied across the differential amplifier inputs as shown above.
- Measure the common-mode rejection of your circuit by applying an approximately 1 volt sine wave to both inputs.
- Build a circuit which will allow you to measure force by measuring the resistance of the thin film sensor.
- Use the USB-6008 to connect the EMG circuit and force monitor to your computer.
Write a matlab program to:
- Read the EMG output voltage and force monitor about 1000 times/second.
- The raw EMG should be preocessed to produce an envelope of activity:
- remove the mean value
- rectified (absolute value) or squared
- smoothed with a lowpass filter which has a time constant comparable to the muscle twitch time.
- Make a plot of processed EMG versus time and force versus time over several seconds.
- Systematically vary the force produced by a muscle and plot the relationship between EMG amplitude and force.
Your written lab report should include the sections mentioned in the policy page, and :
- Relationship between EMG amplitude and force. How do you interpret this biologically given that each muscle fiber is binary?
- Observations concerning biological effects, such as electrode position or other effects.
January 14, 2013 . Copyright Cornell university