-
while time_accum<60
interval=max(int_meanA+sdA*randn,min_intervalA);
time_accum=time_accum+interval;
spi=[spi;interval];
end
spimsA=spi*1000;
spitimeA=cumsum(spi);
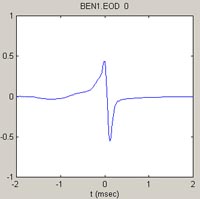 There were several modifications made to the opening code for individual waveforms. As
with all functions, it had to be doubled to accomodate the second channel. Therefore, the waveforms were split into A and B,
and separate open functions were implemented for each of them. As per the given specifications, a few other modifications
were made to the open function.
There were several modifications made to the opening code for individual waveforms. As
with all functions, it had to be doubled to accomodate the second channel. Therefore, the waveforms were split into A and B,
and separate open functions were implemented for each of them. As per the given specifications, a few other modifications
were made to the open function.|
|
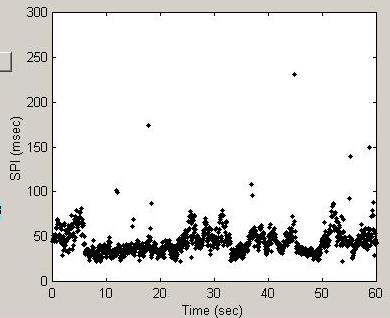
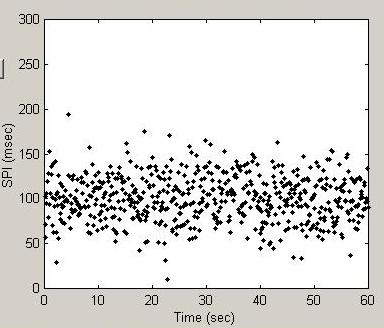
A new feature of this version is the ability to read in standardized SPI files. These files contain about 60 seconds of SPI data, and the objective is to read in the data and properly format it for display. This two-dimensional plot contains the pulses spaced linearly and vertically based on their intervals. On the horizontal axis, the point is plotted at its place in time. On the vertical, the interval since the last pulse is plotted. The SPI data is stored as clock ticks, and is converted to milliseconds by knowing the clock tick intervals and the sampling rate of the SPI, which are all stored in the file. One additional feature is interval statistic displays for these SPIs. While not in the original specifications, it seemed an interesting method for a quantitative comparison of SPIs to calculate the statistics, especially for comparison purposes with the artifical waveforms. |
The other method for selecting intervals is an attempt to more closely approximate the
spacing which would ideally exist in nature. The user inputs a mean value for the interval spacing, a standard deviation,
and a minimum interval spacing length. The code for implementing this spacing algorithm selects a random interval
based on the normal curve with the entered data. The value is added to the list of interval spacings, and the SPI is
generated as it was for the SPI files.
|
|

