FAN-tastic POV Display
Multi-function Persistence of Vision Dotstar Display
Han Li (hl565) and Emily Sun (eys27)
ECE 4760 Fall 2017 Final Project
Introduction
Sight is one of our most important senses, and with the creation of digital images, there come a wave of different ways to display beautiful images and videos. Most of these displays uses stationary pixels to show arbitrary images or videos. Because the human eye retains a visual continuation of images with a succession of still frames, the video appears when the images are played by very quickly. The beauty of a persistence of vision (POV) display is that it uses the same optical illusion to display images. Much like how stationary displays use the optical illusion to display videos by playing multiple still frames rapidly, the POV display uses the same illusion to display an image by rendering each “row” of pixels individually very rapidly. The design of this multifunction display is based on the concept of persistence of vision with the utility of a fan. More importantly, the novelty of this POV display makes it a good conversation starter that can easily be assembled and customized. Using a single strip of mechanically rotating LEDs mounted on a fan blade, the display is able to give an illusion of an image to simulate an array of LEDs. As a result, a user is able to display anything from an analog clock to an image or short animation on the POV display.
High Level Overview
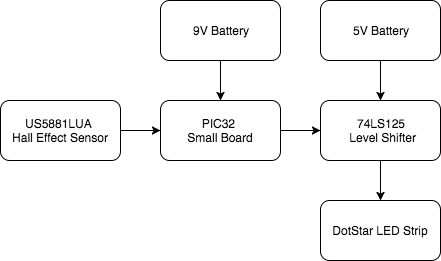
High level overview block diagram
The rationale behind this multifunction POV display stems from the desire to create a unique and eye-catching display. We got a lot of inspiration from watching mesmerizing YouTube videos, and were captivated by the way in which a simple strip of LEDs can create so many enticing patterns. One thing we noticed was that many of the POV display microcontroller projects were miniature in size, and required a large number of individual LEDs that were interfaced by directly connecting to the GPIO pins on the microcontroller. The POV displays shown could not truly showcase the illusion to it’s fullest because it would be limited by the physical size of the device as well as the available LED colors.
As a result, we wanted to create a POV display that was much larger in size and could be easily customized to display any image as opposed to just showing a POV analog clock. We began by salvaging a old box fan that was 0.5 meters by 0.5 meters. This would allow us to get a large image. We then cut a piece of plywood and drilled a hole in the middle to fit onto the center of the fan. This was mounted in place securely with 2 screws. The LED strip was then ziptied and taped onto the wood. The hall effect sensor, which we used for dynamically determining where the fan blade was, was mounted at the very tip of the wood. This would face upward. We found an L bracket that we then put two neodymium magnets on which we stuck on the side of the box fan so the hall effect sensor could detect it as the fan swings by. Finally, we put the 9V battery, the PIC32 board, the protoboard with our circuit, and the battery pack onto the center of the fan.
During the development of our project, we balanced tradeoffs between hardware and software. Because the wood board we mounted the LED strips on would fluctuate when the fan is spun, we were reluctant to use the higher setting of the fan. For debugging purposes, we were limited to the lowest setting of the fan. This slowed down how fast our display could refresh. Thus, in software, we used a hack to refresh the display twice as fast, utilizing the fact that we had a full length strip of LED instead of just half length (from center to the edge). Because we custom wrote software that display LEDs on both sides of the strip at the same time, we effectively doubled our refresh rate even with the fan speed staying the same. In addition, because the PIC32 can only achieve a max interrupt speed of less than 4 MHz, we do not have infinite precision in displaying LEDs. This is because the fan is undoubtedly going to skip some amount in space before the hardware timer gets triggered. This makes it so that we cannot compare where the fan is to where we actually want it to be before lighting up. The slight offsets will make it so the fan never lights up. We were able to fix this in software by setting a threshold. If the two values are within the same threshold, then we’ll say they are equivalent. This is even more prominent in the image display since it uses a different method of drawing than the clock that we’ll talk about below.
Finally, we did not run into any legal issues besides an existing patent. This will be talked about further in the conclusion.
Hardware Design
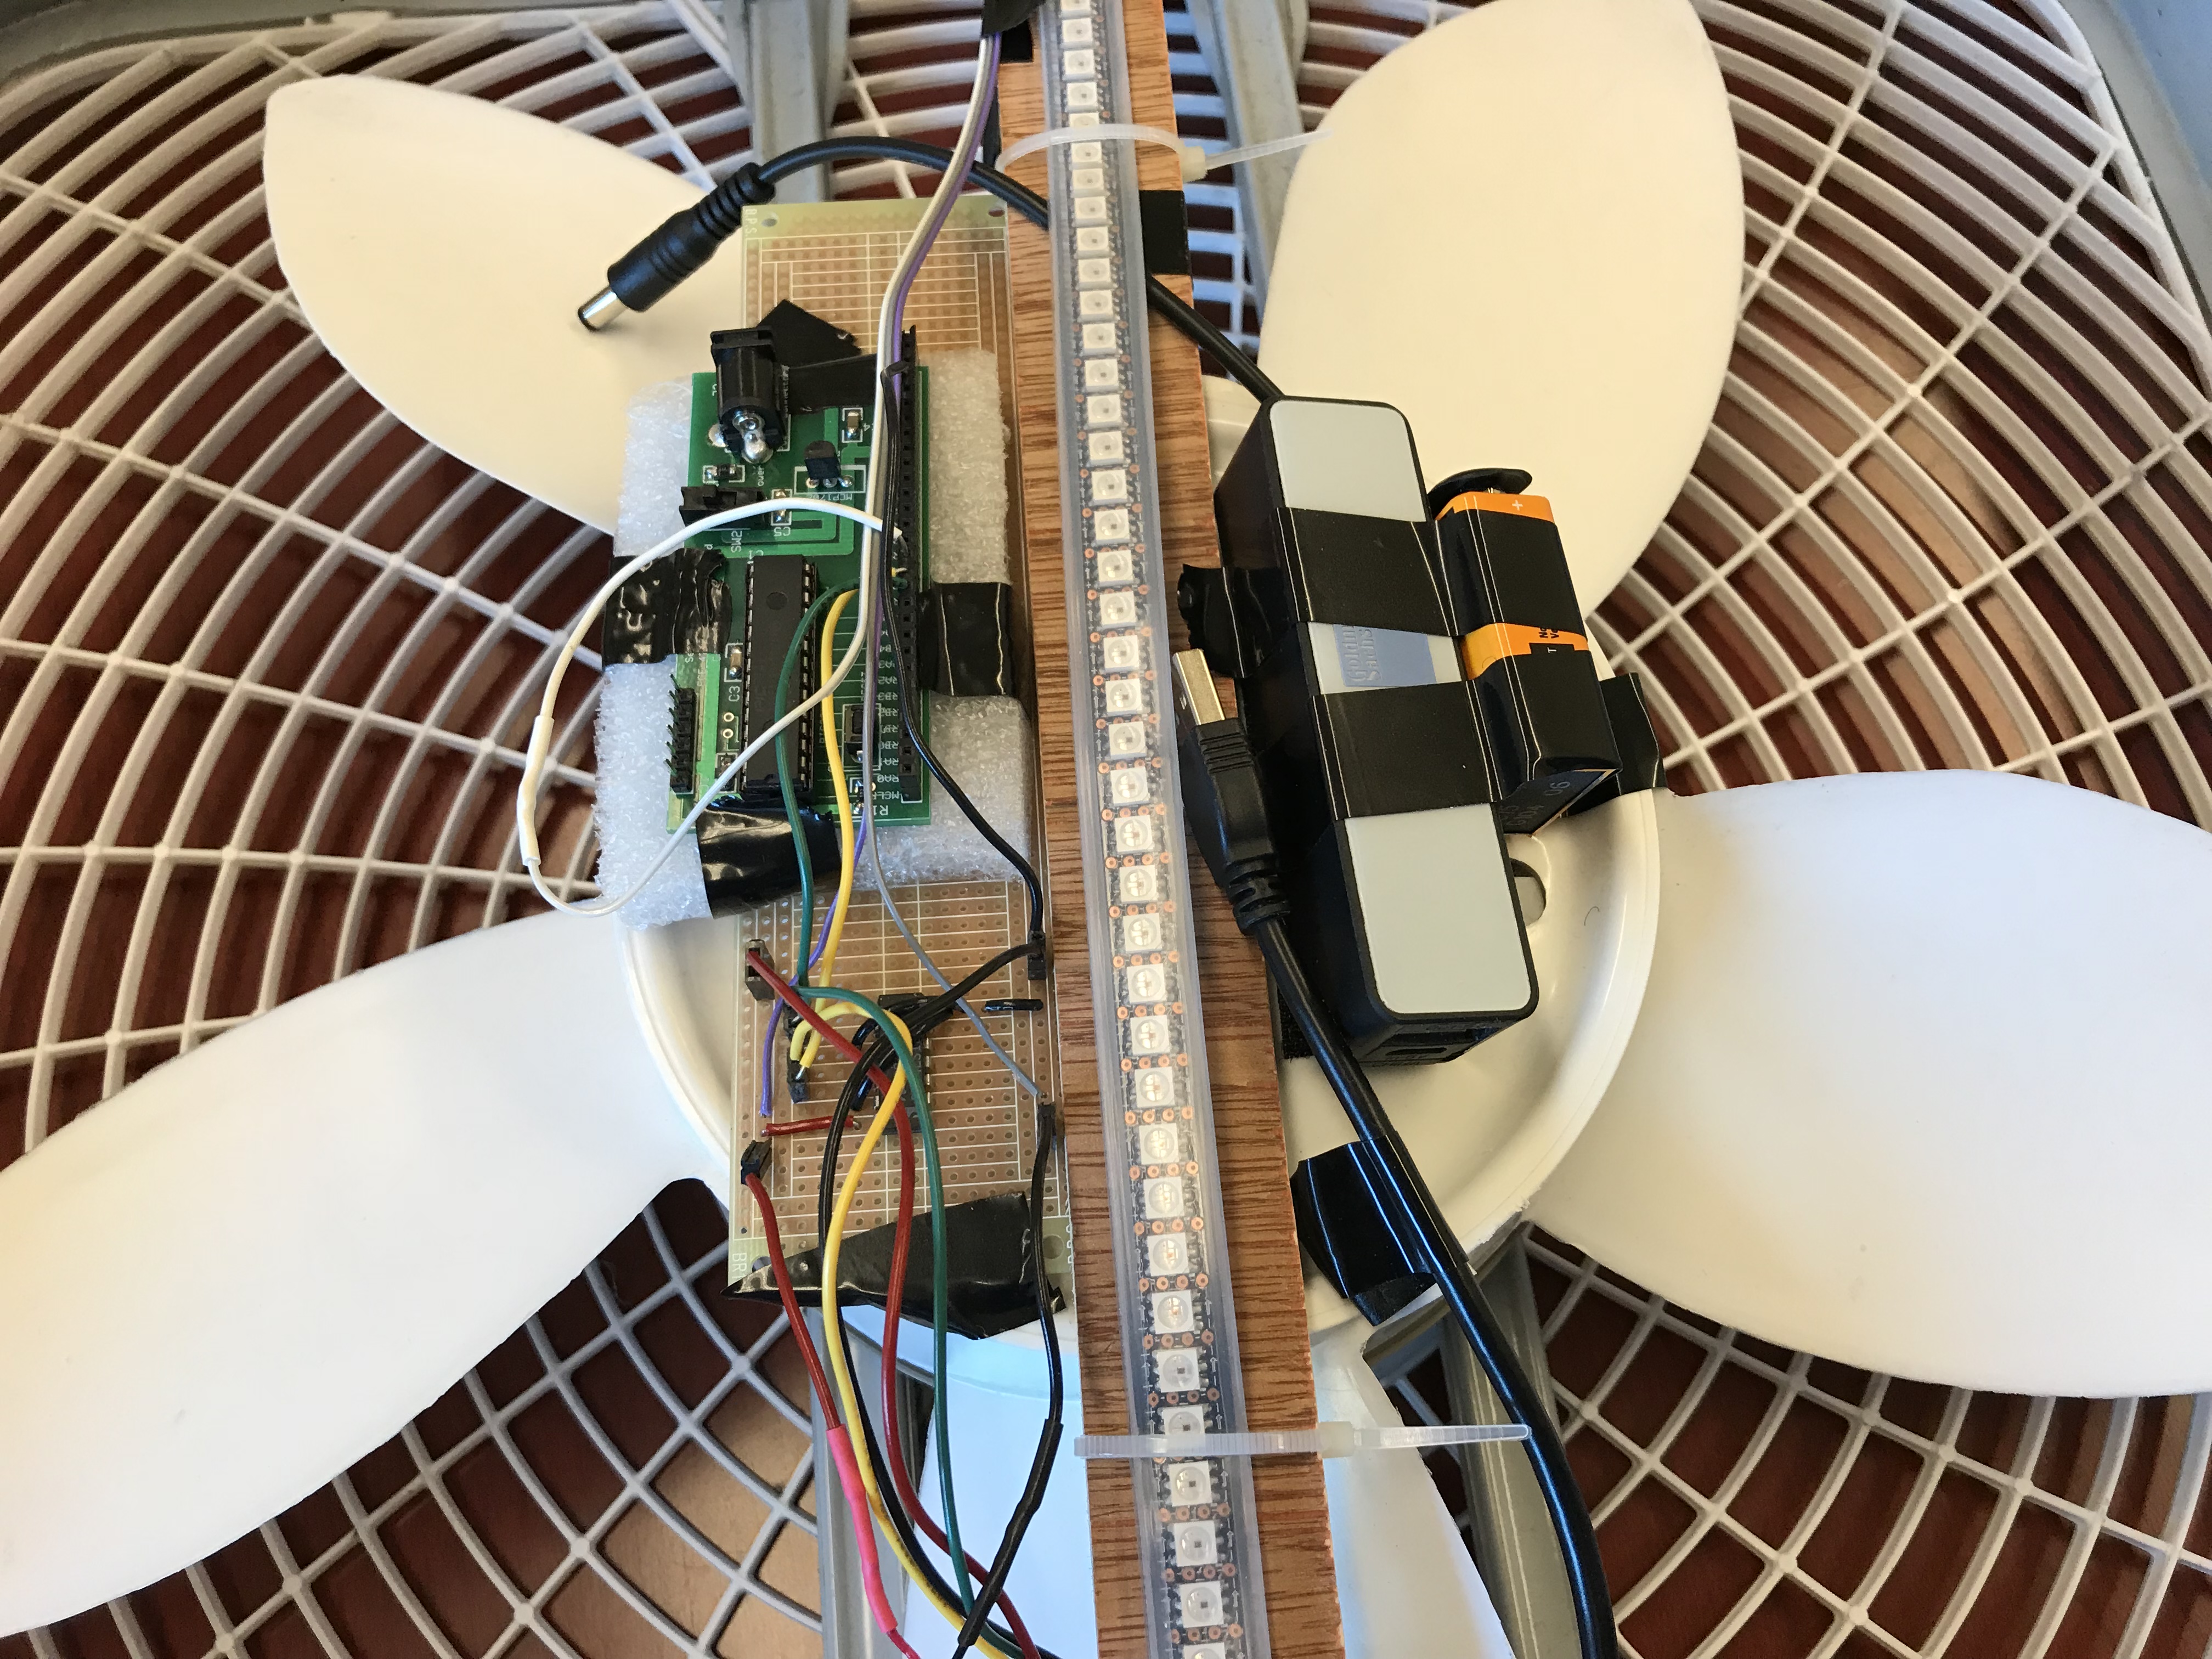
Hardware components of POV display
The hardware components used in the multifunction POV display consists of an old box fan, DotStar LED strip, level shifter, hall effect sensor, 5V battery power pack, 9V battery, wood, and the small PIC32 development board.
The small development board containing the PIC32 is powered by a standard 9V battery. We built the board following the instructions from here. The PIC32 itself has a voltage regulator that converts the 9V battery into 3.3 Volts. We salvaged the adapter in the lab. The PIC32 is in charge of all of the computations using the hall effect sensor as an input to see how fast the fan is rotating. It then outputs the corresponding SPI data to the DotStar LED strip.
We use a US5881LUA hall effect sensor to get the frequency of the rotation. The hall effect sensor has a wide operating voltage range between 3.5V to 24V. We chose 5V as the operating voltage level so the hall effect sensor can share the same 5V power rail as the level shifter on the main protoboard containing all the circuitry. Pin 1 (VDD) is connected to 5V, and Pin 2 (GND) is connected to common ground. A 10k pullup resistor is placed between Pin 3 (OUT) and Pin 1. Thus, when the hall effect sensor is within close proximity to the south end of a magnet, the sensor output will be pulled low. This output is read into RPB14 of the PIC32. This simple circuit for the hall effect sensor was soldered onto a protoboard and then cut into a small “breakout board” for easy mounting and rigidity. The hall effect sensor board is mounted on the edge of the wooden beam and is connected by a long stranded wire leading to the main circuitry mounted on the fan centerpiece. Using a L bracket, a strong neodymium magnet is mounted on the edge of the fan so it is able to detect when the hall effect sensor passes by. As a result, the hall effect sensor allows us to calculate the period of one blade dynamically, as the period of the fan rotation is not exactly constant. This allows us to get the clock image to stay in place.
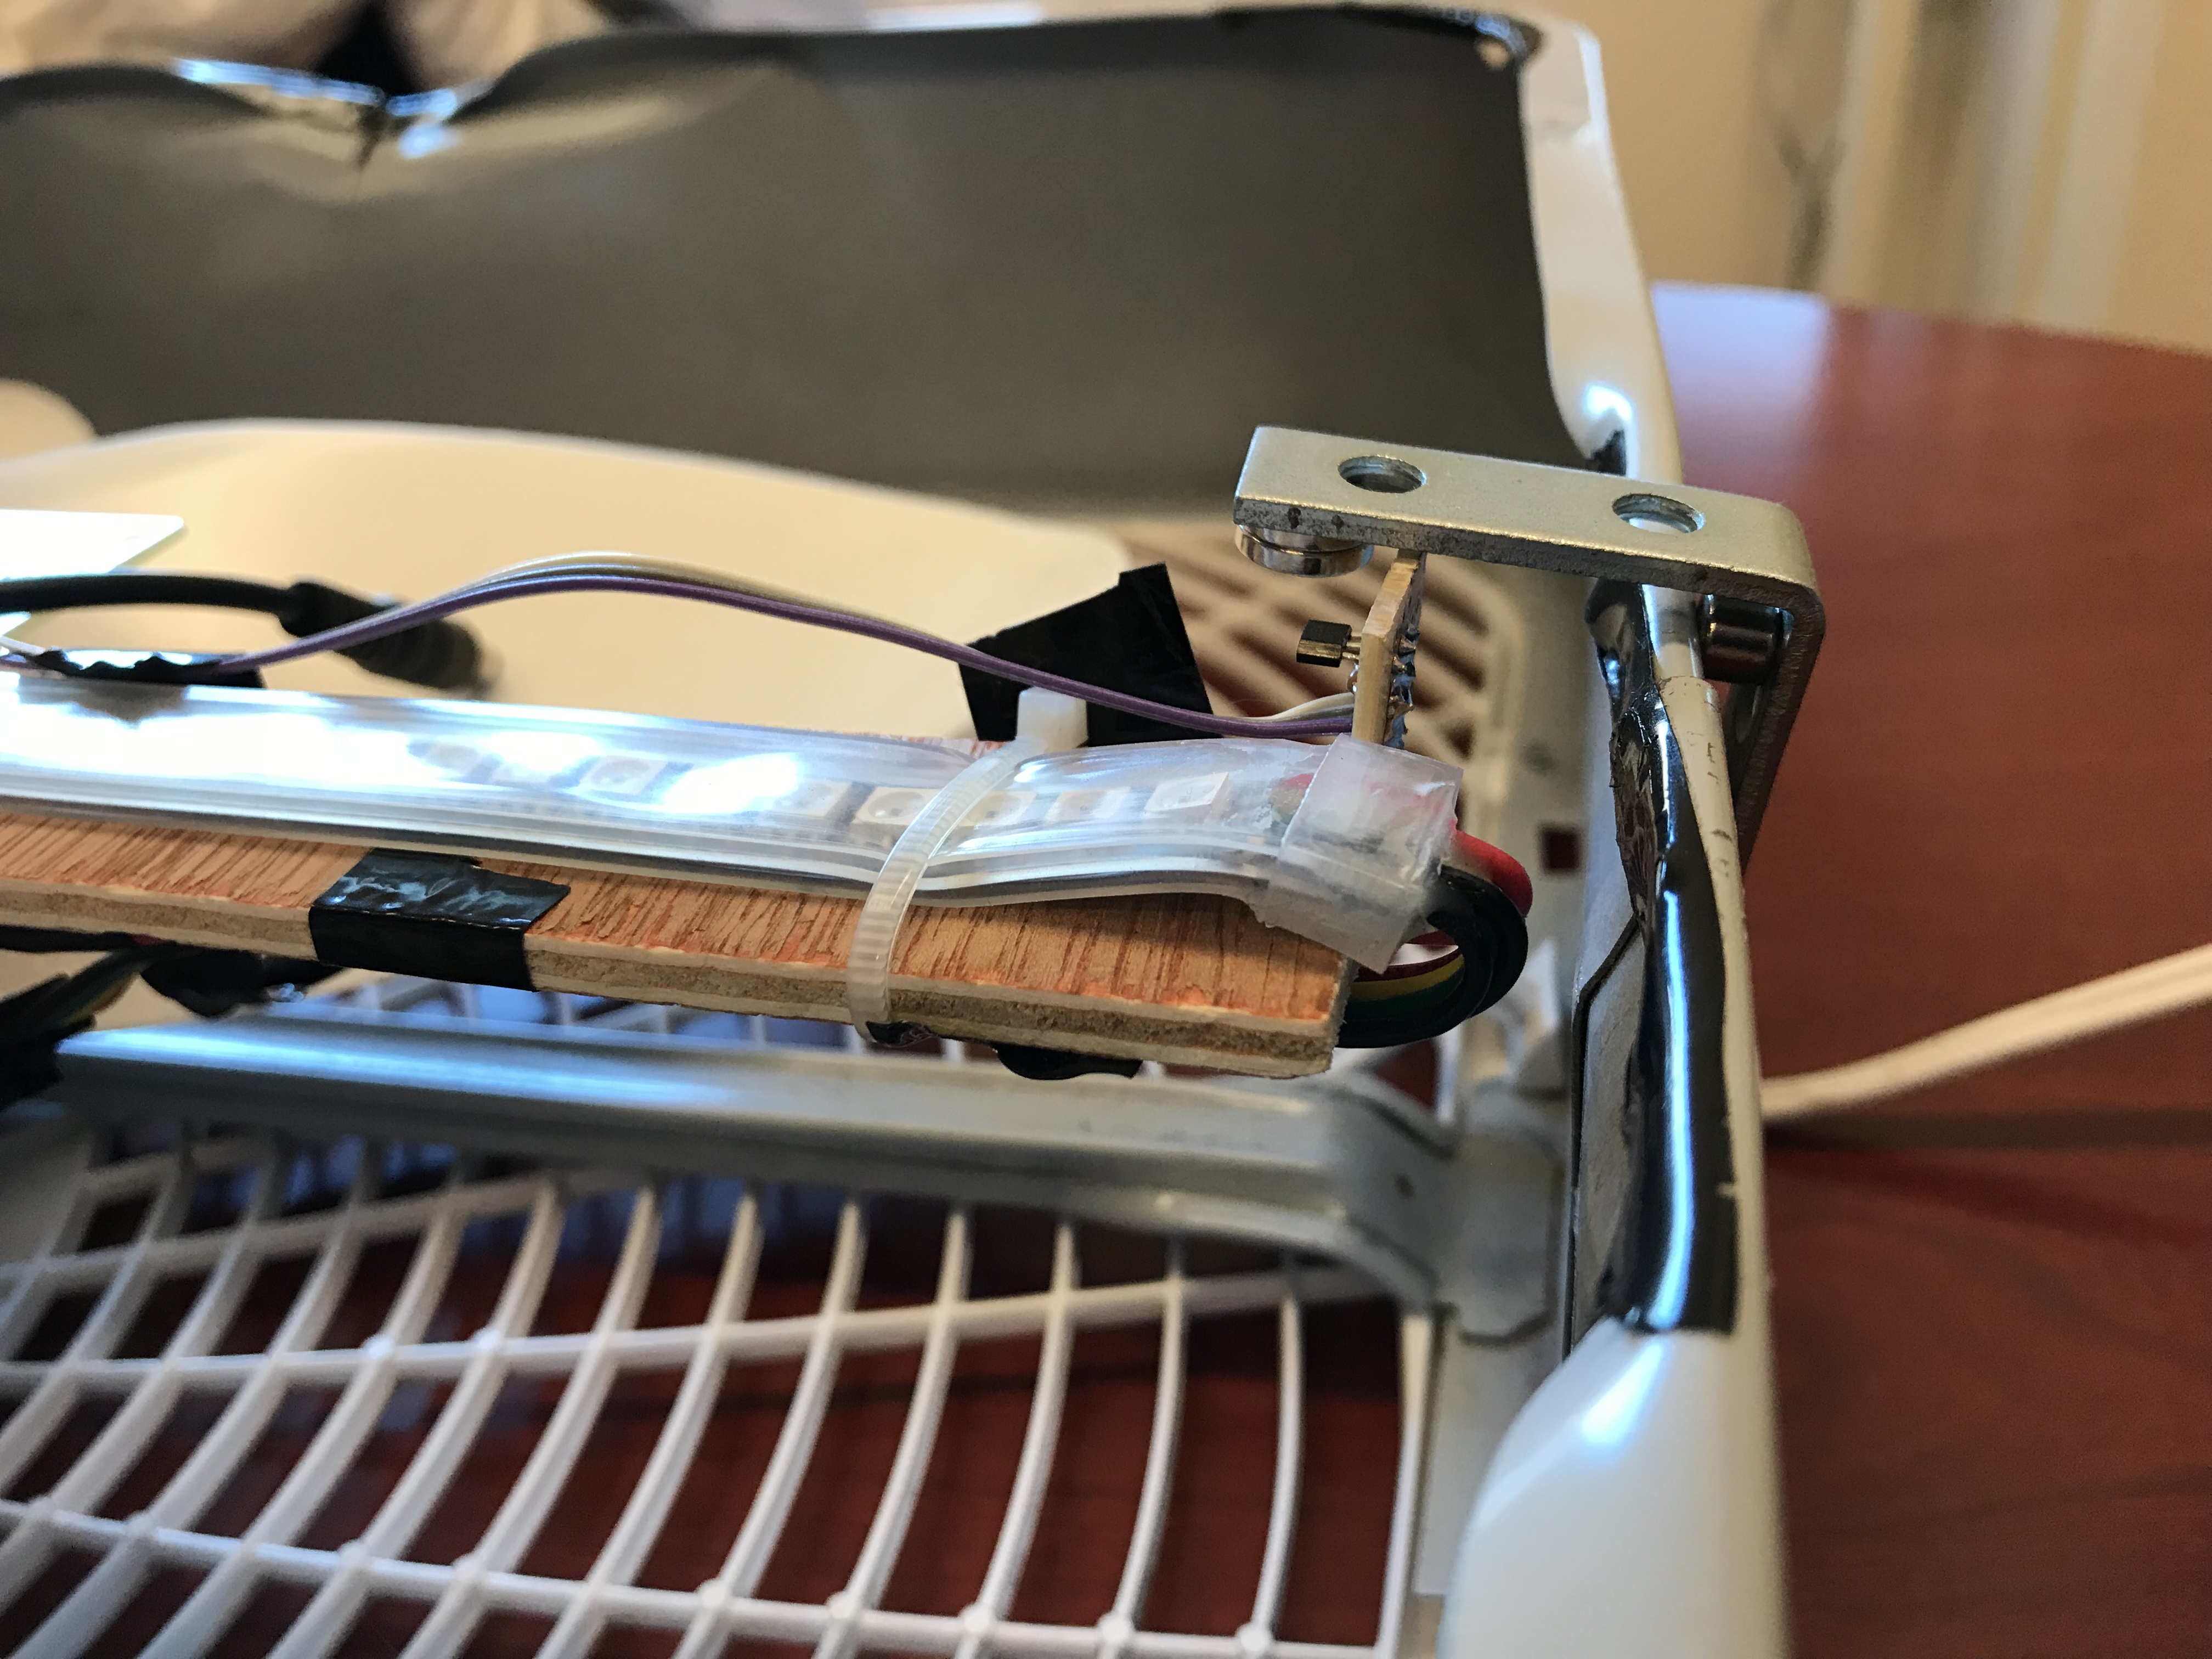
Peripheral view of hall effect sensor mount
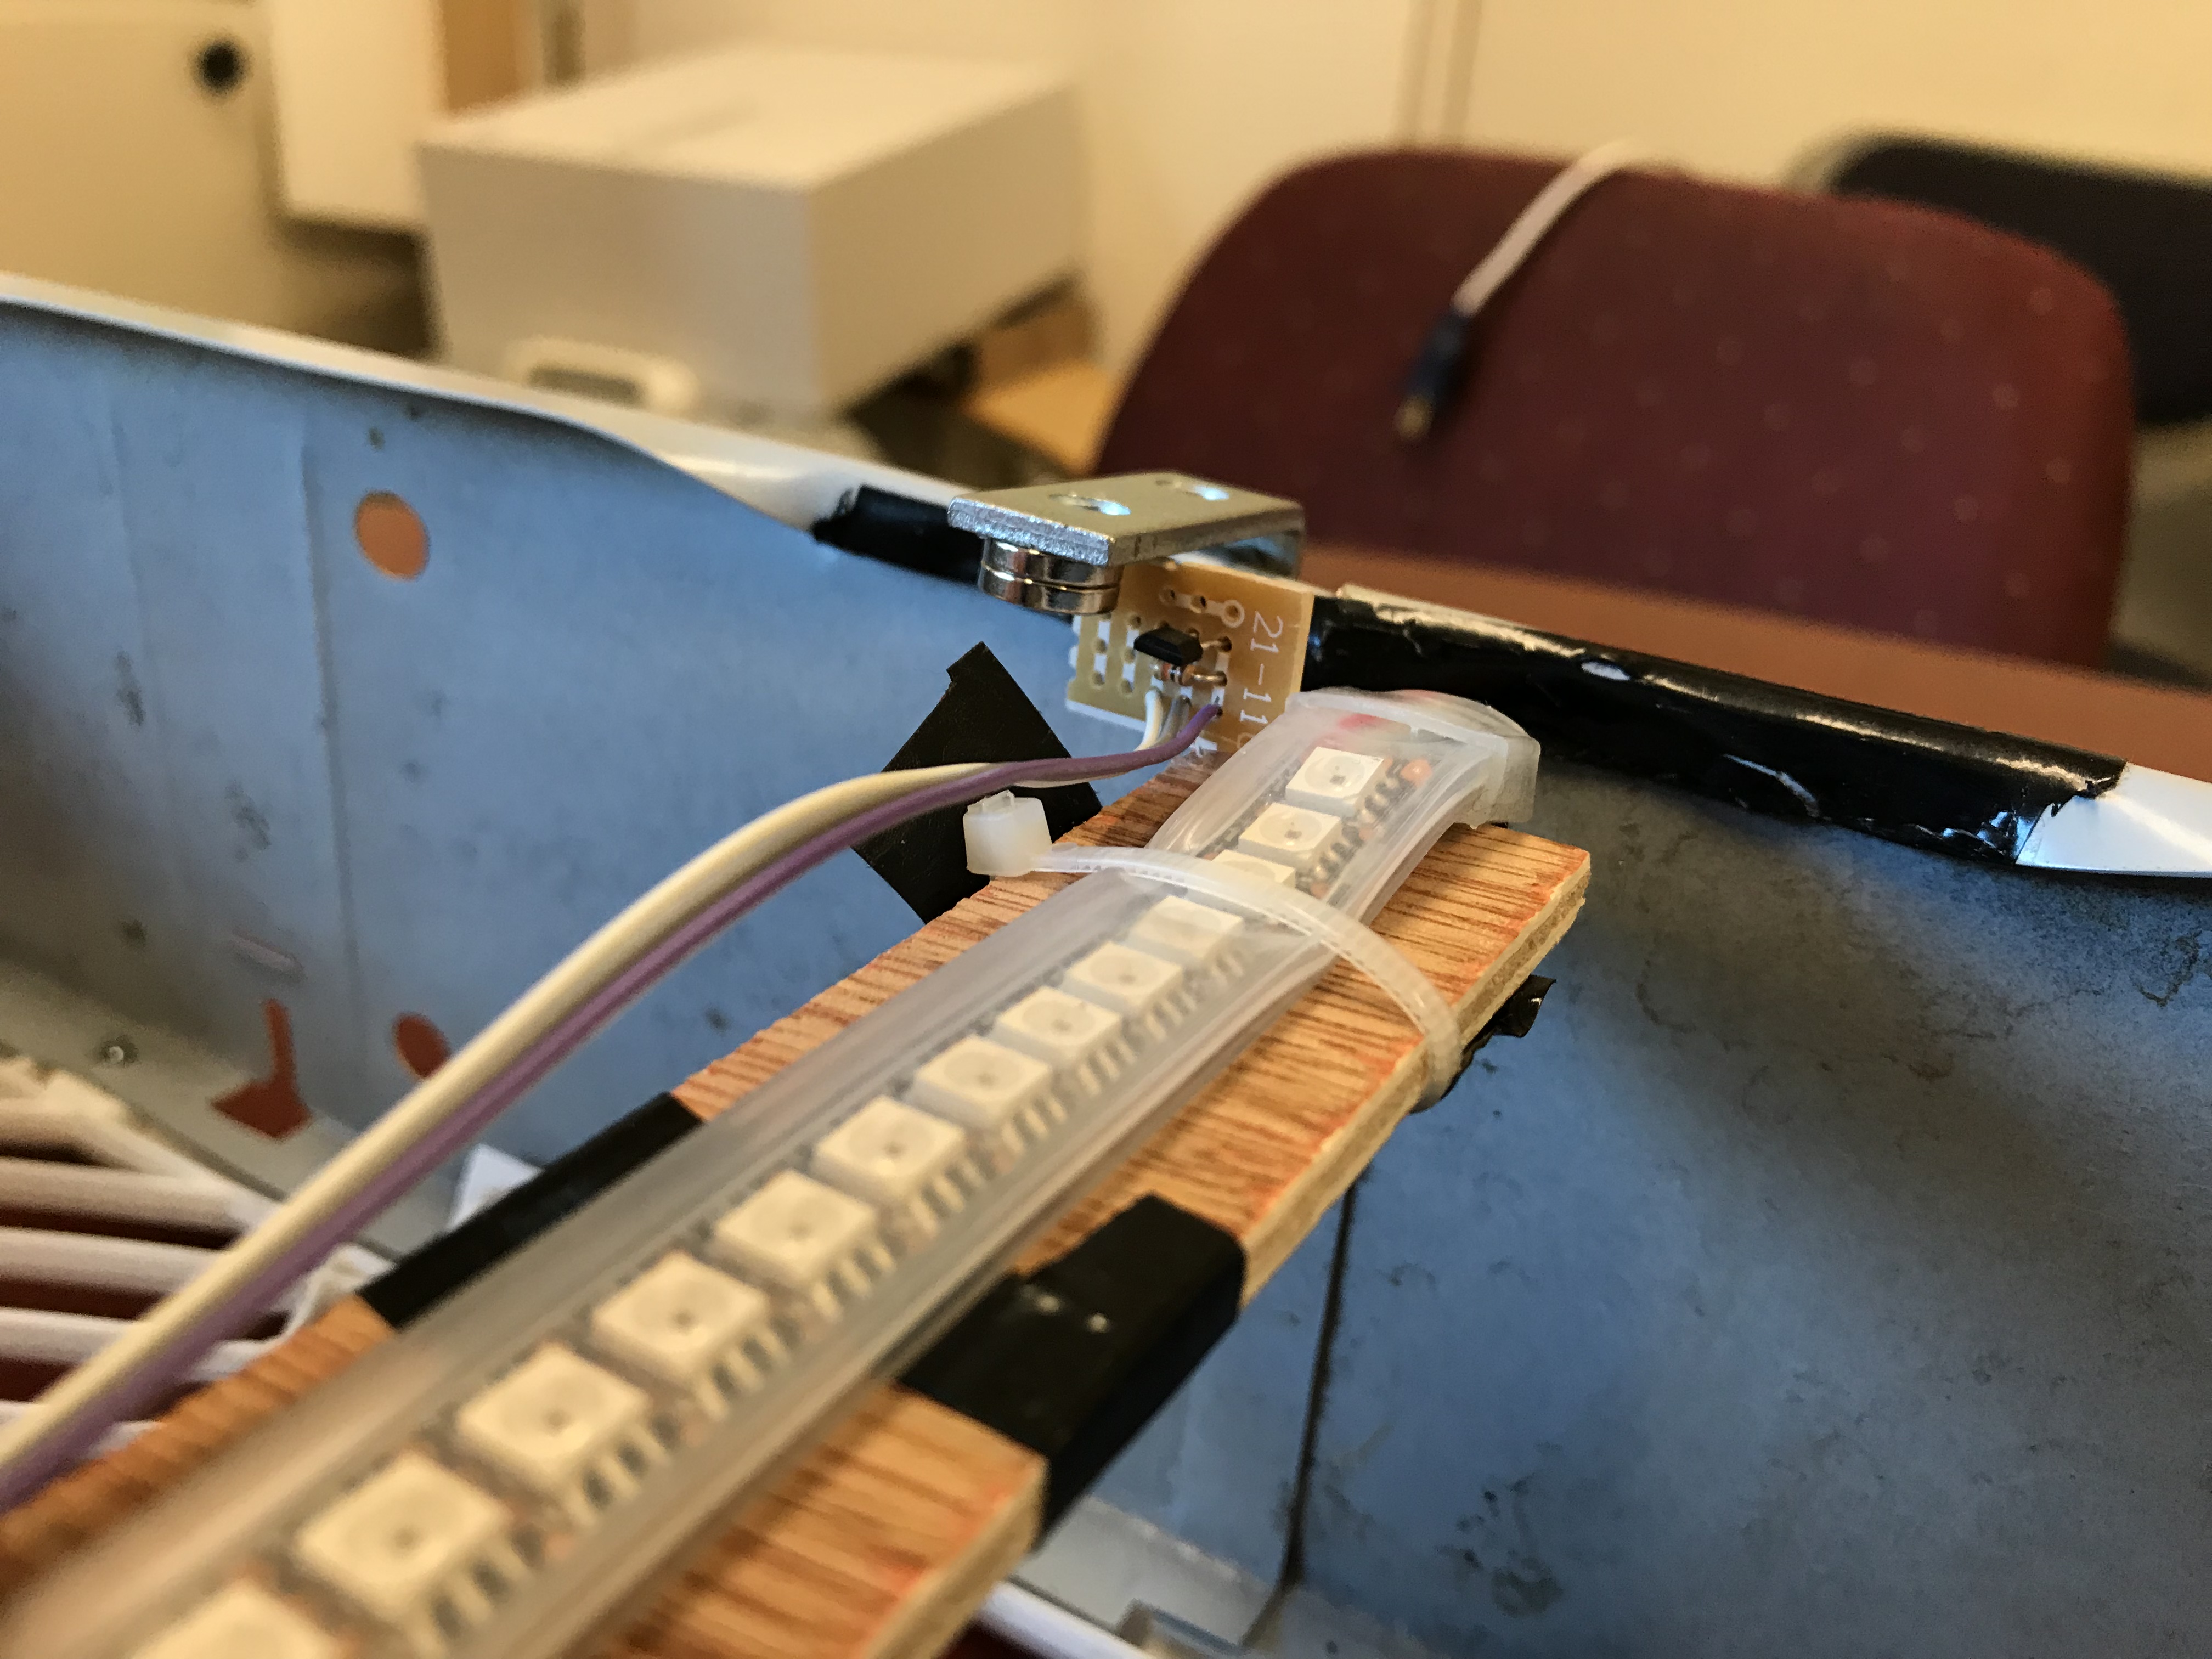
Front-on view of hall effect sensor mount
The DotStar LED strip must be driven at 5V and takes about 60mA per LED at full intensity. As a result, to interface between the PIC32 and the LEDs, we used a tri-state buffer (74LS125) that level shifts the 3.3V from the PIC32 to 5V. This works because the tri-state buffer takes in 5V, which means that if we just short input B to ground, input A will get shifted up from 3.3V from the board to 5V that we want for the DotStar. When input A is 0V, the output will also be 0V. This is then mounted on a protoboard. Next, We use two ports on the PIC32 to drive the SPI data (RPB5) and clock (RPB15) lines, which are then level shifted up to the LED strip. SPI is a synchronous data bus such that the clock tells the receiver at which intervals the information on the data line should be sampled.
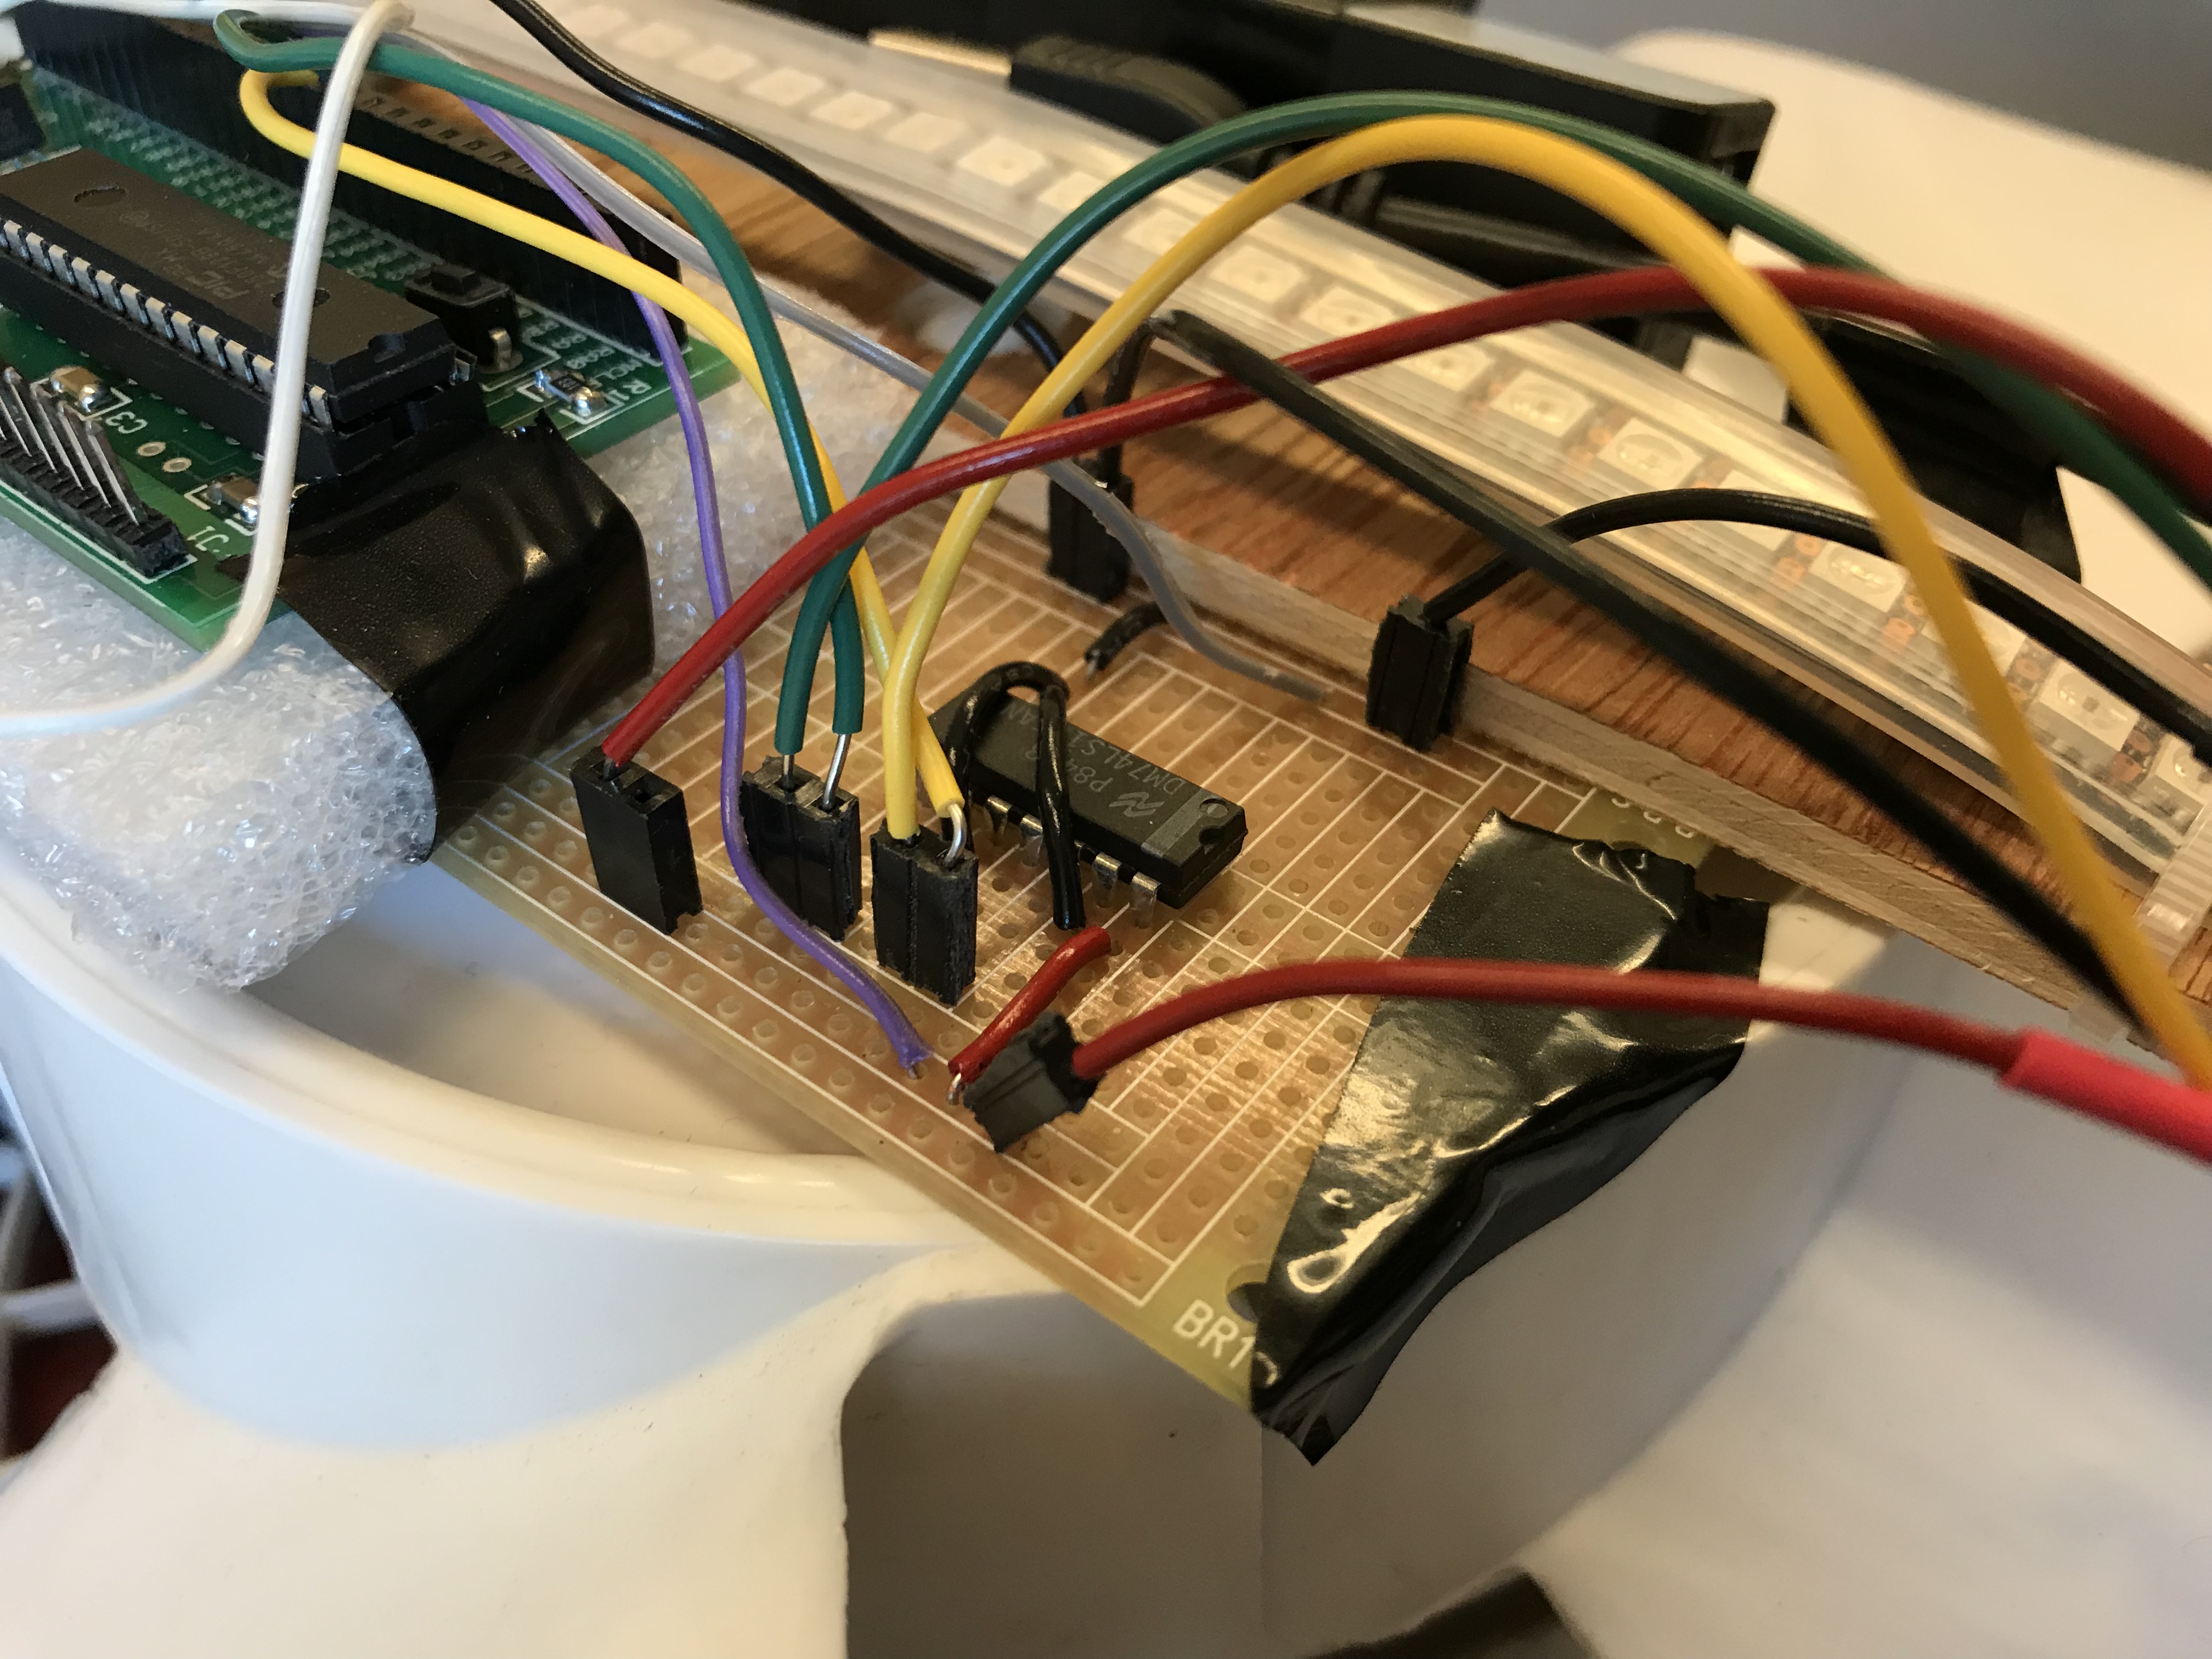
Protoboarded level shifter circuitry
In our application, the PIC32 acts as the master and generates the clock signal and the DotStar LED strip is the slave. The SPI we use in this case is only a simplified 32-bit version of the protocol that does not a need a chip select line. A start frame consisting of 32 bits of zeros 0x00000000 and an end frame consisting of 32 bits of ones 0xffffffff signals the beginning and end of each message, as shown below. The LED frame message consists of the pixel frame that defines the intensity/gain (5 bits) and R,G,B value (8 bits each) of the LED. In order to avoid false end frames, range for LED intensity is set from a range of 0x00 to 0x1e. Our code generates an array consisting of a start frame, 75 LED frames for each LED on our strip, and then an end frame for each transmit to the SPI channel.
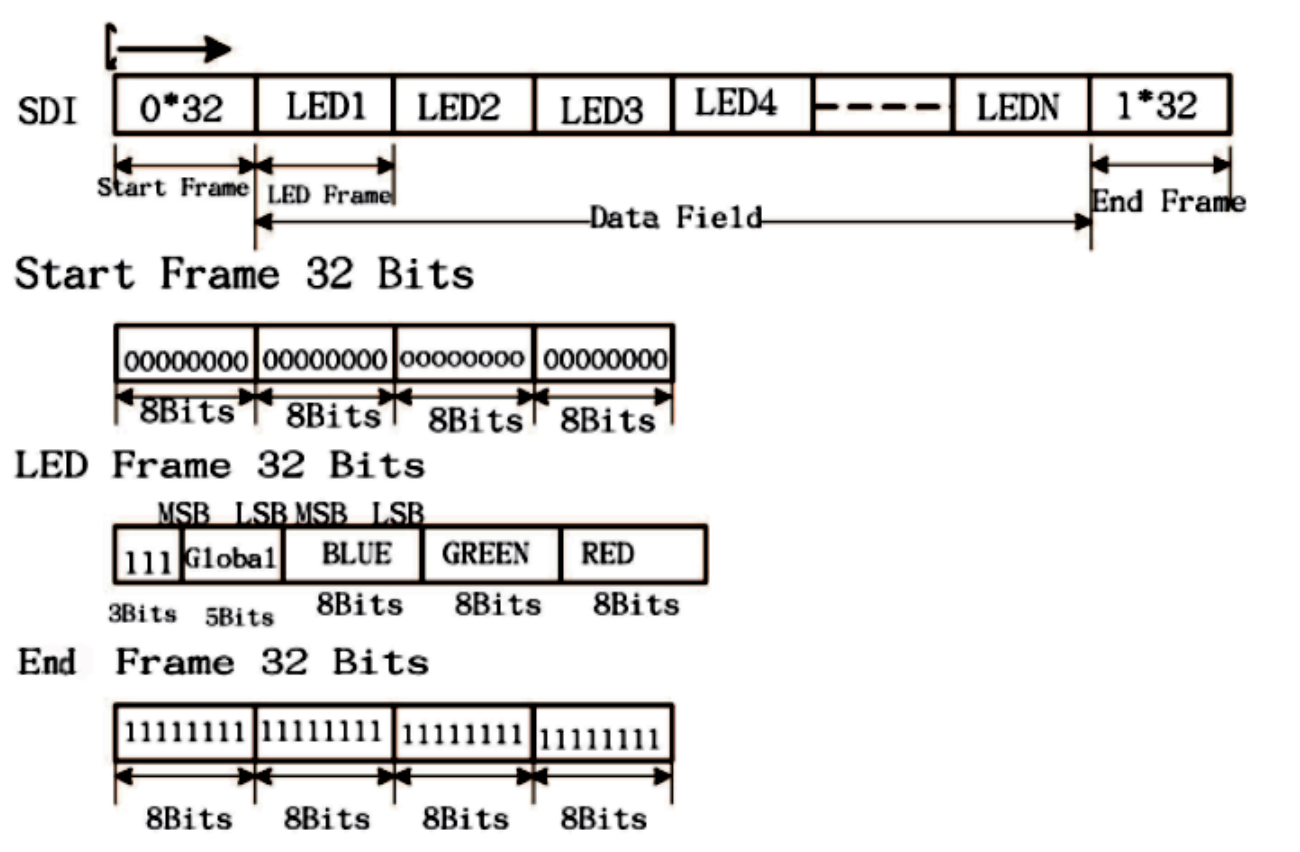
Simplified SPI communiciation protocol for DotStars (Image credits: Bruce Land)
We mounted the DotStar LED strip on a wooden beam that runs across the length of the blades on the fan, which is approximately 0.5m. We then placed our protoboard (tri-state buffer), 5V battery pack, and 9V battery on the center of the fan to minimize the moment of inertia. The hall effect sensor is connected to the circuitry on the middle of the fan by a 0.5m length of the stranded wire. This placement makes sense so the edge of the fan blade is able to be in contact with a magnet placed at the fan’s perimeter to calibrate the RPM of the blades and how the LEDS are selectively light up based on the desired image.
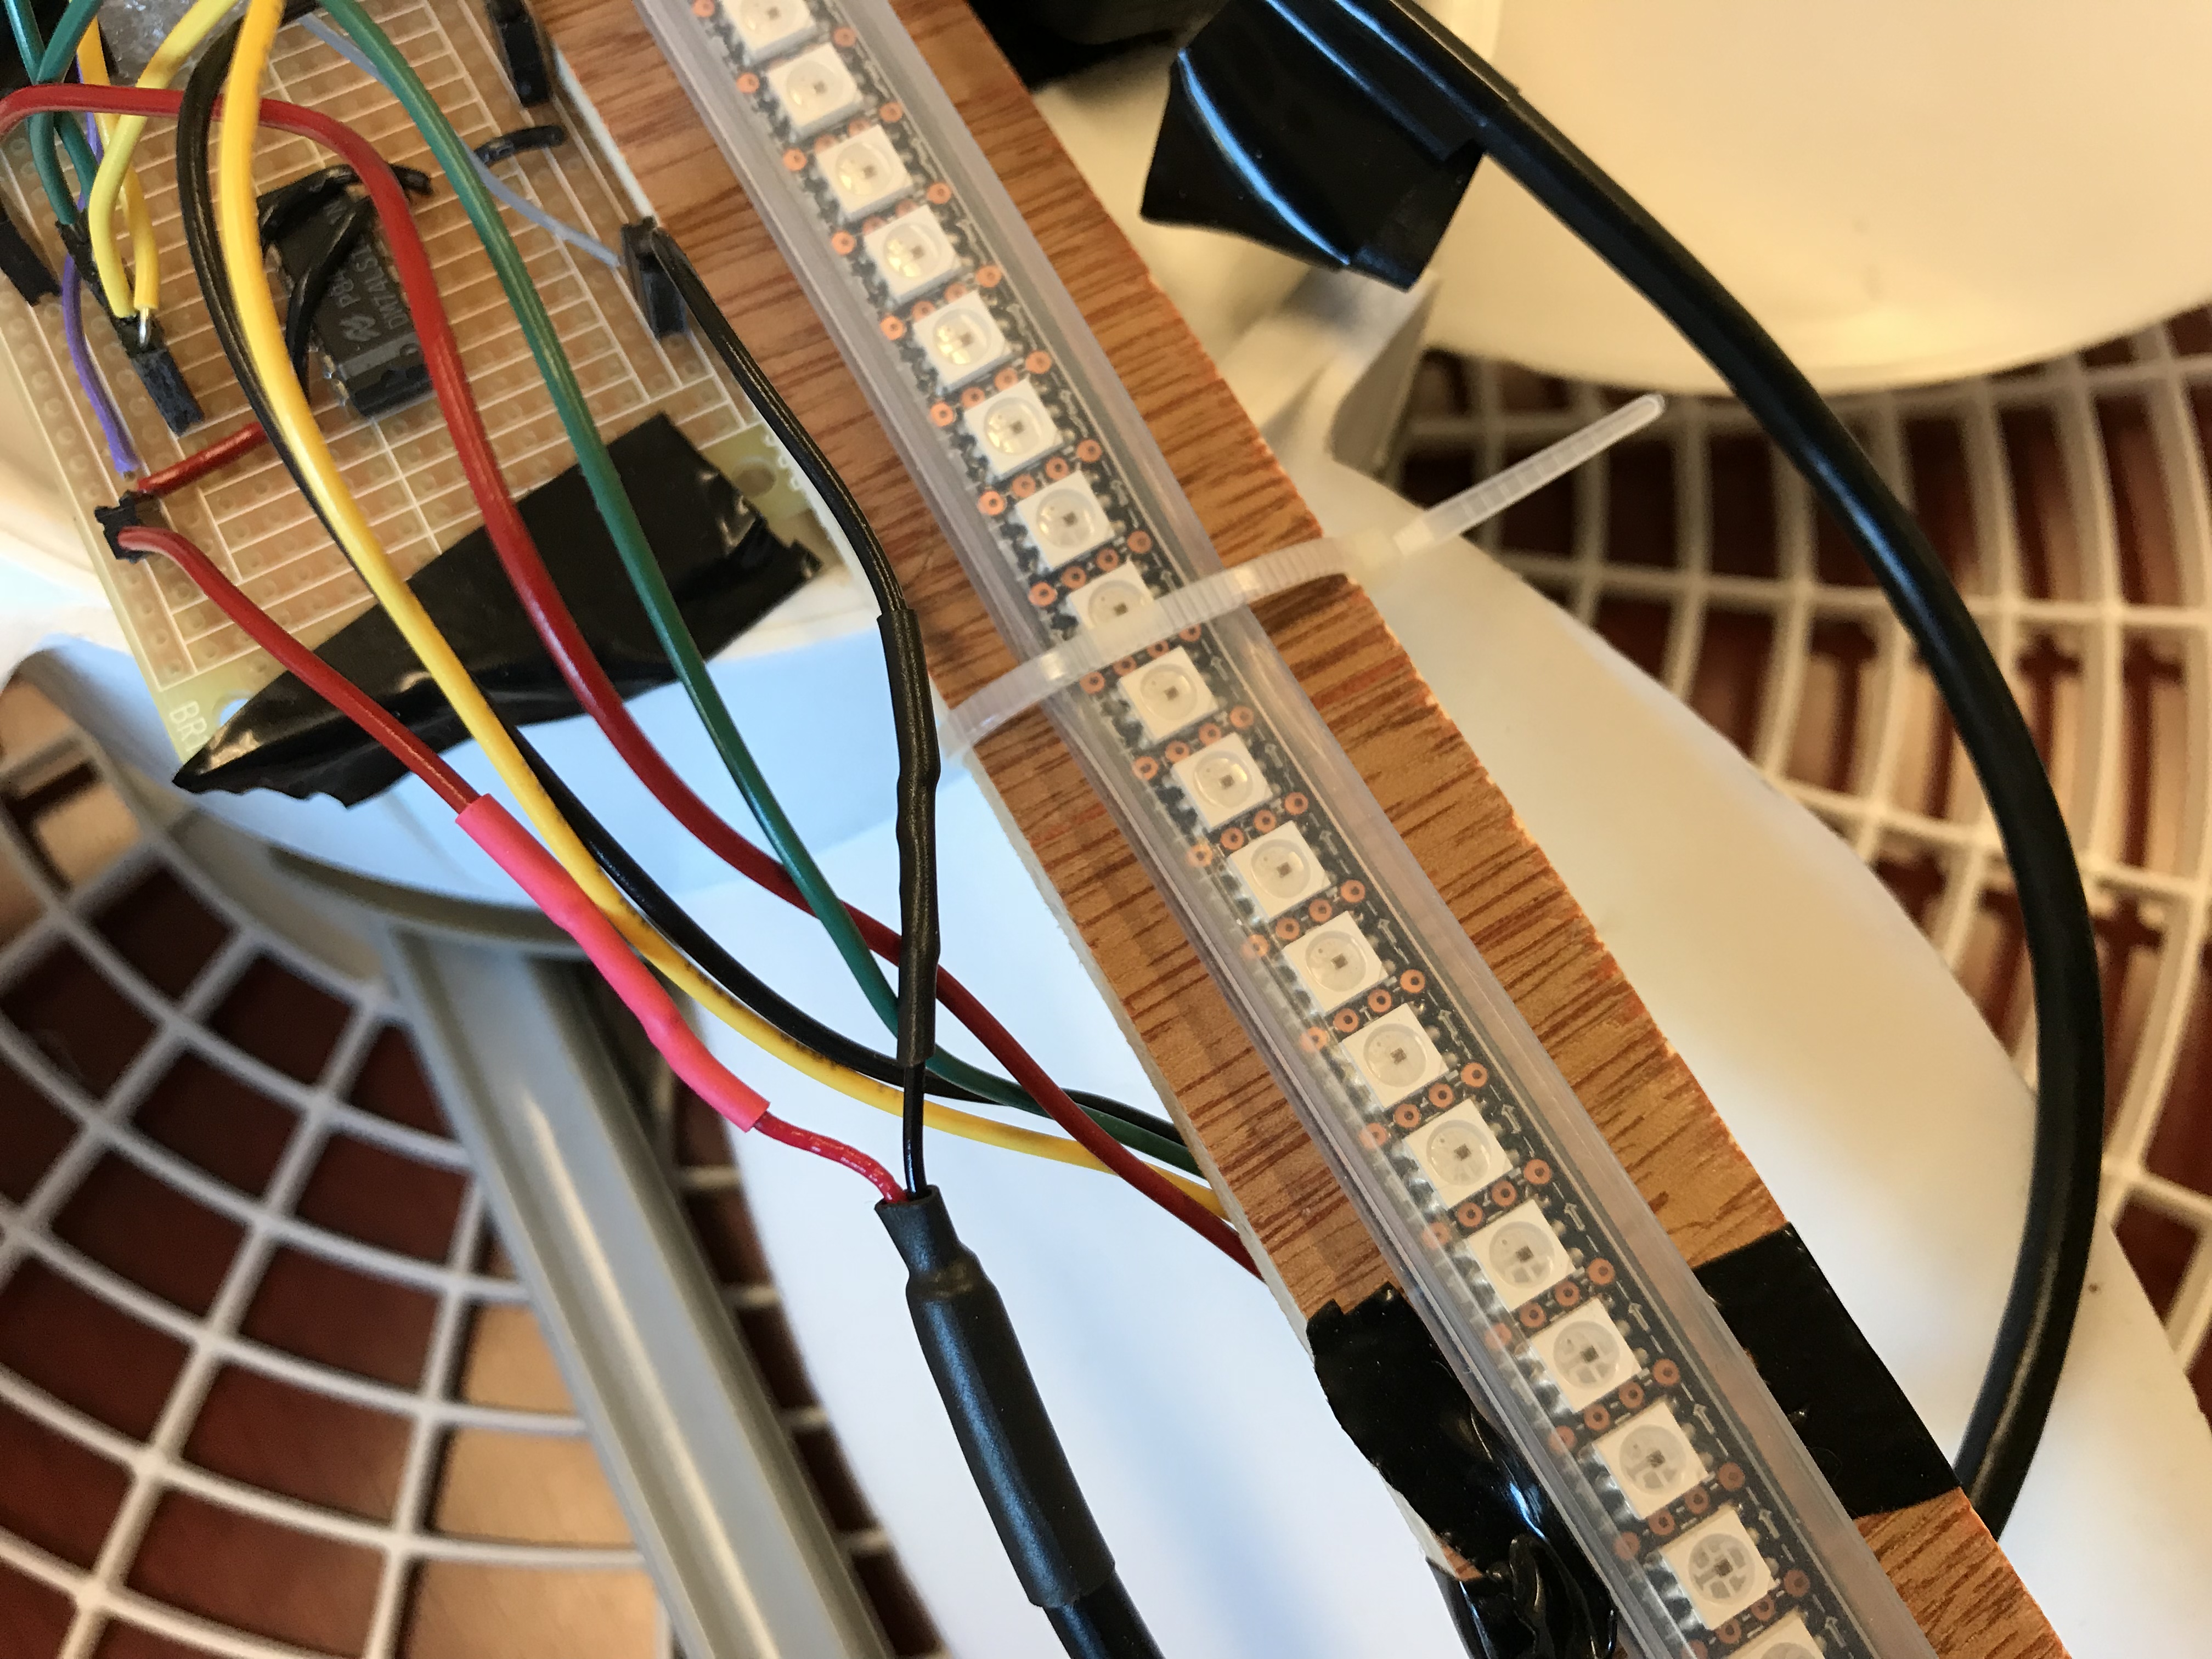
Mounting of DotStar LED strip on fan blades
As all the hardware was mounted, we noticed that there was an issue with the blades rising as the fans turned on while testing. As a result, the length of the wooden beam was just long enough to have the edges hit the edges of the fan as well. Some of the LED wires would also scrape the edge of the fan as it rotated. We better secured the LED strip onto the wooden beam with electrical tape, and also added velcro to the batteries so they would not be separated from the fan during fast rotations. To solve the issue of the spinning LED beam hit the fan, the metal edges of the fan were bent slightly outwards to prevent any possible contact.
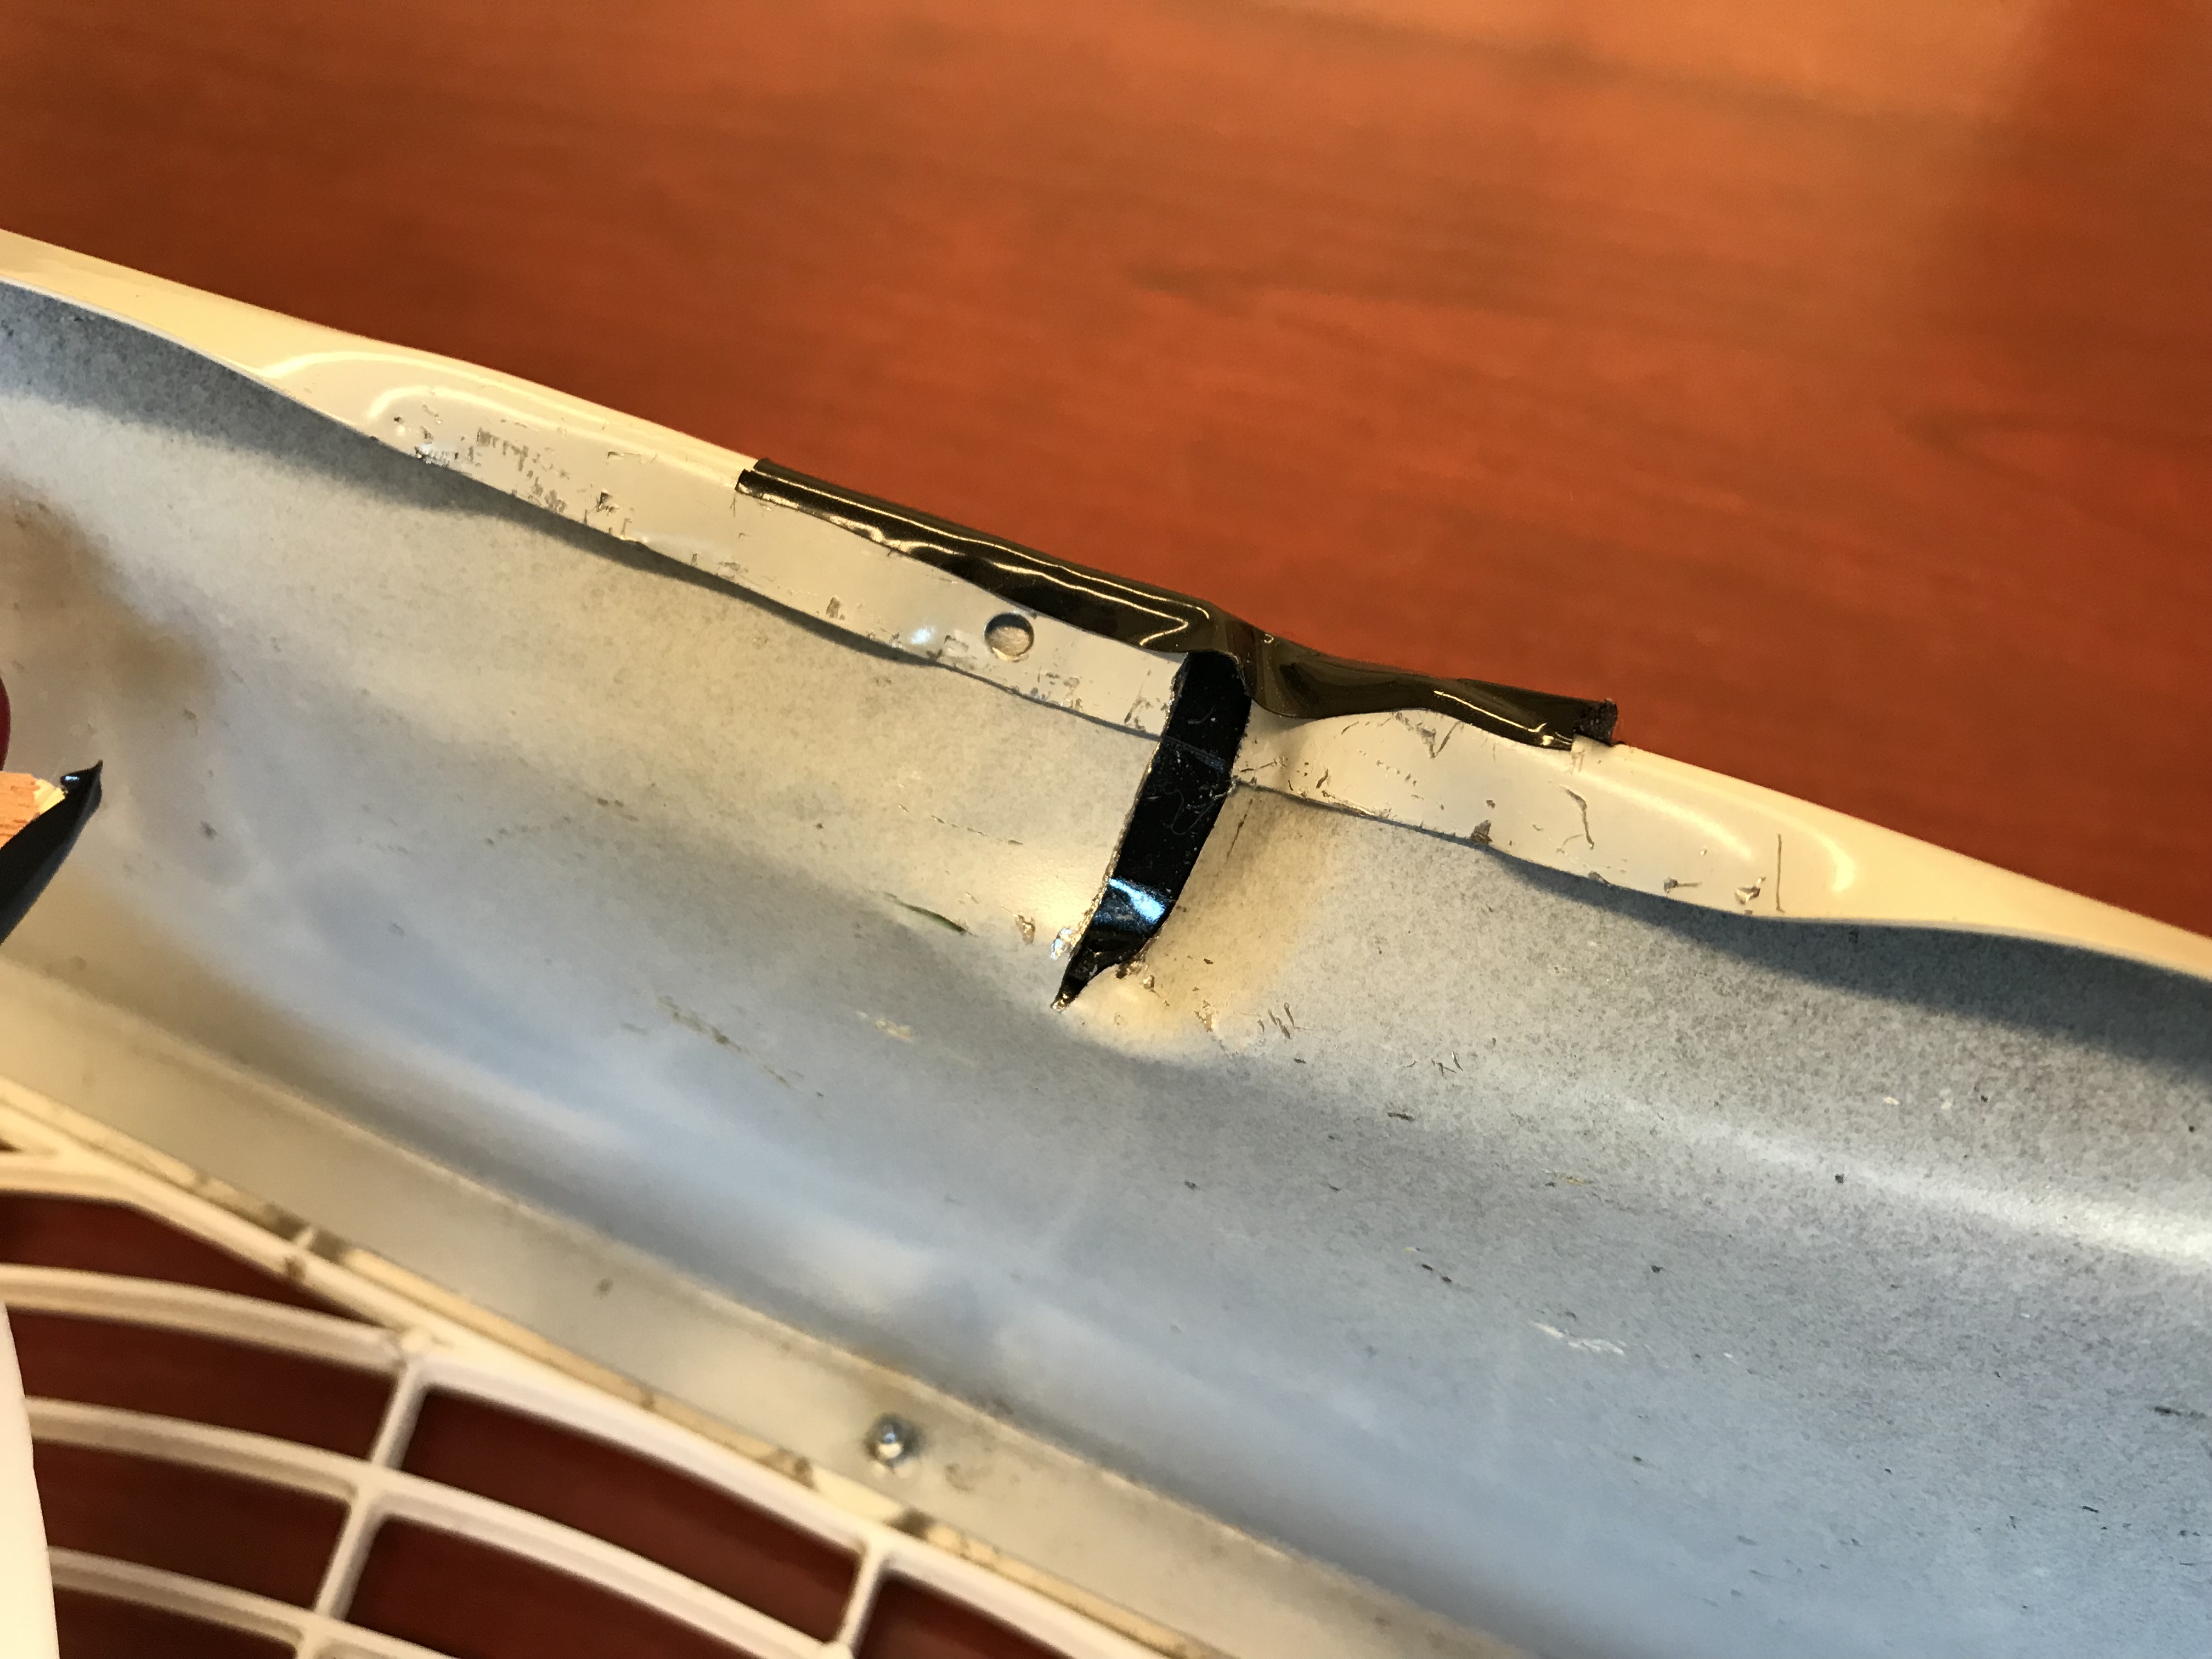
Bent fan edges to ensure smooth fan rotation with mounted hardware
Software Design
The majority of the software lay in understanding the math and how to actually draw things on the display. We will go in detail here on that as well as the overall program is structured.
Files
This file is used to convert the 7 by 5 C header file of the ASCII letters into the 5 by 7 C header file we need for this project. This format conversion is described in detail above in the text display section.
This file took in an arbitrary image that is size 49 by 49, and then converted it into an C array associating percentages of the fan arm with the LEDs to light up with their appropriate colors.
This is the file that we copied the output of parse.py into and contains the C array for each of the letters and what LEDs are needed to display them.
This is the file that we copied the output of generate.py into and contains the C array that represents the image we want to display in the correct format we want.
This is the main file where all of the hardware setup and actual interfacing happens. We utilize the 2 header files mentioned above for the text and image rendering respectively.
DotStar Interfacing Code
We use the sample code provided on Bruce Land's website to interface with the DotStar LED strip. We added some more helper functions that allowed us to extend functionality that was catered towards our project goals. These include letting us set multiple pixels at one time starting from 0, or letting us set multiple LEDs at one time starting and ending with custom indices. We also include one called clear_pixels where we set each of the LEDs to be full off.
Clock and Alarm Rendering
In order to use the circular display to render an analog clock, text, and images, we first need to understand how we are able to draw. Since every spin of the LED strip can only draw a single row, we need to know when to selectively light up certain LEDs. This is because as we spin around, different LED patterns will then merge together with the persistence of vision effect. Given that we have a reliable hall effect sensor reading, we are able to figure out how long each rotation of one of the fan blades takes in milliseconds. With this, we can predict at which period of time we will need to turn on or off each specific LED on the length of the strip. When we have calculated the time per rotation, we can simply do a ratio of the current time elapsed since the hall effect sensor has been crossed to see what percentage of the rotation the fan blade has gone through. This percentage is very important as we use it to calculate when to turn the LEDs on and off. Furthermore as we only have half of a strip of LEDs from the center of the fan to the edge, we are able to double our refresh rate simply by drawing “twice”. When one side of the LED strip (top) is at a certain percentage, we know that the other side of the LED strip (bottom), is at the opposite side or +0.5 range of the top percentage. This allows us to draw on both sides of the LED strip to ensure twice the refresh rate for better images and less flickering. With these percentages, we can very easily draw an analog clock since the clock hands are just a single percentage. When the percentage the fan blade is at is equal to the percentage of the hour, we simply draw the hour hand by turning on the appropriate LEDs. This same concept applies to the minute and second hands of the clock as well. To draw the edge of the clock, we just always light up the outermost LED (0 and 71). We also draw the major clock hour ticks as well. These are the 12 separate marks marking each hour. The way this is done is that every time we draw, we check the percent it is at right now and use the helper function get_closest_hour_tick() to figure out how many percent off it is from the nearest hour that comes before. For example, if the fan arm is ¾ between 1 and 2 o’clock, then the function would return x in percentage form in the image below.
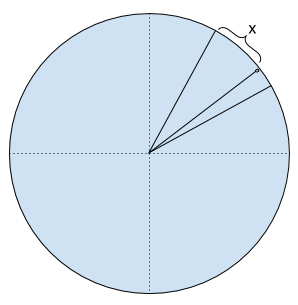
Clock representation of offset from nearest hour in percent
We then simply check if x is a value close enough to 0 with our other utility function in_range(). This function returns if 2 floats are close enough to be considered equal given a threshold. This is because there are rounding and calculation errors that if we were to just compare 1.8889 and 1.8888, they would not be equal. In our case, since the clock cannot have infinite degrees of accuracy in real life and is not perfectly continuous (every position can be drawn), we do an approximation to see if we should draw or not. In this case, if it is close to 0, we would draw since that means the fan arm is very close to the actual hour tick. We use this similar method to draw all 12 of the major hour ticks.
The alarm code is very simple. When we encounter that it is time to draw the alarm, we just don’t draw anything else but a growing circle of purple. This was achieved with a count variable that increased every time the alarm function is called.
Text Rendering
7 by 5 LED representation of ASCII character '1'
Drawing text is a little more tricky since each letter is composed of multiple “ticks”. We chose to use a 7 by 5 representation where we use 7 LEDs and 5 time ticks to draw each letter. This was a good approach because we were able to find C code online that already had nicely packaged ASCII characters. They were not exactly in the right format, however, since they are in a 2D array of size 7 by 5. This meant that they draw row first. However, because the POV display draws LEDs straight up and down first, we needed to convert it. We can almost think about it like we want to draw each column bottom up, and then left to right. We thus wanted a 2D array of size 5 by 7 instead. This was easily done in Python as we just rotated the array 90 degrees clockwise. After that and some simple string manipulation, we were able to output an updated C header file that we then could use in the code. The text itself is then manually set as a string inside the code. We then generate an integer array where each element correspond to the ASCII value (char) of the string at that index. We also then set a starting percentage for when to start drawing. When the fan spins and reaches that percentage, we can begin actually drawing. The actual drawing consists of keeping track of the current letter we are on and the current tick in the letter. We then just index into the letters array and retrieve the correct LED indices to turn on. Between every letter, we have a LETTER_SPACING constant that waits that many ticks before drawing the next letter. This is so all the letters don’t get crowded together. After all of the letters have been drawn, we turn stop drawing and wait until the percentage is at the start percentage again before drawing. With this, we are able to draw any of the provided 128 ASCII characters on screen. There are some problems though. The biggest one being that because we did not use cartesian to polar transformation, the letters themselves wind up looking more like this in actuality:
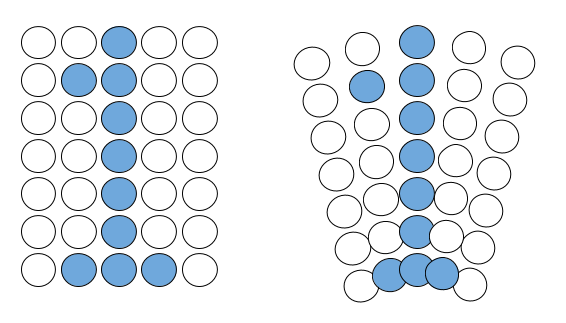
Problem with ASCII display with no cartesian to polar transformation
This is a minor problem, however, as they are still perfectly legible. Later on, we will talk about image drawing, which theoretically allows us to draw any image, and thus text.
Image Rendering
Lastly, in order to draw any image, we need to first understand the cartesian to polar transformation.
Cartesian to polar representation
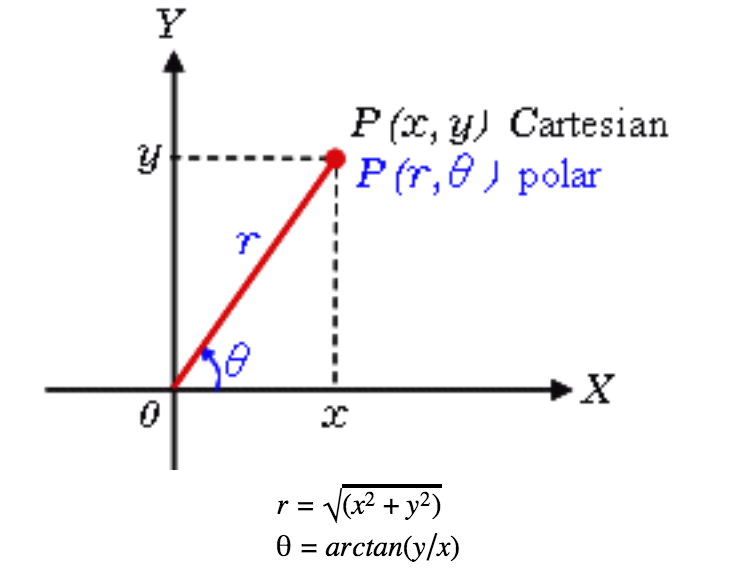
Cartesian coordinates is the standard representation where each point is denoted by (x,y). This works well for a rectangular display since every (x, y) coordinate would correspond to the respective pixel location on the display. This does not work out for the POV display application since the circular fan is inherently a polar system, and each point is represented with (r, θ). r is the radius and θ is the angle counterclockwise starting at the horizon of quadrant one (east). In our case, we chose to represent the angle using a percentage as stated above, clockwise starting in the (north). We chose this representation because we mounted the hall effect sensor at the top of the fan. We simply use the conversion percentage= -(θ+90) to convert from polar representation to our system. The r for our case would simply be the LED index starting from the center of the fan, but converted to be an absolute coordinate that will be talked about below in more detail. This representation works very well and intuitively.
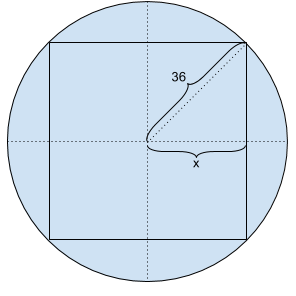
Maximum image size to display in terms of number of LEDs
Now that we have a representation to denote our images in a format with respective to the fan, we can convert any image into the representation we need for our project. We wrote a Python script for this task. We read in any image and scale it to 49 by 49 since we only have 72/2 = 36 LEDs per side. We know that for an isosceles right triangle with 45, 45, and 90 degrees, the hypotenuse will sqrt(2) times the length of the edge. In the picture above, we can see the circle as the fan and the square as the max size image we can draw. In this case we want to find 2 * x. Thus, 2 * 36/sqrt(2) = 50.911 gives us a limit on how wide the image can be. We need to round down since otherwise we will have to deal with image clipping. In addition, 49 was nice since an odd number means we can have a pixel exactly in the middle of the image.
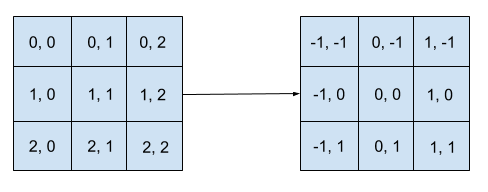
Absolute to relative cartesian coordinate transformation
After scaling, we read through each of the RGB values, and on the fly convert the (x, y) into relative coordinates to the center of the image, which is (25, 25). This is shown above. This is to facilitate conversion to polar coordinates.
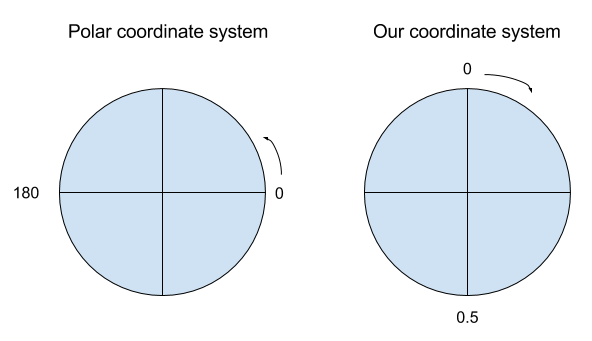
Difference in polar coordinate systems
These relative coordinates are then converted into polar coordinates with the above equations and then formatted into polar coordinates for our clock system. We actually use a set of modified equations because of the way our system using a different coordinate system as shown in the picture above. Note that we do round the percentage values afterwards because of the lack of infinite precision while rotation in real life. We round to 2 decimal places so we get percentages from 0.01 to 0.99. After we processed all the pixels, we then group each of the tuples by the percentages. Next, we convert each of the r values calculated into absolute LED index coordinates. This is because the SPI takes in an array starting at 0 to the 71nd LED. The polar coordinate r, however, is relative to the center of the screen. That would only go from 0 to 35 for the top portion and 0 to 35 for the bottom portion. We want to combine each of the portions with its counter part across the beam and then fix the indexing.We first define 2 constants where MID_LEFT_LED is index 35 and MID_RIGHT_LED is index 36. The top LEDs’ index values then become MID_LEFT_LED - old_led_index. The bottom LEDs’ index values then become MID_RIGHT_LED + old_led_index. We then merge the 2 lists together and sort them so we have all of the LEDs indexing from 0 to 71. Keep in mind that this is done two times for each “position”. For example, when the arm is at percentage 0, the top values are retrieved from percentage 0 while the bottom is retrieved from percentage 0.5. These are then merged and sorted and put into a new dictionary at percentage 0. Then, when the arm is at 0.5, the top values come from percentage 0.5 and the bottom values from percentage 0. These are then processed the same way. We do this because we want twice the refresh rate and use the entire strip instead of just half of it.
After conversion, we have a dictionary where the key is the percent, and the value is a list of tuples in the format of (absolute LED index, r, g, b). We then do some string formatting and output the whole dictionary as an array that we then put into a C header file. This C array is in the format of a set array of structs with size 100. Each of the structs contain a percent field and an leds_vals field. The leds_vals field is in the format of {led index, r, g, b, led index, r, g, b, …, -1}. This -1 lets us delimit the end.
The greatest problem we dealt with here is that we only have 128KB of flash memory that is available on the PIC32. Since each 49x49 image stored in flash memory takes about about 50KB each, the PIC32 is only capable of storing a maximum of about 2 images. As a result, a user is only limited to two pictures at one time. An extension we plan on working on is the addition of external memory so the POV display is able to store multiple images and then cycle through multiple frames to display an animation.
Hardware Interfacing
ISR for Timer 2
We used ISR with timer 2 interrupting at 40000 cycles, which is about 1 millisecond. This is to perform all of the draw functions as we talked about above. Inside here is when we calculate how long has elapsed since the last time the fan arm has crossed the hall effect sensor. This is then converted into the percentage and passed into the appropriate draw functions. We always clear the pixels with clear_pixels() first, perform drawing with any of the draw functions, and then call show_pixels().
ISR for Timer 3
This ISR is setup the same way as ISR for timer 2. It’s solely used to keep track of a human readable time for the alarm. We simply tick the time upward every millisecond, and perform the correct second to minute to hour conversions.
Hall effect sensor Interrupt
Inside the main method, we set up port B pin 14 to be a digital input. Then we configured Interrupt 1 to execute with priority 4 on the falling edge and hooked it to the pin. This allowed us to interrupt when the hall effect is triggered. Because the hall effect sensor is active low, we chose to use the falling edge. When it is triggered, we calculate the difference between current abs_time and the previous_crossing_time. This different tells us how long it takes for one rotation of the fan arm. These values is to facilitate ISR for Timer 2 to actually be able to draw correctly.
Results
One of the first things that we did was use a blinking light to figure out approximately how fast the fan is rotating. We saw that it is approximately rotating at 7 Hz --> 143 milliseconds --> 143/60=2.38 ms for each tick. We can see that because human eyes retain images within 1/30 of a second, or 33 milliseconds, this is refreshing way too slowly. With the software hack of rendering twice as fast, we are able to get 14 Hz --> 71 milliseconds --> 71/60=1.183 ms for each tick. This is a significant improvement, and how we decided to use 1 millisecond as our interrupt time. However, it is still twice too long for a perfect persistence of vision. In the future, we can very easily turn the fan’s setting up one more and change the ISR time to be faster than 1 ms. This will allow us to have almost perfect persistence of vision. In fact, we can go in reverse and find that the fan must rotate at 30 Hz. This will allow us to get 1/30 second rotation period. The ISR must then interrupt at 0.55 ms. This is totally doable as the PIC32 can perform interrupts with period 0.0005 ms. In other words, it can do it 1000 times faster.
Coming back to this case, we were able to get a pretty good result without much flickering. We show the results of both clock and image display below. However, because of the quick shutter speed on the camera, we could not capture one frame comprising of the whole image. The images below are long exposures of our system, which is why the lights seem to be dim. The YouTube video showcases the POV effect on our display a lot better though we do have to deal with the problem of the fast refresh rate of the video camera. Hence, the results of our POV display is best viewed in person.
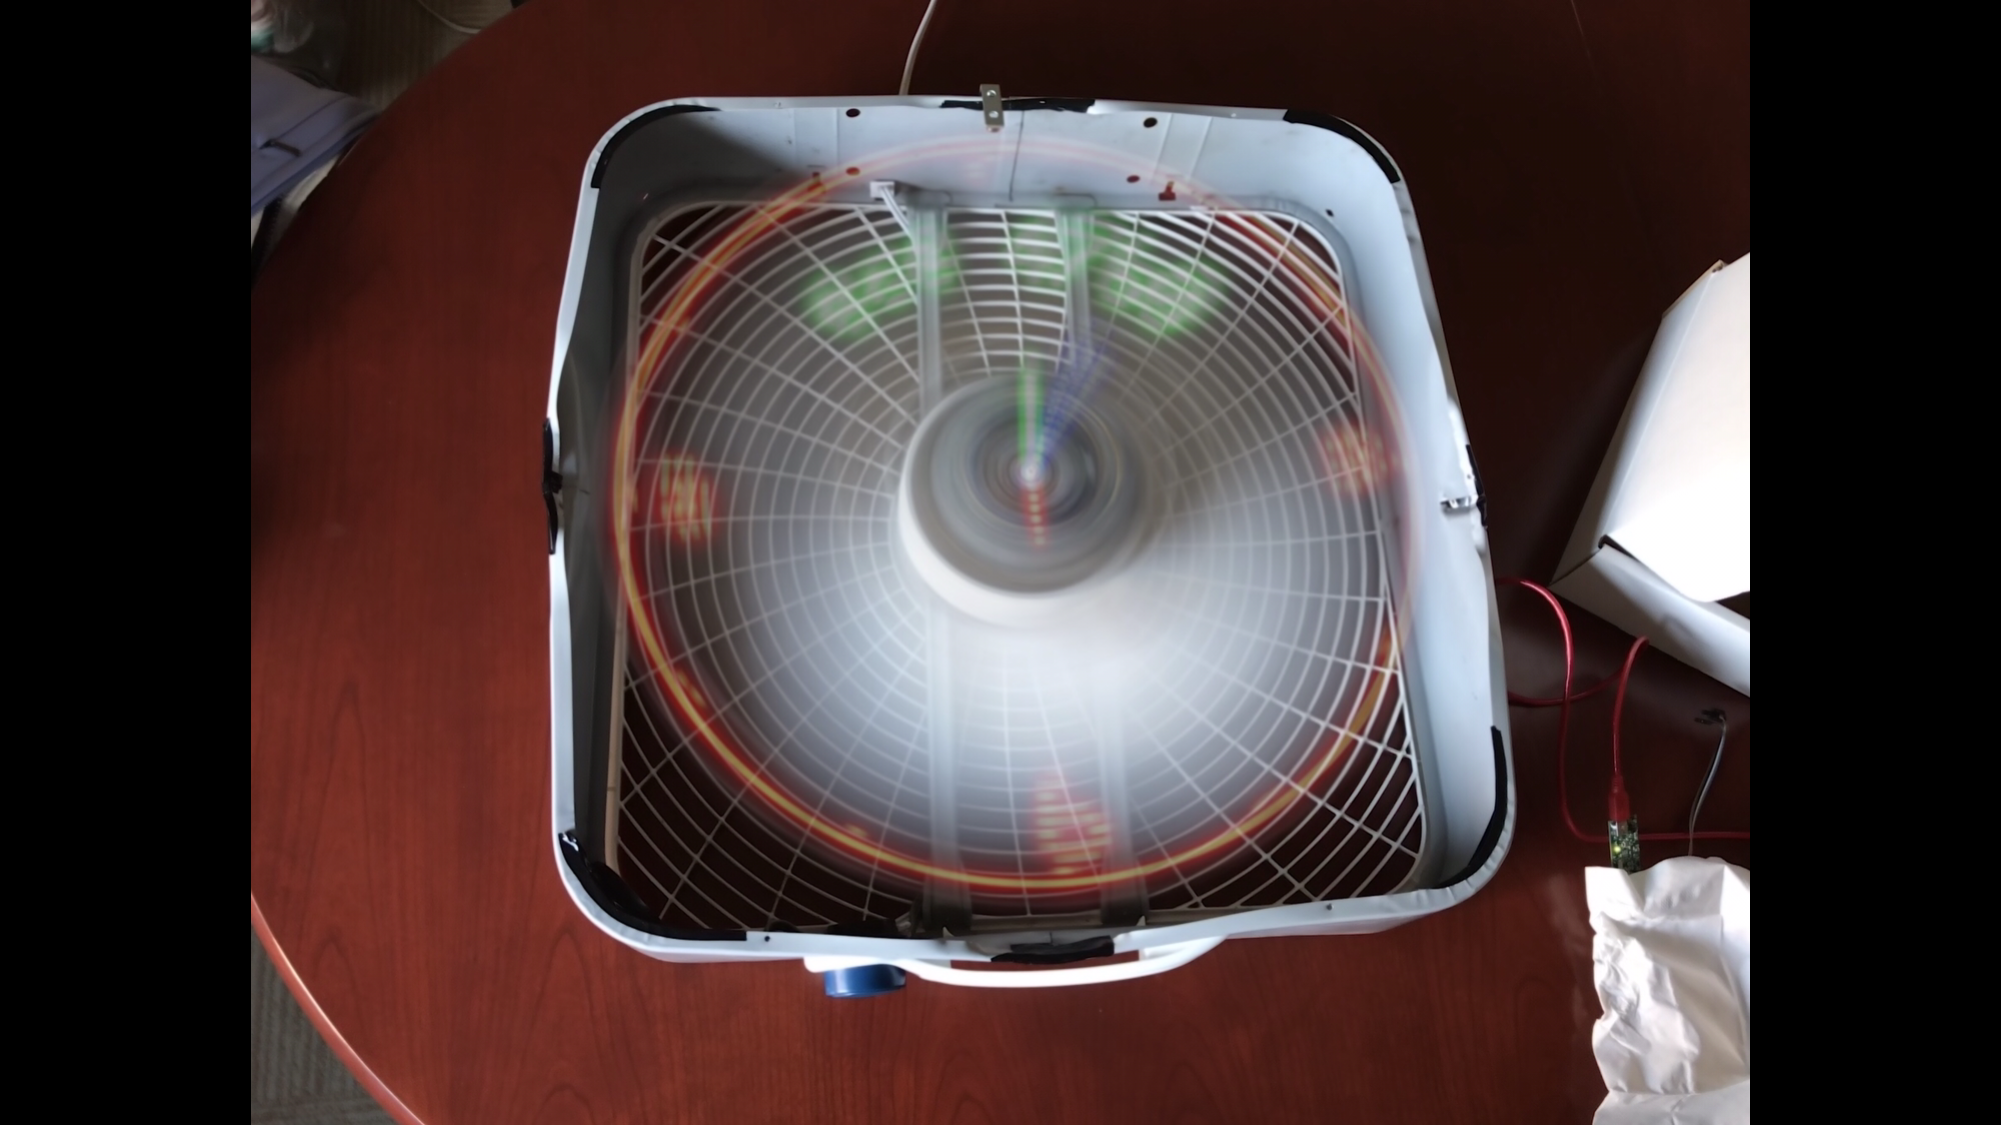
Long exposure image of POV analog clock display

Image of Pac-Man ghost Blinky used on the POV image display
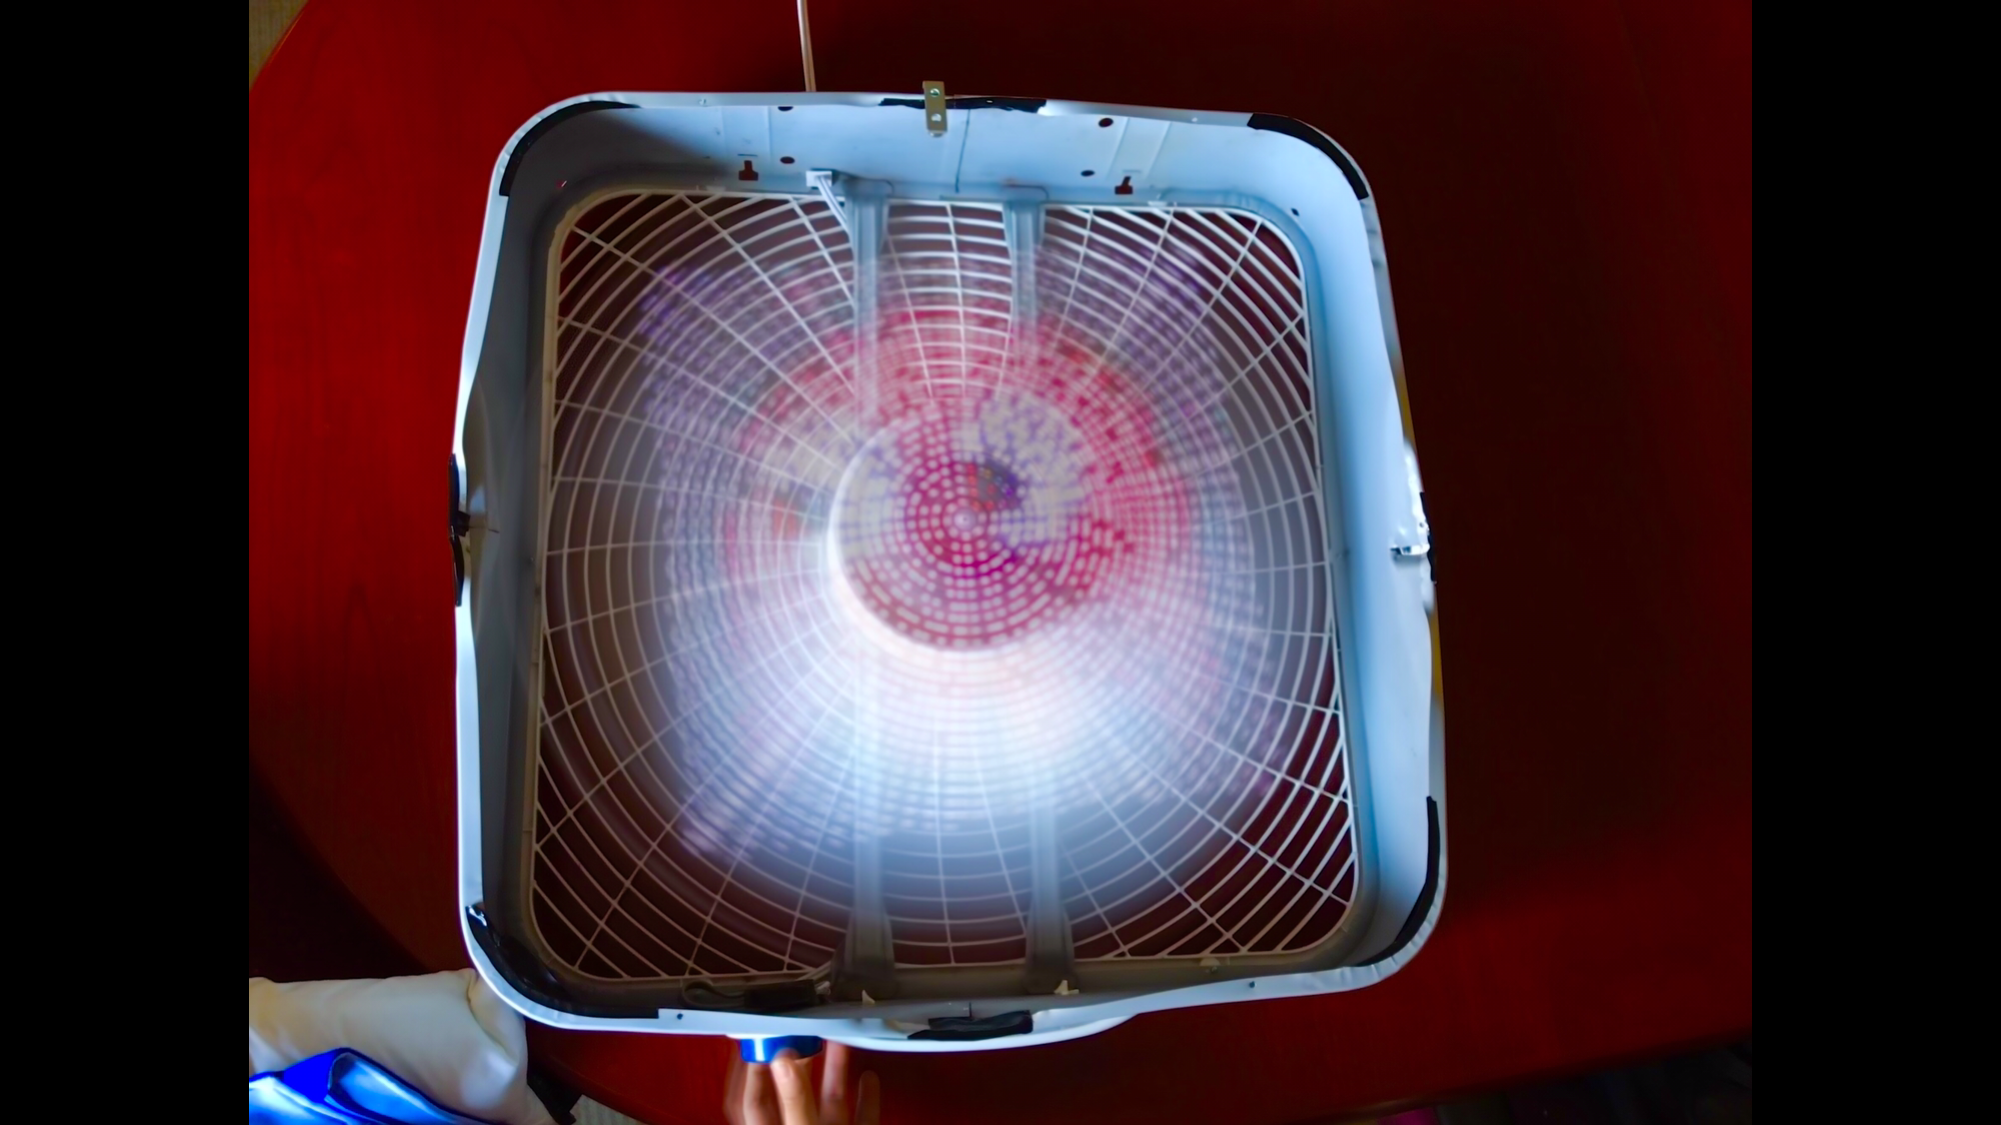
Long exposure image of Pac-Man ghost on POV display
Initial testing of the DotStars consisted of testing various LED blink configurations down the strip. After the SPI between the PIC32 and the DotStars was setup using the level shifter, the first thing that was testing was sending a single green LED that would incrementally traverse the entire strip. We then looked to see how we would configure the RGB colors on the LED and then wrote helper functions that would allow us to flash different patterns at varying times. This initial testing verified the correctness of our math and allowed us to move onto rendering LEDs based on the period of the fan.
The timing of the POV clock display is very accurate. We used a stopwatch timer to verify the duration of a minute and it matched exactly with the time that was shown on our POV display. The DotStars can refresh up to 32 MHz, and with the calibration of the hall effect sensor, was able to get a consistent output.
In terms of image resolution, the resolution that the POV display shows is not as clear. This is because the LEDs are not as closely spaced together the further they get away from the center, and there is a result is a certain degree of information loss when each pixel is converted from Cartesian to polar, and then to the percentage we use to draw a pixel at a location around the fan. This resolution can be improved had we used a fan with a larger radius or LEDs that were more closely spaced together.
The construction of the display is mechanically sound. The level-shifter circuitry, PIC32 small board, and corresponding batteries are very firmly mounted on the centerpiece of the fan with little room for movement. The 0.5m LED strip lies flat against a wooden strip that is mounted on the fan centerpiece with a few small wood screws. The magnet is mounted using an L bracket that is magnetically attached to the fan, and the hall effect sensor attached to the end of the wooden strip is hot-glued to ensure secure positioning.The robust construction of the peripheral hardware as a result strongly reduces the room for error with the LED calibration and display as the fan rotates.
As a the purpose and functionality of the POV display we designed is self-contained, there is no external communication and signals that are meant to be transmitted across devices. As a result, there is no CPU noise or RF interference that can meddle with other people’s projects.
The usability of our POV display is quite simple. The given user interface of the fan allows the user to select between the various speed modes on the fan and still have the consistent image displayed regardless of speed. If a user wishes to change the custom image that is displayed on the fan, our Python script is able to convert it into a 49x49 pixel image with the necessary format to be included in the header file for display. Furthermore, part of our decision in using the DotStar LED strip was it’s wide color selection and customizations for different intensities. As a result, if a user is impaired by color-blindness, the display colors can be adjusted as necessary to view the same image.
Conclusion
Overall, the design of our POV display met our expectations well. Our display is mechanically robust, and we were able to figure out the math behind displaying images and text for multiple applications ranging from a real-time analog clock to any desired image. Given more time to extend our project, we would add a hardware switch that can allow a user to toggle between the clock and image display. This would eliminate the need of having to re-program the PIC32 to switch between the two display modes. Another extension we would add is to design an Android application that would communicate to the hardware on the fan via bluetooth. The app would allow the user to select any color on a RGB wheel and draw a custom image on a user interface. The user-created drawing will then be displayed on the POV display in real time. Furthermore, adding more external flash memory would also allow the POV display to store more images and create an animation. This could can be combined with the Android application such that a succession of images can be created and then displayed on the fan.
The design of our project did not use any applicable standard that had limiting legal restrictions. Sample code and protocol information about driving pixel display strips was referenced from Bruce Land's website. We incorporated the functions for setting RGB pixels on the DotStar LED strip within our custom functions for displaying the clock and image drawing. Furthermore, a full ASCII 5x7 character set from Bruce’s website was referenced for the drawing of numbers and letters on the POV clock display. We wrote a Python script to parse the reference ascii header file so that the ascii character array is stored horizontally as opposed to vertically to match format in which we draw characters on the DotStars.
In terms of existing intellectual property considerations, we did not reverse-engineer a pre existing design or need to sign a NDA to get a sample part. Existing patent US 5748157 A: Display apparatus utilizing persistence of vision discusses a display device that utilizes a microcontroller that uses cyclic motion produce 2D and 3D images. This patent aligns with the persistence of vision concept used for our display mounted on our fan. However, our project is fully original work and does not use existing patents, copyrights, or trademarks. The hardware was designed and constructed from scratch and all the code was written by ourselves. At this point in time, there are no patent or publishing opportunities for our project.
Adhering to the IEEE Code of Ethics is a priority for our project. All the information, data, and discussion in our report is honestly and realistically stated based on our work throughout the design of our project. We hope that the details outlined in our report and video will improve the understanding of the capabilities and societal implications present in conventional and emerging technologies. Furthermore, we accept the responsibility in making decisions that affect the safety, health, and welfare of our users. Particularly, since our project contains moving parts, we ensure that anybody within close proximity (< 1 feet) from our device must be wearing protective eyewear to avoid potential injuries. All external hardware is firmly mounted on the centerpiece of the moving fan such that no parts will be physically detached from the moving blade on startup. With regard the LEDs, the Dotstar LED strip is capable of displaying any color at a range of intensities so users impaired by color-blindness are able to easily change colors as desired. Most importantly, in our development of this project we make sure to assist our fellow classmates in their final projects when necessary and to support them along this code of ethics. We would like to thank professor Bruce Land and the course staff who offered assistance in the design and development of our final project.
Appendix
The group approves this report for inclusion on the course website.
The group approves the video for inclusion on the course YouTube channel.
Commented Code
We will only include here the code we wrote, including the scripts that we used for porting over some existing code. The original ASCII text can be found here. The protothreads library can be found here.
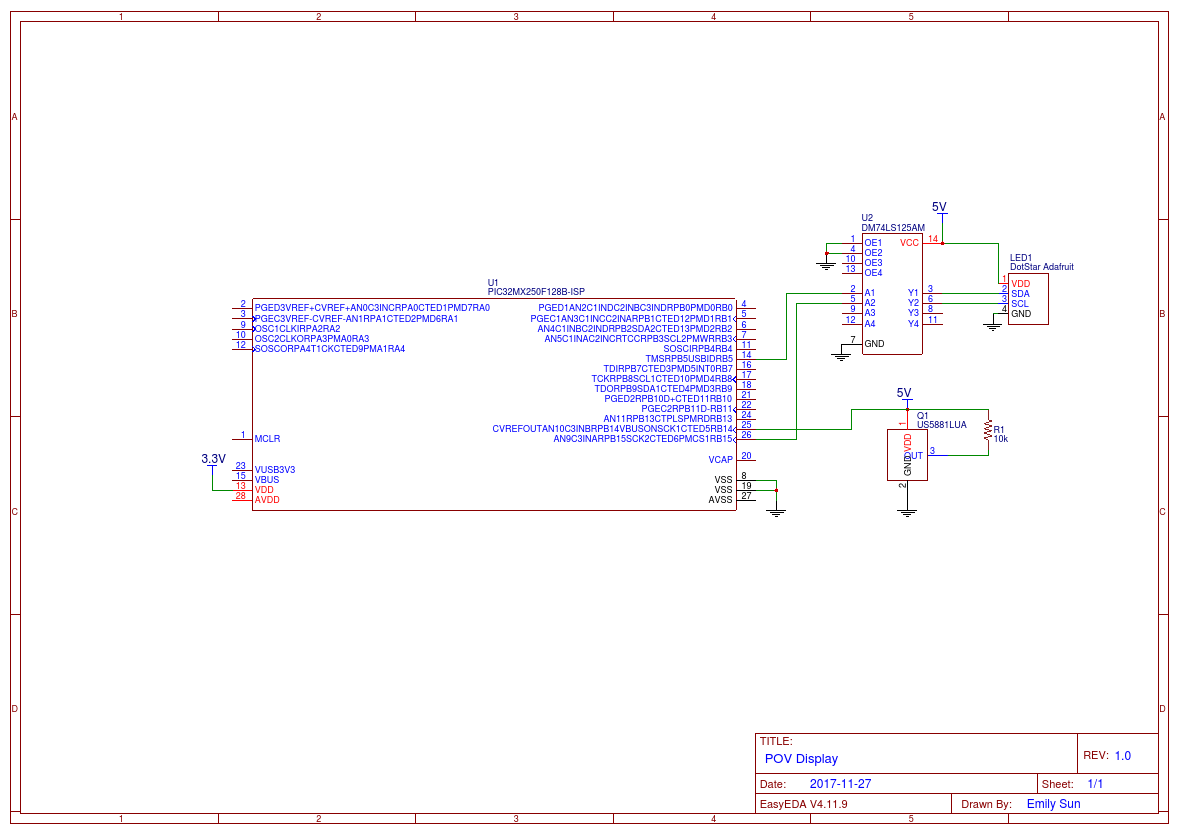
Schematic
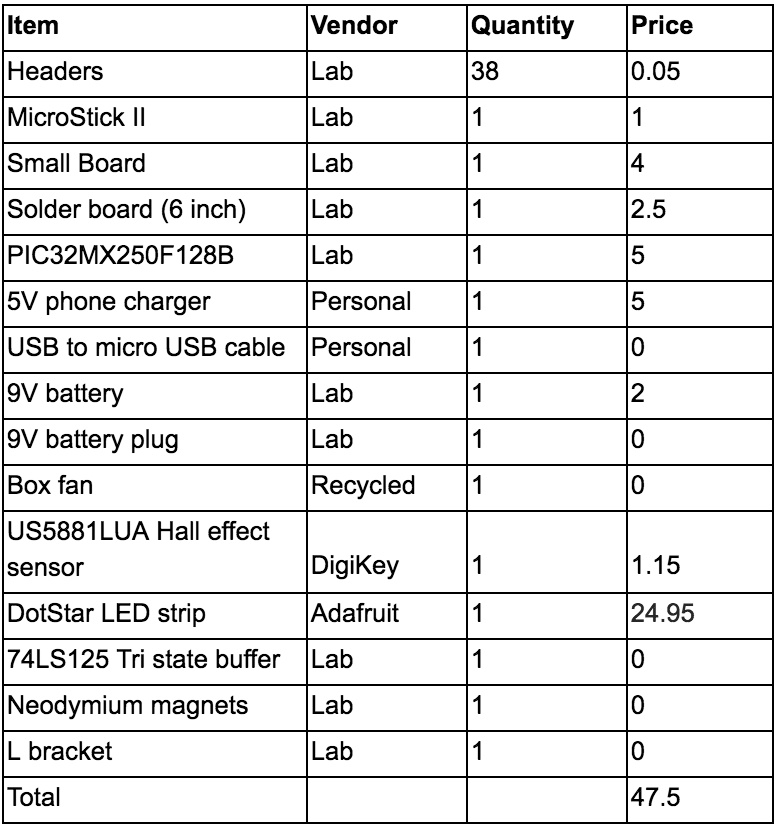
Cost Details
Work Distribution
Emily
- Hardware design with level shifter and hall effect circuitry
- Put together protoboard
- Mounted components on fan centerpiece
- Implementation of alarm functionality
- Implementation of text display
Han
- Implementation of clock display
- Implementation of image display
- Wrote Python script for preprocessing ASCII text and image to C array header file
- Constructed wooden beam
References
We would like to thank professor Bruce Land and the numerous TAs who offered their guidance throughout the course of this semester.
Data Sheets
PIC32 Peripheral Library Guide
74LS125 Quad Bus Tri-State Buffer
US5881LUA Unipolar Hall Switch
Vendor Sites
Code/Designs Borrowed from Others
Background Sites/Papers
N/A