Eye Snake - High Level Design
Project Rationale
In 1848, Emil du Bois-Reymond observed that the cornea of the eye is electrically positive relative to the back of the eye. It is as if the eye were acting as a single dipole oriented from the retina to the cornea. These corneoretinal potentials are well in the range of 0.4- 1.0 mV. Therefore as the eye moves, this moving and rotating dipole source generates signals that can correspond to eye movements. This forms the basis of the electro-oculogram (EOG). Typical signal magnitudes range from 5-20 µV per degree.
The electro-ocular potentials were interfaced with the Snake game to test the user’s ability to play the game by moving their eyes left, right, up and down. Because it is difficult to view the screen if the user’s eyes are held in the position of “left,” the direction of the snake’s movement will be triggered when the user moves his/her eyes in that direction, whereupon the snake will continue to travel in that direction until the user’s eyes indicates a change in direction. Also, while it would be ideal for the user’s eyes not to swing from corner to corner, we’re not able to ensure that for each test subject and between each individual subject that they would be move their eyes to an angle of thirty degrees consistently. Therefore, left corresponds to rolling your eyes all the way to the left, and up corresponds to looking up at the ceiling.
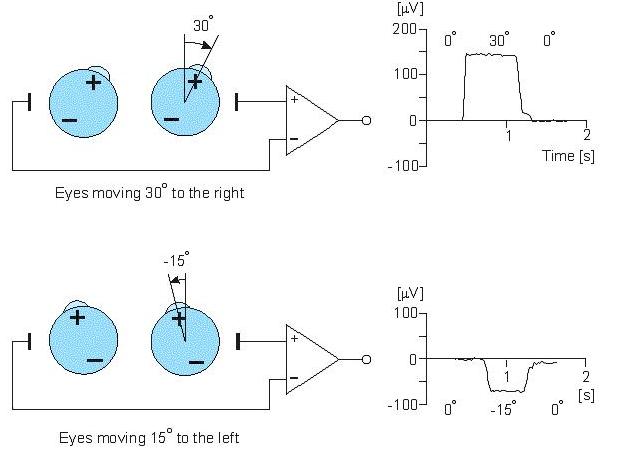
The figure above shows the measurement of horizontal eye movements by placing a pair of electrodes outside of the left and right eye where the outer canthi are. At rest, the electrodes will be the same potential and thus, no voltage is recorded. The rotation of the eye to the right causes the difference of the potential to be the positive in the direction of movement relative to the second electrode. This same concept applies to the measurement of vertical eye movements as well.
Known Tradeoffs
Electro-oculography has a major tradeoff over other methods such an infrared sensitive cameras for determining eye movement. One of its greatest disadvantages of EOGs is that the corneoretinal potential is typically not fixed and has been shown to vary throughout the day. Moreover, it is subject to influences by light and fatigue, and other factors. Thus, frequent calibration and recalibration needs to be done. Other obstacles include muscle twitching and the general non-linearity of this method. EOGs can typically achieve up to ±2° accuracy and a maximum rotation through the EOG is ±70°. Unfortunately, the linearity becomes progressively worse for angles beyond 30°.
Because of these tradeoffs, at the beginning, this technology seemed a bit unreliable. Medical literature suggested that careful placement of electrodes and a minimally noisy environment was essential to achieving a minimal or any signal at all. In addition, in comparison with EMGs, EOGs, and EEGs, electro-oculograms (EOGs) have the smallest frequency and amplitude range as seen in the following table below. The likelihood of amplifying noise and not receiving a readable electro-ocular potential was a challenge that we were willing to take.
| Frequencies of Biopotentials | ||
|---|---|---|
| Signal | Frequency Range (Hz) | Amplitude Range (mV) |
| EOG | 0.01-30 | 0.001-0.3 |
| ECG | 0.01-100 | 0.05-3 |
| EEG | 0.1-80 | 0.001-1 |
| EMG | 50-3000 | 0.01-100 |
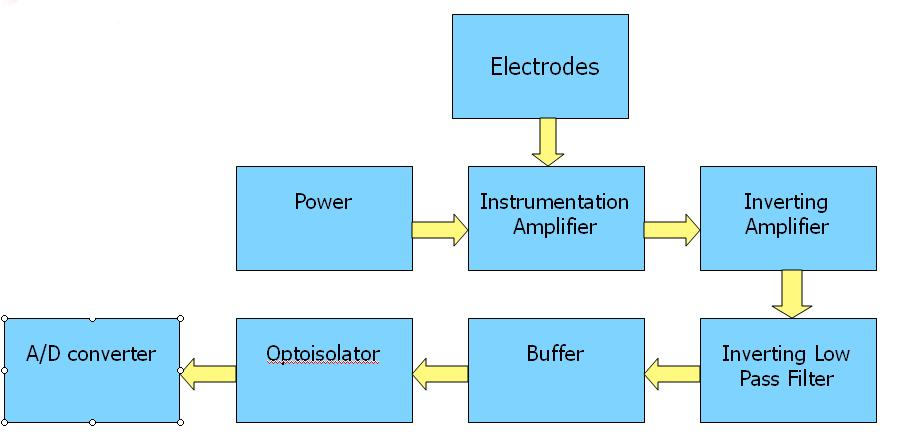
High Level Analog Block Diagram
The following figure shows the overall high-level design for our electro-oculogram:
Background Math
As mentioned in the chart above, the EOG potential is on the order of 5-20 μV per degree of rotation. We calculated which resistor to use for the instrumentation amplifier by using the following equation:
Moreover, by understanding that the EOG frequency is between 0.01 – 30 Hz, we utilized an inverting active low pass filter to filter out 60 Hz noise and other noise signals that may be picked up through the electrodes. The 3 dB cutoff frequency can be calculated using the following formula:
Standards
We don’t know of any existing patents, copyrights, and standards that we could be infringing upon. We do owe the credit of the game design to the inventor of the Snake game. However, the game is so old that we were unable to find out who originally wrote the game; there are, however, multitudes of different versions of snake online, so we are fairly certain that the game we have written does not infringe on any copyright.