ECE 4760: Final Project
Blood Pressure Sensor Using NIRS
ECE 4760: Final Project
Michelle Felizardo & Hannah Gallovic
Contents
Introduction
High Level Design
Hardware & Software Design
Results
Conclusion
Appendices
Introduction
Our project takes blood pressure estimations using near-infrared spectroscopy sensors to calculate pulse wave velocity between two points on the human body.
We created a blood pressure meter using near-infrared spectroscopy. After both having taken ECE 3530: Introduction to Systems and Synthetic Biology, we grew increasingly interested in biological systems, specifically brain machine interfaces and hardware wearables. We explored several different ways of learning more about the human body using near-infrared spectroscopy (NIRS), and eventually chose the idea of measuring blood pressure through collecting data on pulse transit time between two points in the body. There has been a lot of research done on using NIRS in clinical settings, and we found this concept both interesting and challenging.
Back to top
High Level Design
Rationale and sources of our project idea
We determined that we would be able to find blood pressure estimations by recording pulse wave velocity of blood traveling from the upper arm down to one's index finger. To do this, we read in data through two analog inputs on the PIC32, and calculated the time at which the pulse wave reached each location mentioned. From the phase offset of these two waves as well as the distance between the two places measured on the arm, we calculated velocity. From existing research papers, we know that velocity correlates with pressure and that this relationship is linear within one person. Therefore, using a blood pressure sensor cuff, we could calibrate this blood pressure-pulse wave velocity linear correlation by taking several arrival time data points of when the pulse reaches each part of the arm.
Background Information
Near infrared spectroscopy has many applications in clinical settings, due to its effectiveness and the fact that it is noninvasive. At certain wavelengths, infrared light is able to penetrate human skin and bone. An IR LED can be oriented on the skin such that it is shining light into the arm. When the IR light reaches blood vessels in the human body, it reflects off hemoglobin in the blood. Some of this reflected light scatters in random directions, but a good amount of the light is reflected back out through the skin. If an IR light detector is placed on the skin next to the IR LED, also facing into the skin, this sensor can detect the amount of light reflected back out.
As the heart contracts and relaxes, it pumps blood through the body, creating the pulse felt at different parts of the body. This pulse is a brief increase in blood flow that occurs continuously, and therefore can be detected as a periodic signal. Because NIRS can detect the amount of blood flow, when the pulse wave arrives at a certain point in the body, the amount of IR light reflected back out through the skin increases. The signal output from the IR sensor is therefore the pulse signal itself, if filtered correctly.
Logical structure
Pulse data is first sent through a filter stage in hardware with a bandwidth of 0.1 Hz to 10 Hz, followed by a scaled offset circuit that can take in this pulse signal and put it in a range that the PIC32 can handle, i.e. 0V to 3.3V. The pulse signals are then read in an analog input on the PIC32 through the 10-bit ADC. These two pulse signals are analyzed to determine the time difference in the two pulse wave arrivals, which is then used to calculate blood pressure. The waveforms and BP are displayed om the TFT.
Back to top
Hardware & Software Design
Hardware Details
The hardware of our project can be split up into three stages: the IR sensor, filtering stages, and a voltage offset circuit, and was duplicated in order to take in the two pulse signals. Our IR sensor is made up of an IR LED emitting light at 940 nm into the skin, as well as an IR light sensor. For the light sensor, we used a photodiode, OPT101 from Texas Instruments. We chose this component rather than a regular IR detector because the OPT101 has a transimpedance amplifier onboard, converting the current to voltage and amplifying the output. These two components, the LED and sensor, were soldered onto a small board, both facing the same direction and with a little space between them (light reflected back out scatters such that its highest intensity is not directly next to from where it was emitted). See Figures 3 & 4 for photos of the two sensors. Power, ground, and output wires were also soldered onto this small board, which then connect to the rest of our circuitry on a breadboard. These wires needed to be somewhat long, since the sensor board needed to be placed on the fingertip and arm for readings. On the breadboard, the LED is connected to power through a 330Ω resistor in order to limit its current. The photodiode is also powered by 5V on the breadboard, and also includes a 0.1μF decoupling capacitor between its power and ground lines. The output of the photodiode goes to the input of the next hardware stage, the filters.
The filter stage consists of a low pass filter and high pass filter, with some amplification as well. We designed the filters to have a bandwidth from approximately 0.1 Hz to 10 Hz in order to capture all components of the pulse wave, while filtering out high frequency noise. The two filters were incorporated into a non-inverting operational amplifier (LM358) circuit, which also included gain of about 34. For the high pass filter, we chose a 10μF capacitor and a 160kΩ resistor to get the cut-off frequency of 0.1 Hz. For the low pass filter, we chose a 0.47μF capacitor and a 33kΩ resistor to get the cut-off frequency of 10 Hz. There is also a 1kΩ resistor going into the negative input of the op-amp to ground in order to create a gain of 34 together with the 33kΩ feedback resistor. As described before, the output of the sensor goes into the non-inverting input on the op-amp. At the output of the op-amp, a small pulse signal can be seen, approximately centered around 0V. Because the PIC32 has a voltage range of 0V to 3.3V, this signal must be such that it meets these specifications. Therefore, the next stage of our hardware is a voltage offset op-amp.
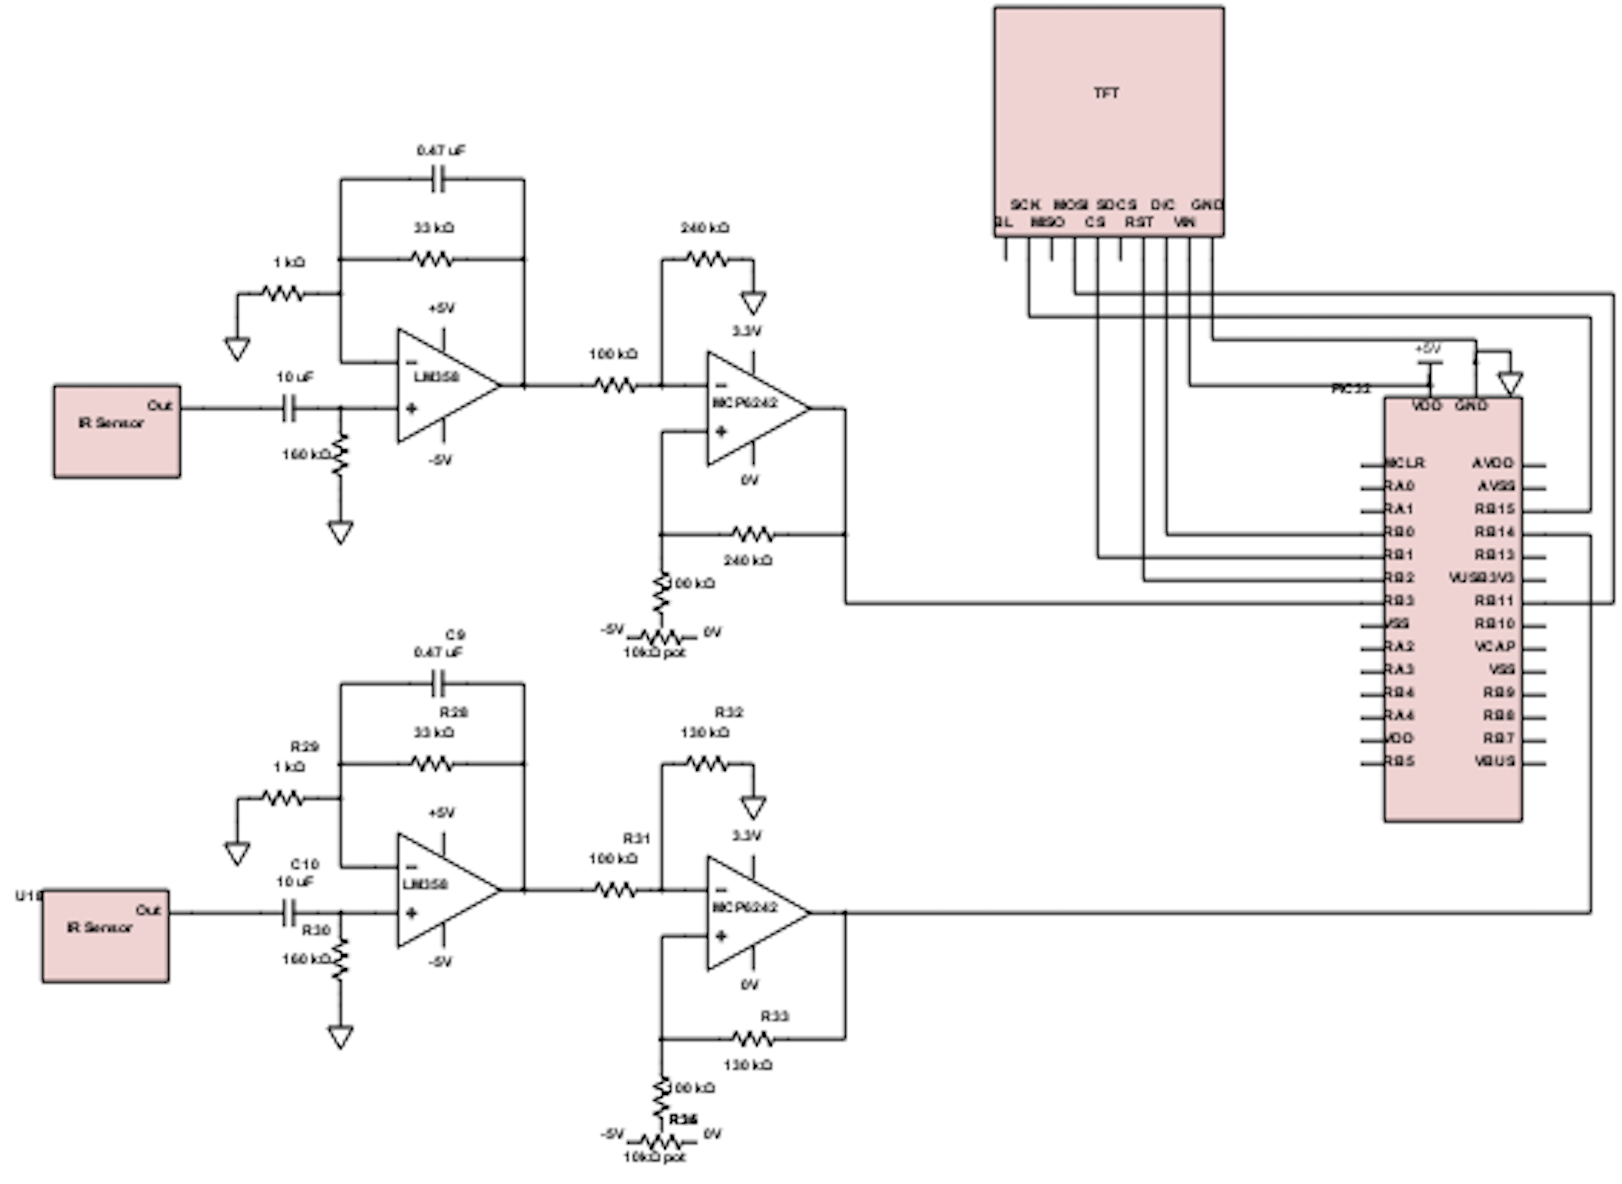
The output of the previous filter stage goes into the non-inverting input on an op-amp (MCP6242). The purpose of this circuit is to shift the +/- 5V signal from the previous output to 0V to 3.3V before going into the PIC32. We also include gain in this stage. The op-amp circuit is configured as a differential amplifier, with the input going into the positive input on the op-amp, and a voltage offset going into the negative input. The gain is set by a feedback resistor, and the pairs of resistors are matched in value in order to have a common mode gain of zero. The op-amp was powered by 0V and 3.3V in order to set the maximum and minimum rails of our signal. In order to create the voltage offset, we wired a 10kΩ potentiometer between -5V and 0V to create an adjustable voltage divider. Because our pulse signal has a lot of DC drift, we wanted to make sure we could easily adjust the voltage offset as necessary each time we calibrated our device. The offset ended up being rougly 1.6V. Finally, the gain set in this stage differed between the arm sensor circuit and the finger sensor circuit. These two places on our body obviously have physical differences, and the signal given from the sensor varies between them. Therefore, we needed to set the gain differently for each. We did this by experimentation, choosing different resistor values and looking at the output of the circuit on the oscilloscope in order to find the optimal gain. In our final design, the arm circuit had a gain of 1.3 and the finger circuit had a gain of 2.4. After being amplified and shifted, the pulse signal at the output of this circuit was now sufficient to be input to the PIC32. See below for a final schematic of our circuit. See Figure 2 for a photo of our final hardware setup.
Final Schematic
Software Details
The program we wrote to configure our PIC32 follows a relatively simple structure. It begins by setting up the 10-bit analog-to-digital converter in main(). It is configured such that it has the capability to read from two analog inputs, AN5 and AN11. It then opens and enables ADC10. In main(), the two analog input pins are also set, as well as initializing the TFT display and scheduling the ADC protothread.
The ADC protothread is scheduled to run at a rate of about 66.67 Hz. This relatively low sampling rate is sufficient for our purposes, since the human pulse only has a frequency of about 1 or 2 Hz. The thread begins by checking if all of the samples have been collected yet (number of samples to collect is set by a variable at beginning of program). If not, then the program first sets the ADC10 channel to AN5 to collect the sample out of this pin, which is the output from the arm circuit in the final hardware stage. The sample is read into a variable, and then the program sets the ADC10 channel to AN11 to collect the other sample, which is the output from the finger circuit in the final hardware stage. After setting each channel, the program yields for 5 ms in order to allow the PIC32 to switch channels. The program then converts these two data values into a voltage and saves each to a data array.
When all the samples have been collected, the program plots the two pulse waveforms on the TFT display. If a value for blood pressure has been calculated at this point, it will display this on the TFT as well, otherwise it will display a message informing the user that calibration data is still being collected (different than the data collected for each iteration of the data arrays). Finally, the ADC thread spawns the blood pressure calculation thread.
Within this thread, the two data arrays are analyzed in order to calculate systolic blood pressure. As described previously, blood pressure can be calculated using the difference in the arrival times of two pulse waveforms measured at two different places on the body (in our case, the bicep and the fingertip). In order to determine this time difference, we chose to measure the time between the voltage midpoints of each pulse wave. We chose the midpoint rather than the minimum and maximum because of the DC drift that the pulse waveform undergoes. The first task this thread has is to determine the maximum and minimum voltages for each of the two pulse waveforms, from which midpoint can be found. The program iterates through each data vector to find and max and min voltage values, and also saves the indices of them. The midpoint value for each data set is calculated as halfway between the min and max values. In order to find the location in time of each midpoint, the program uses its value to iterate through each data vector and find the index of each midpoint value. The program also ensures that the midpoint location is the same for each waveform, i.e. both on the rising edge or both on the falling edge.
Once the program has index values for the min, max, and midpoint for each dataset, it can calculate the lag in time between the two waveforms, which is the same as the difference in arrival times of the two pulse waveforms. The algorithm we wrote for finding the midpoint of each waveform, while most of the time correct, sometimes detected the wrong midpoint value and/or index. We define a "correct" midpoint as it being between the min and max values in time, for both pulse datasets. If the value/index is incorrect, we discard it and do not use it in our blood pressure calculation. If both are determined to be correct, the lag time in seconds is calculated and saved to a vector of lag times. Lag time is used in determining blood pressure, but rather than using each lag time to calculate a blood pressure value, we decided to collect 50 samples of lag times, which are averaged. It is this average lag time that is used to calculate blood pressure. This is one aspect of calibration we realized was necessary, as using a single lag time to calculate blood pressure resulted in an erroneous value. Therefore, once 50 correct lag times have been recorded, the waveform velocity can be calculated by dividing the distance between the two measurement points on the arm by the average lag time. Blood pressure is calculated by taking this velocity and multiplying it by a constant C that was determined experimentally for that specific user. The equation used is as follows: BP = C*(arm distance / avg. lag). This value is then displayed on the TFT (before the 50 lag times have been collected, the message informing the user data is being collected is instead displayed). Also in this thread, the min, max, and midpoint values are marked on the TFT pulse plots using red circles for min and max and green circles for midpoints. This allowed us to effectively debug our program as well as make the display more user-friendly and informative. Once this thread has completed, the program returns to from where it was spawned (the ADC protothread) to reset and begin collecting the samples for each pulse waveform through the ADC.
Things that we tried which did not work
- Concentrated vs. Resting State
Our original project idea was to use NIRS to create a non-invasive brain-computer interface that uses changes in brain activity to control a set of outputs, such as LEDs. The theory behind this was that when a certain area of the brain becomes activated, the volume of oxygenated hemoglobin in that area changes. We picked two opposing states of mental activity to act as binary outputs: "relaxed" (corresponding to normal blood flow in the prefrontal cortex) and "concentrating" (corresponding to increased blood flow in the prefrontal cortex). We were successfully able to implement the hardware needed in order to read in a pulse signal, however when testing to see whether or not the idea of being able to differentiate between two clear brain states using NIRS was even feasible, we ended up deciding that that we would not be able to complete this end goal within the scope of this project. At times there seemed to be a definite amplitude change in the signal when switching states, but ultimately we decided that because of our limited time in completing our final project, we would need to be more confident in our circuit to reliably output clear binary states. We therefore pivoted from our original project idea of creating a non-invasive brain-computer interface (BCI) using near-infrared spectroscopy (NIRS), to a blood pressure sensor that still uses the near-infrared spectroscopy hardware that we had worked on to date.
Finding the time maximum derivative of a pulse signal
After switching our project to a blood pressure sensor and reading research papers and resources that Bruce provided us with, we determined that we would be able to find blood pressure estimations by recording pulse wave velocity of blood traveling from the upper arm down to one's index finger. To do this, we planned on time marking the positions of maximum first derivative of a pulse at both locations mentioned, and knowing the distance between, we could calculate velocity. After working on creating a protothread that would sample a pulse and subsequently calculate and plot its first order derivative, we came up with the following results:
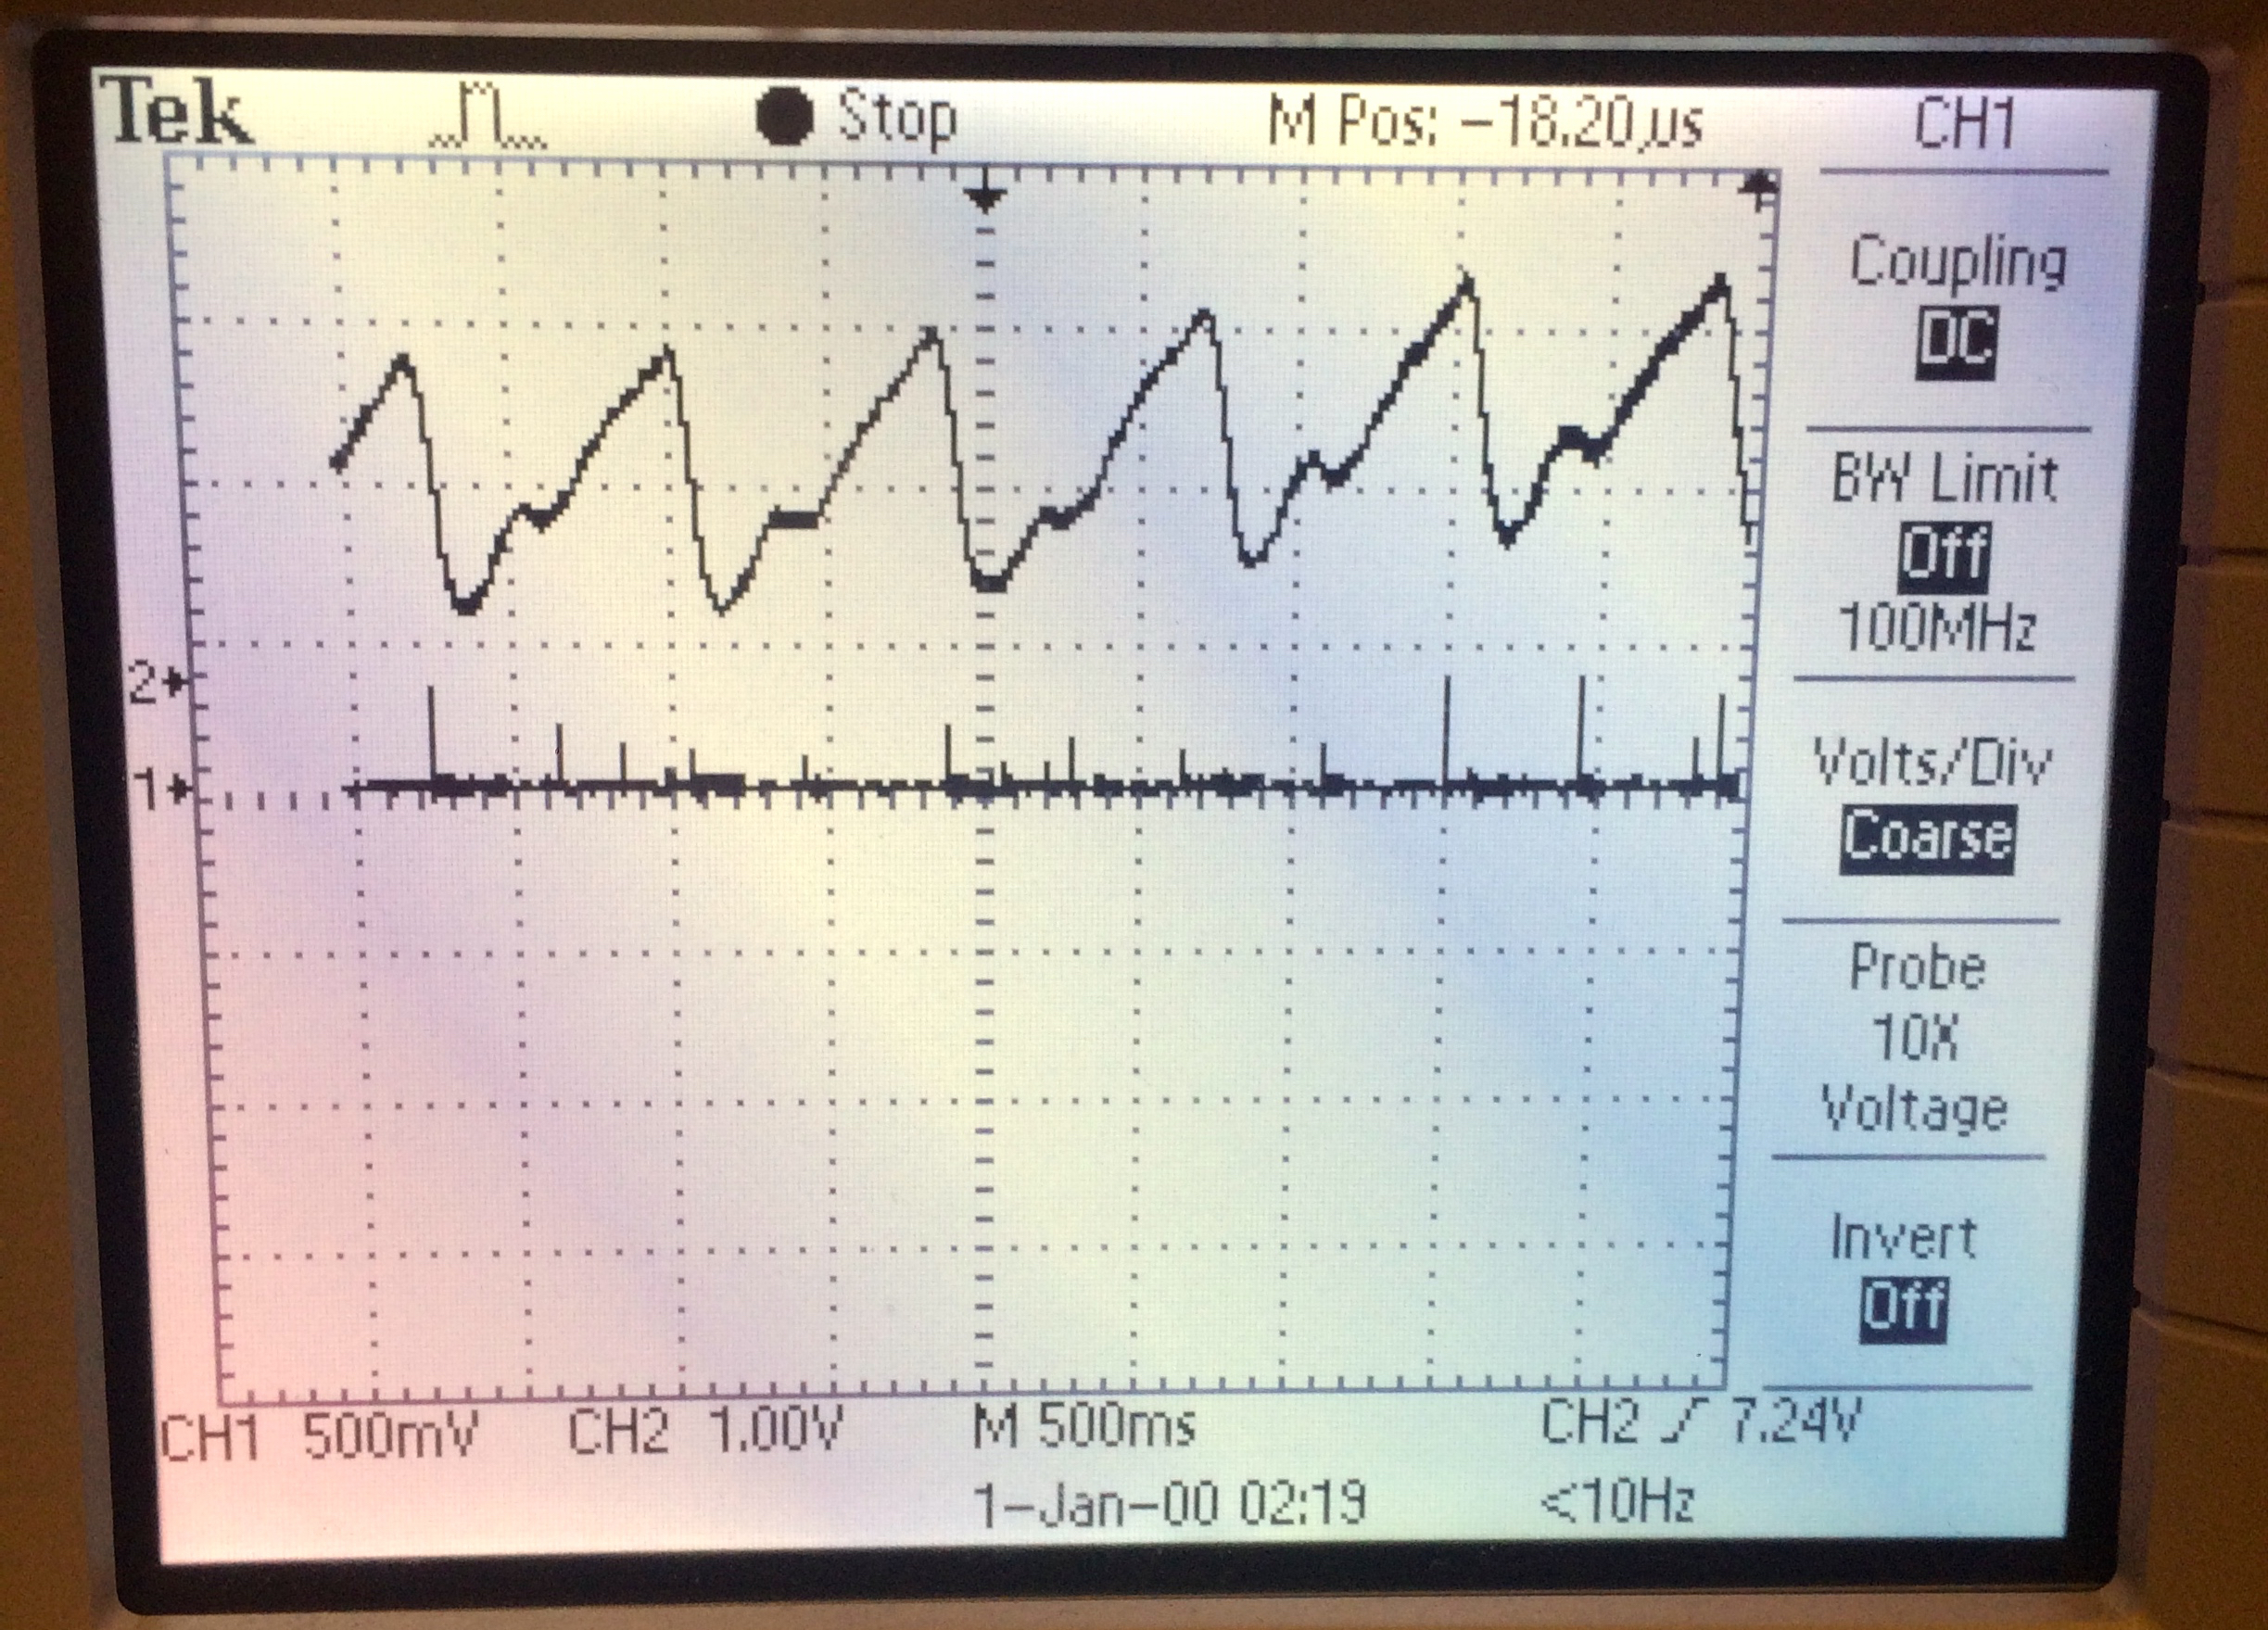
Figure 1. Noisy Pulse Derivative
The top channel of the oscilloscope shows a pulse being read in, and the bottom channel shows its respective first derivative function. We played with several different sampling frequencies in our software as well as trying to adjust the gain of the circuit in our hardware, but in the end it remained too difficult to isolate peaks that actually signified a maximum first derivative due to too much noise. If we took too many samples, the derivative function would have an excessive number of peaks that we could not reliably filter from the data of interest to us. Conversely, if we took too few samples, we would sometimes miss times where maximum peaks should have occurred in the derivative function entirely. In a similar way, trying to optimize the gain was difficult in how implementing a large gain would amplify all of the noise, but too small of a gain would make it hard to determine peak values.
Back to top
Results
Final Hardware Set-Up:
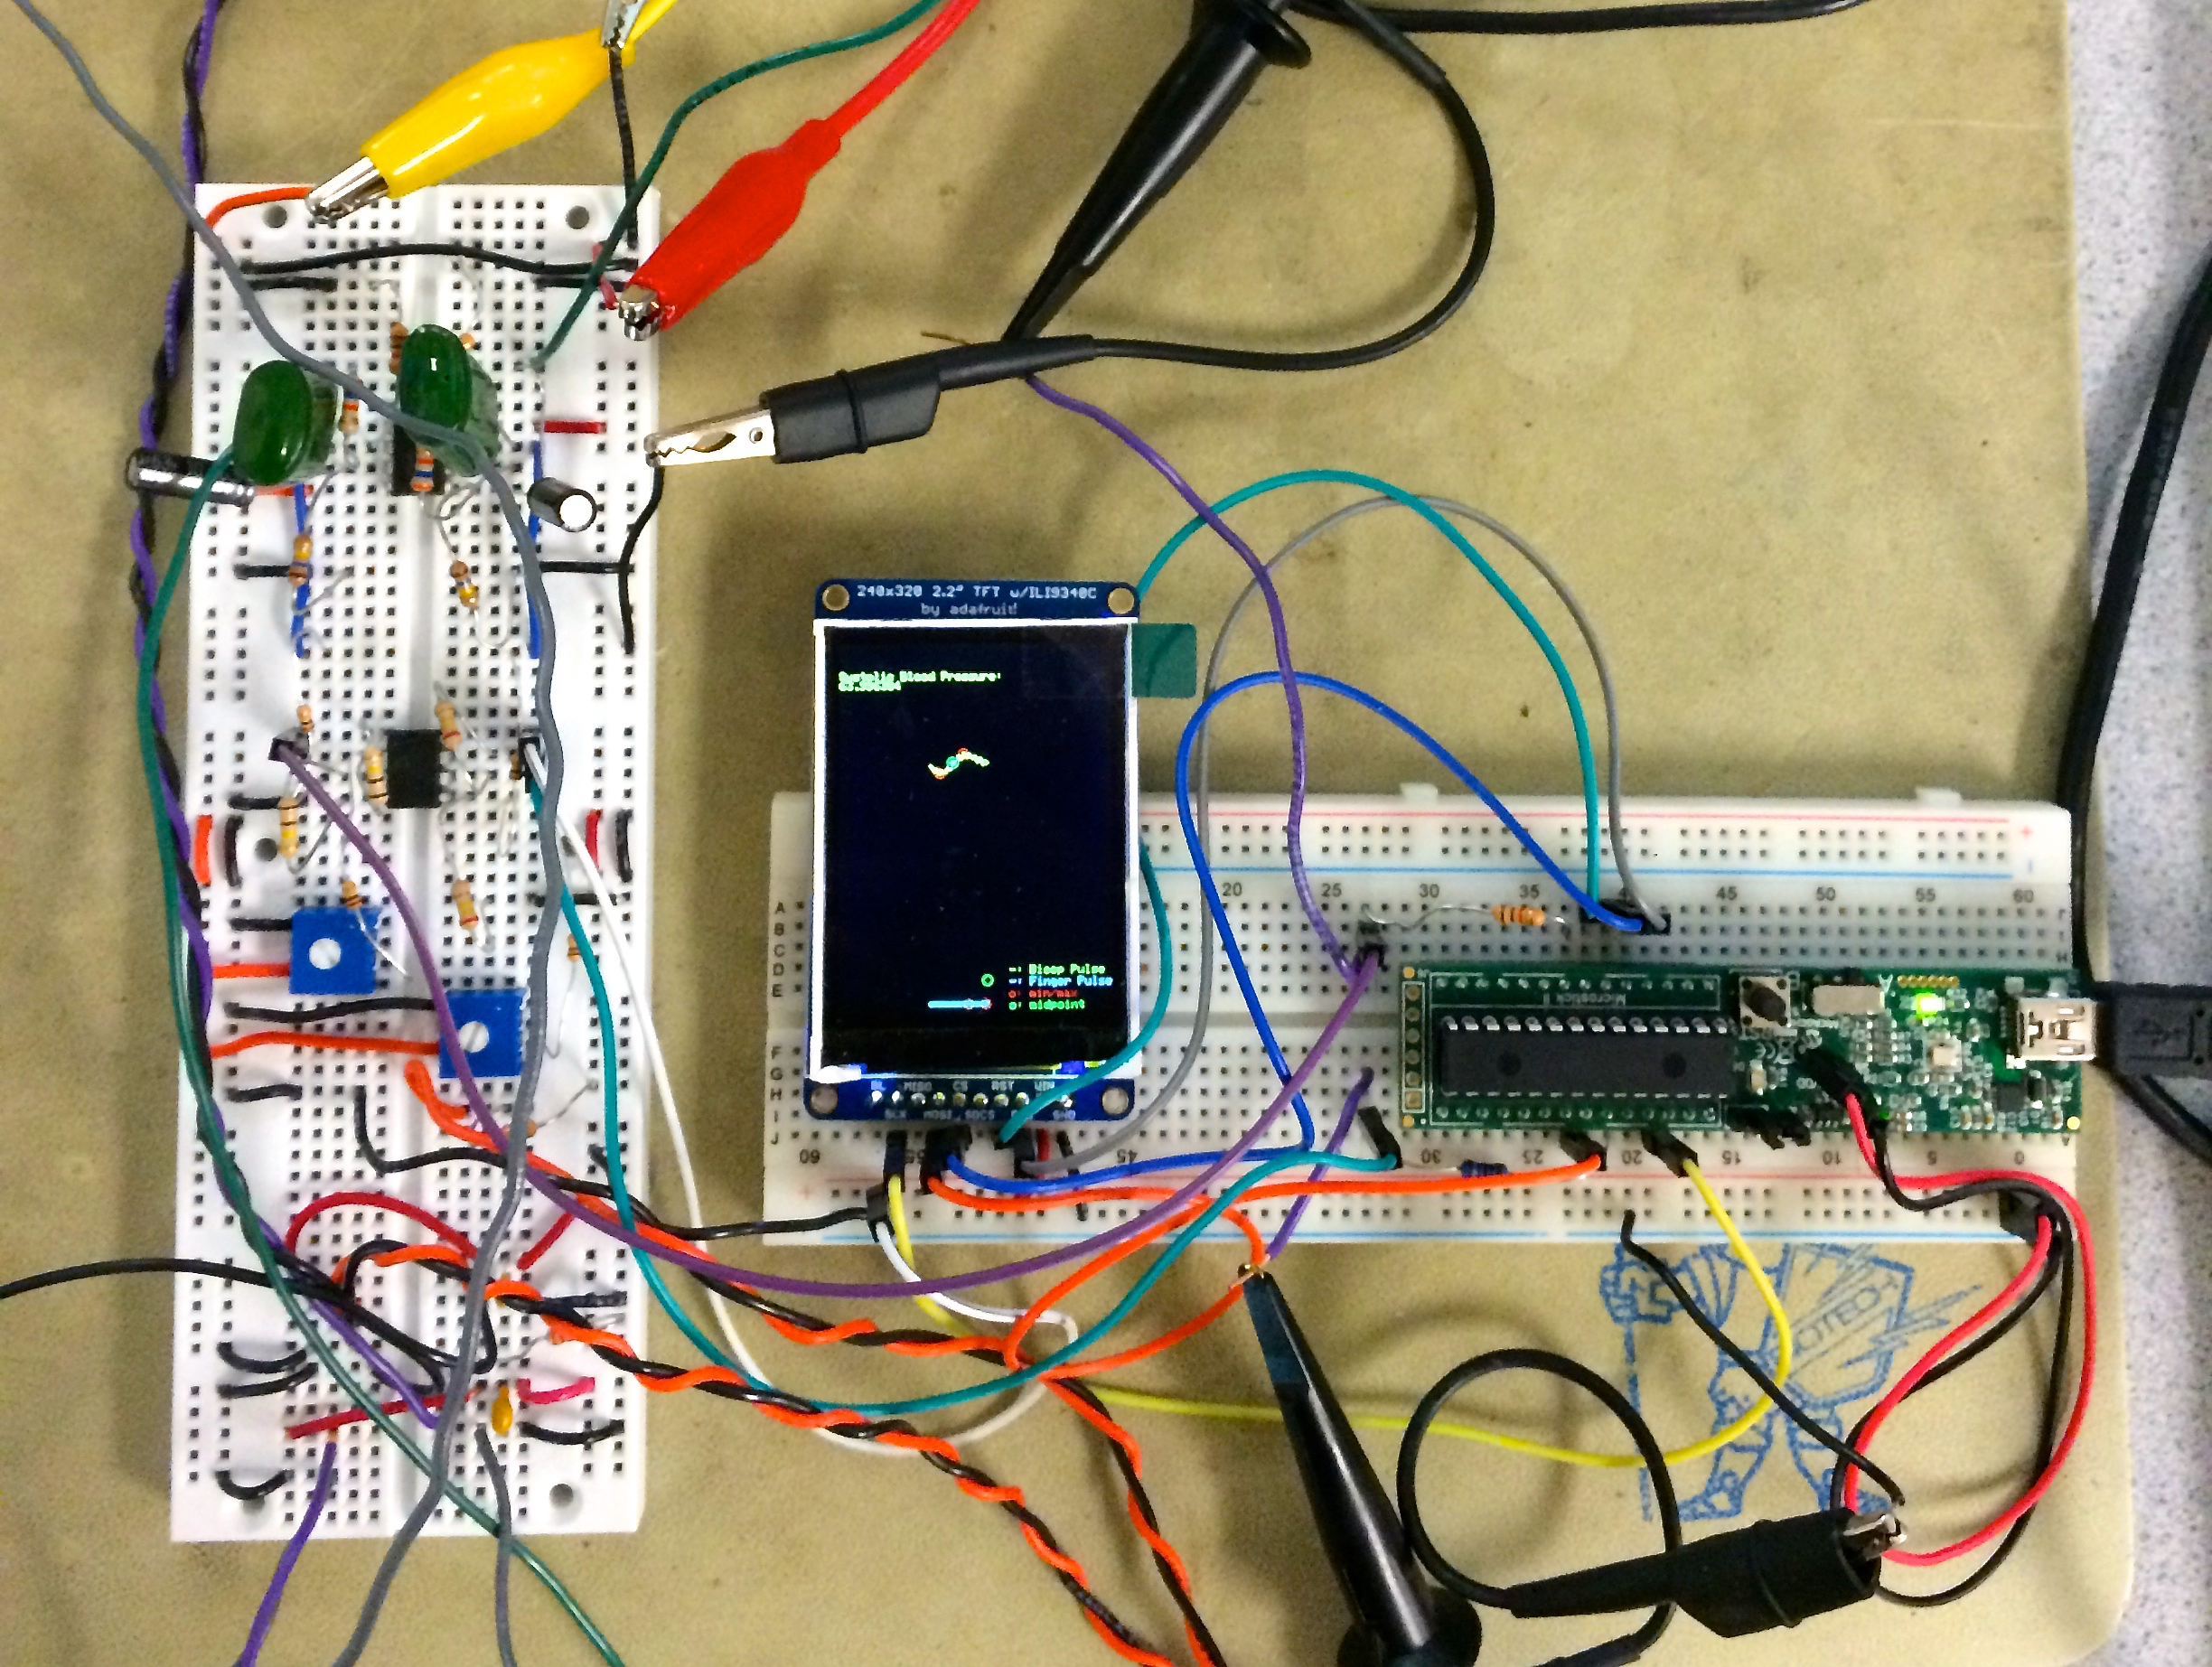
Figure 2. Final Circuit Used In Demo
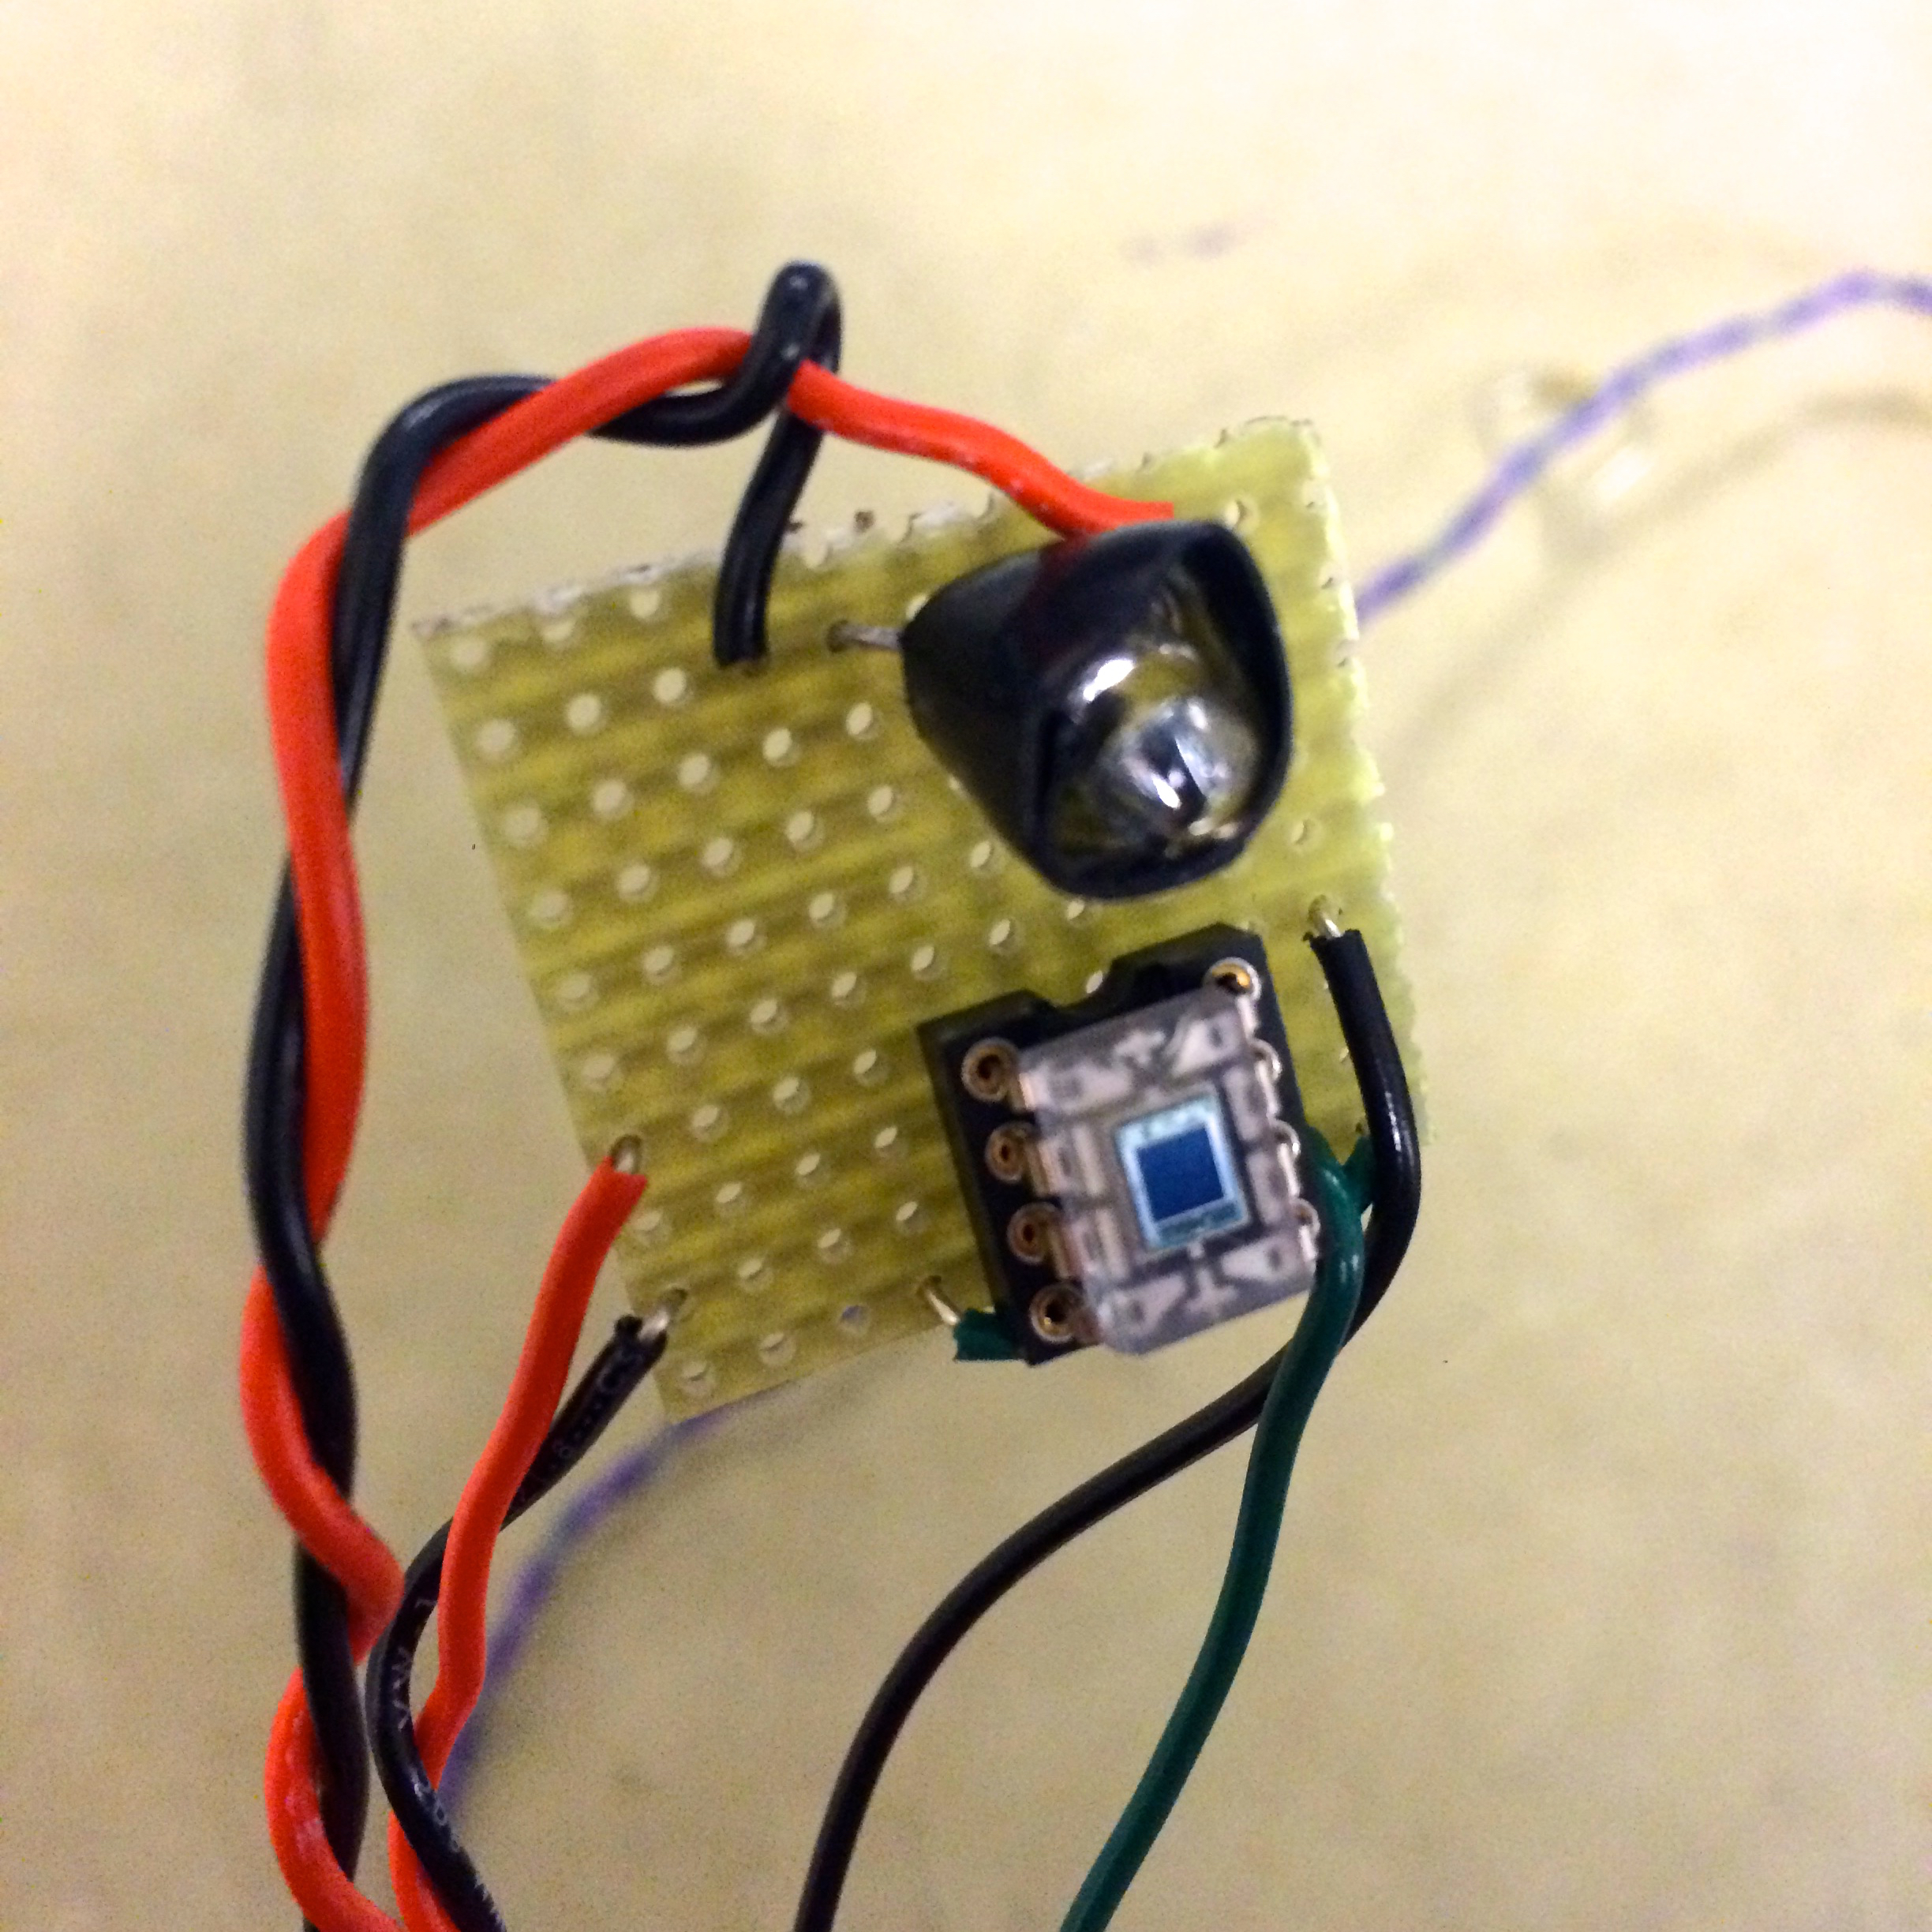
Figure 3. Arm Sensor
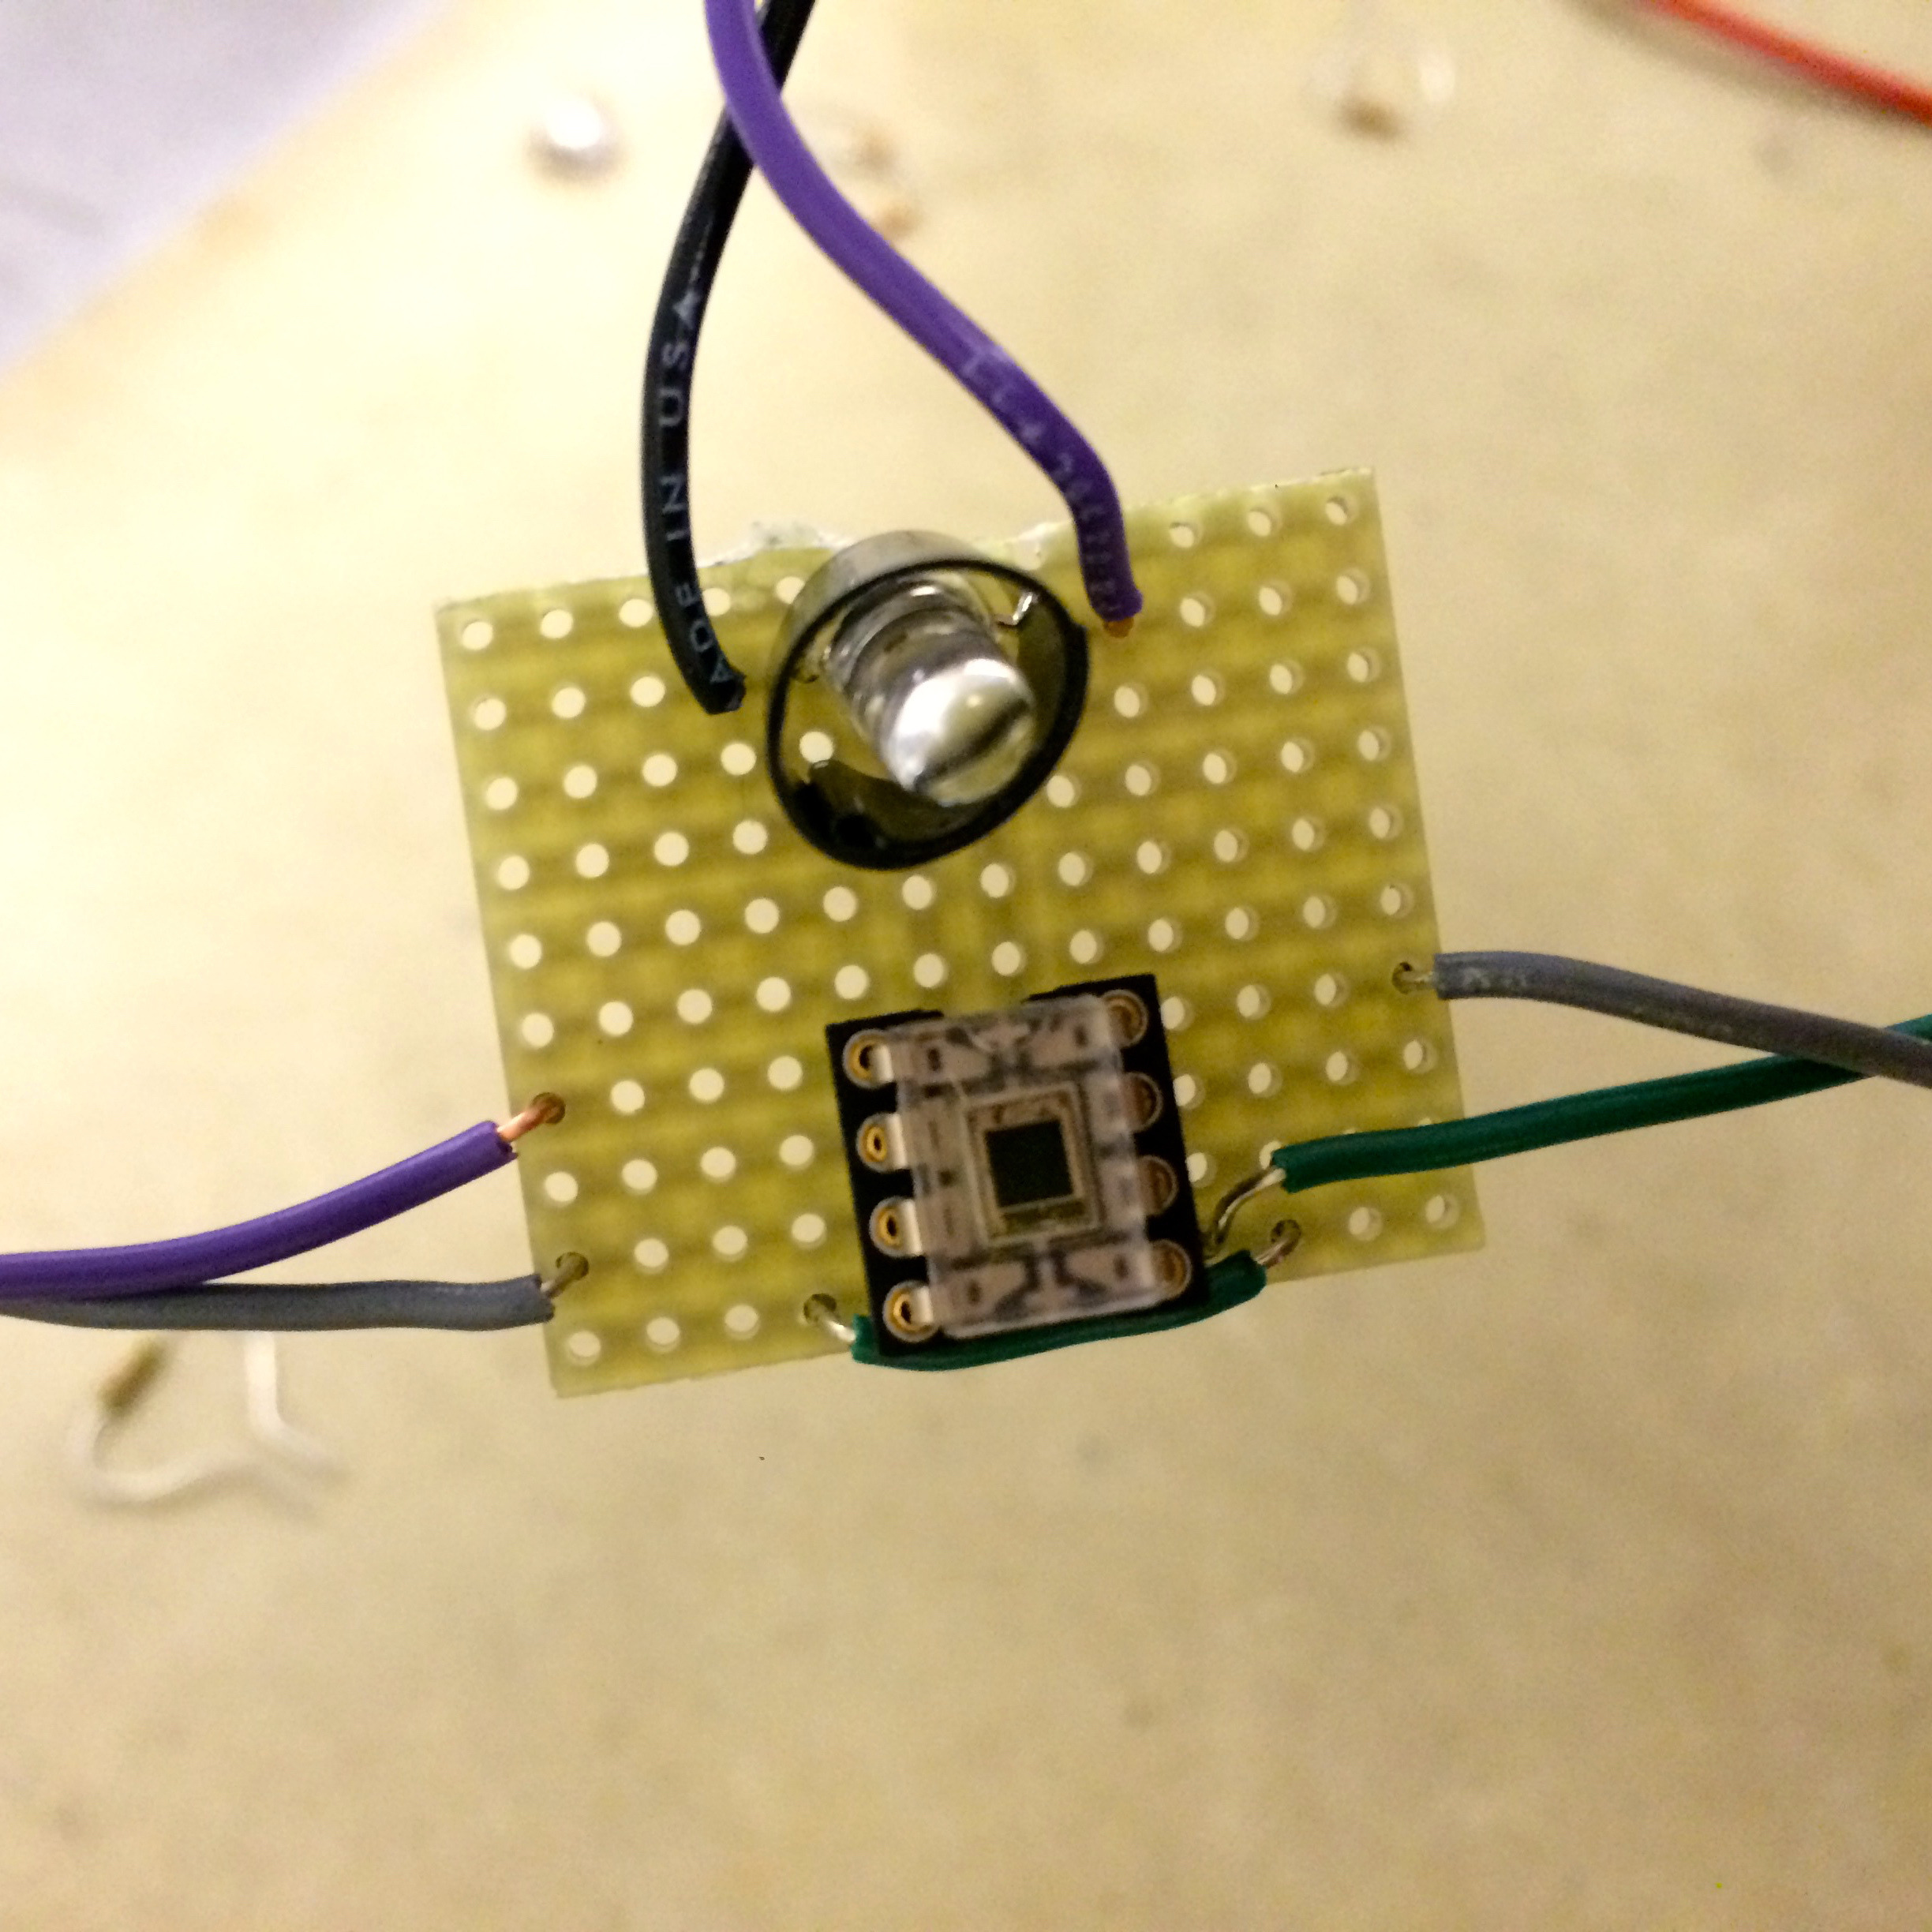
Figure 4. Finger Sensor
Oscilloscope Readings:
From the two sensors created for measuring pulse from the arm and index finger shown above in Figures 3 & 4, we were able to read out the two signals on the oscilloscope below. We found that the top signal representing the pulse at the upper arm stayed very consistent as long as it was placed on an optimal position at the bicep. This was probably due to the fact that this sensor was physically strapped on using a black headband, so movement of the user did not affect the sensor's output reading. On the other hand, the bottom signal would be harder to initially pick up and continually maintain while taking data. This was most likely because instead of securing the sensor to the position where the pulse would be taken, we simply placed the mini sensor set-up on the lab table and rested a finger on the LED until a pulse was read. In this way, if the user made any considerable movements, the pulse would be more variable than the upper arm sensor. Despite this, we were able to consistently get readings like the one pictured below in order to estimate blood pressure.
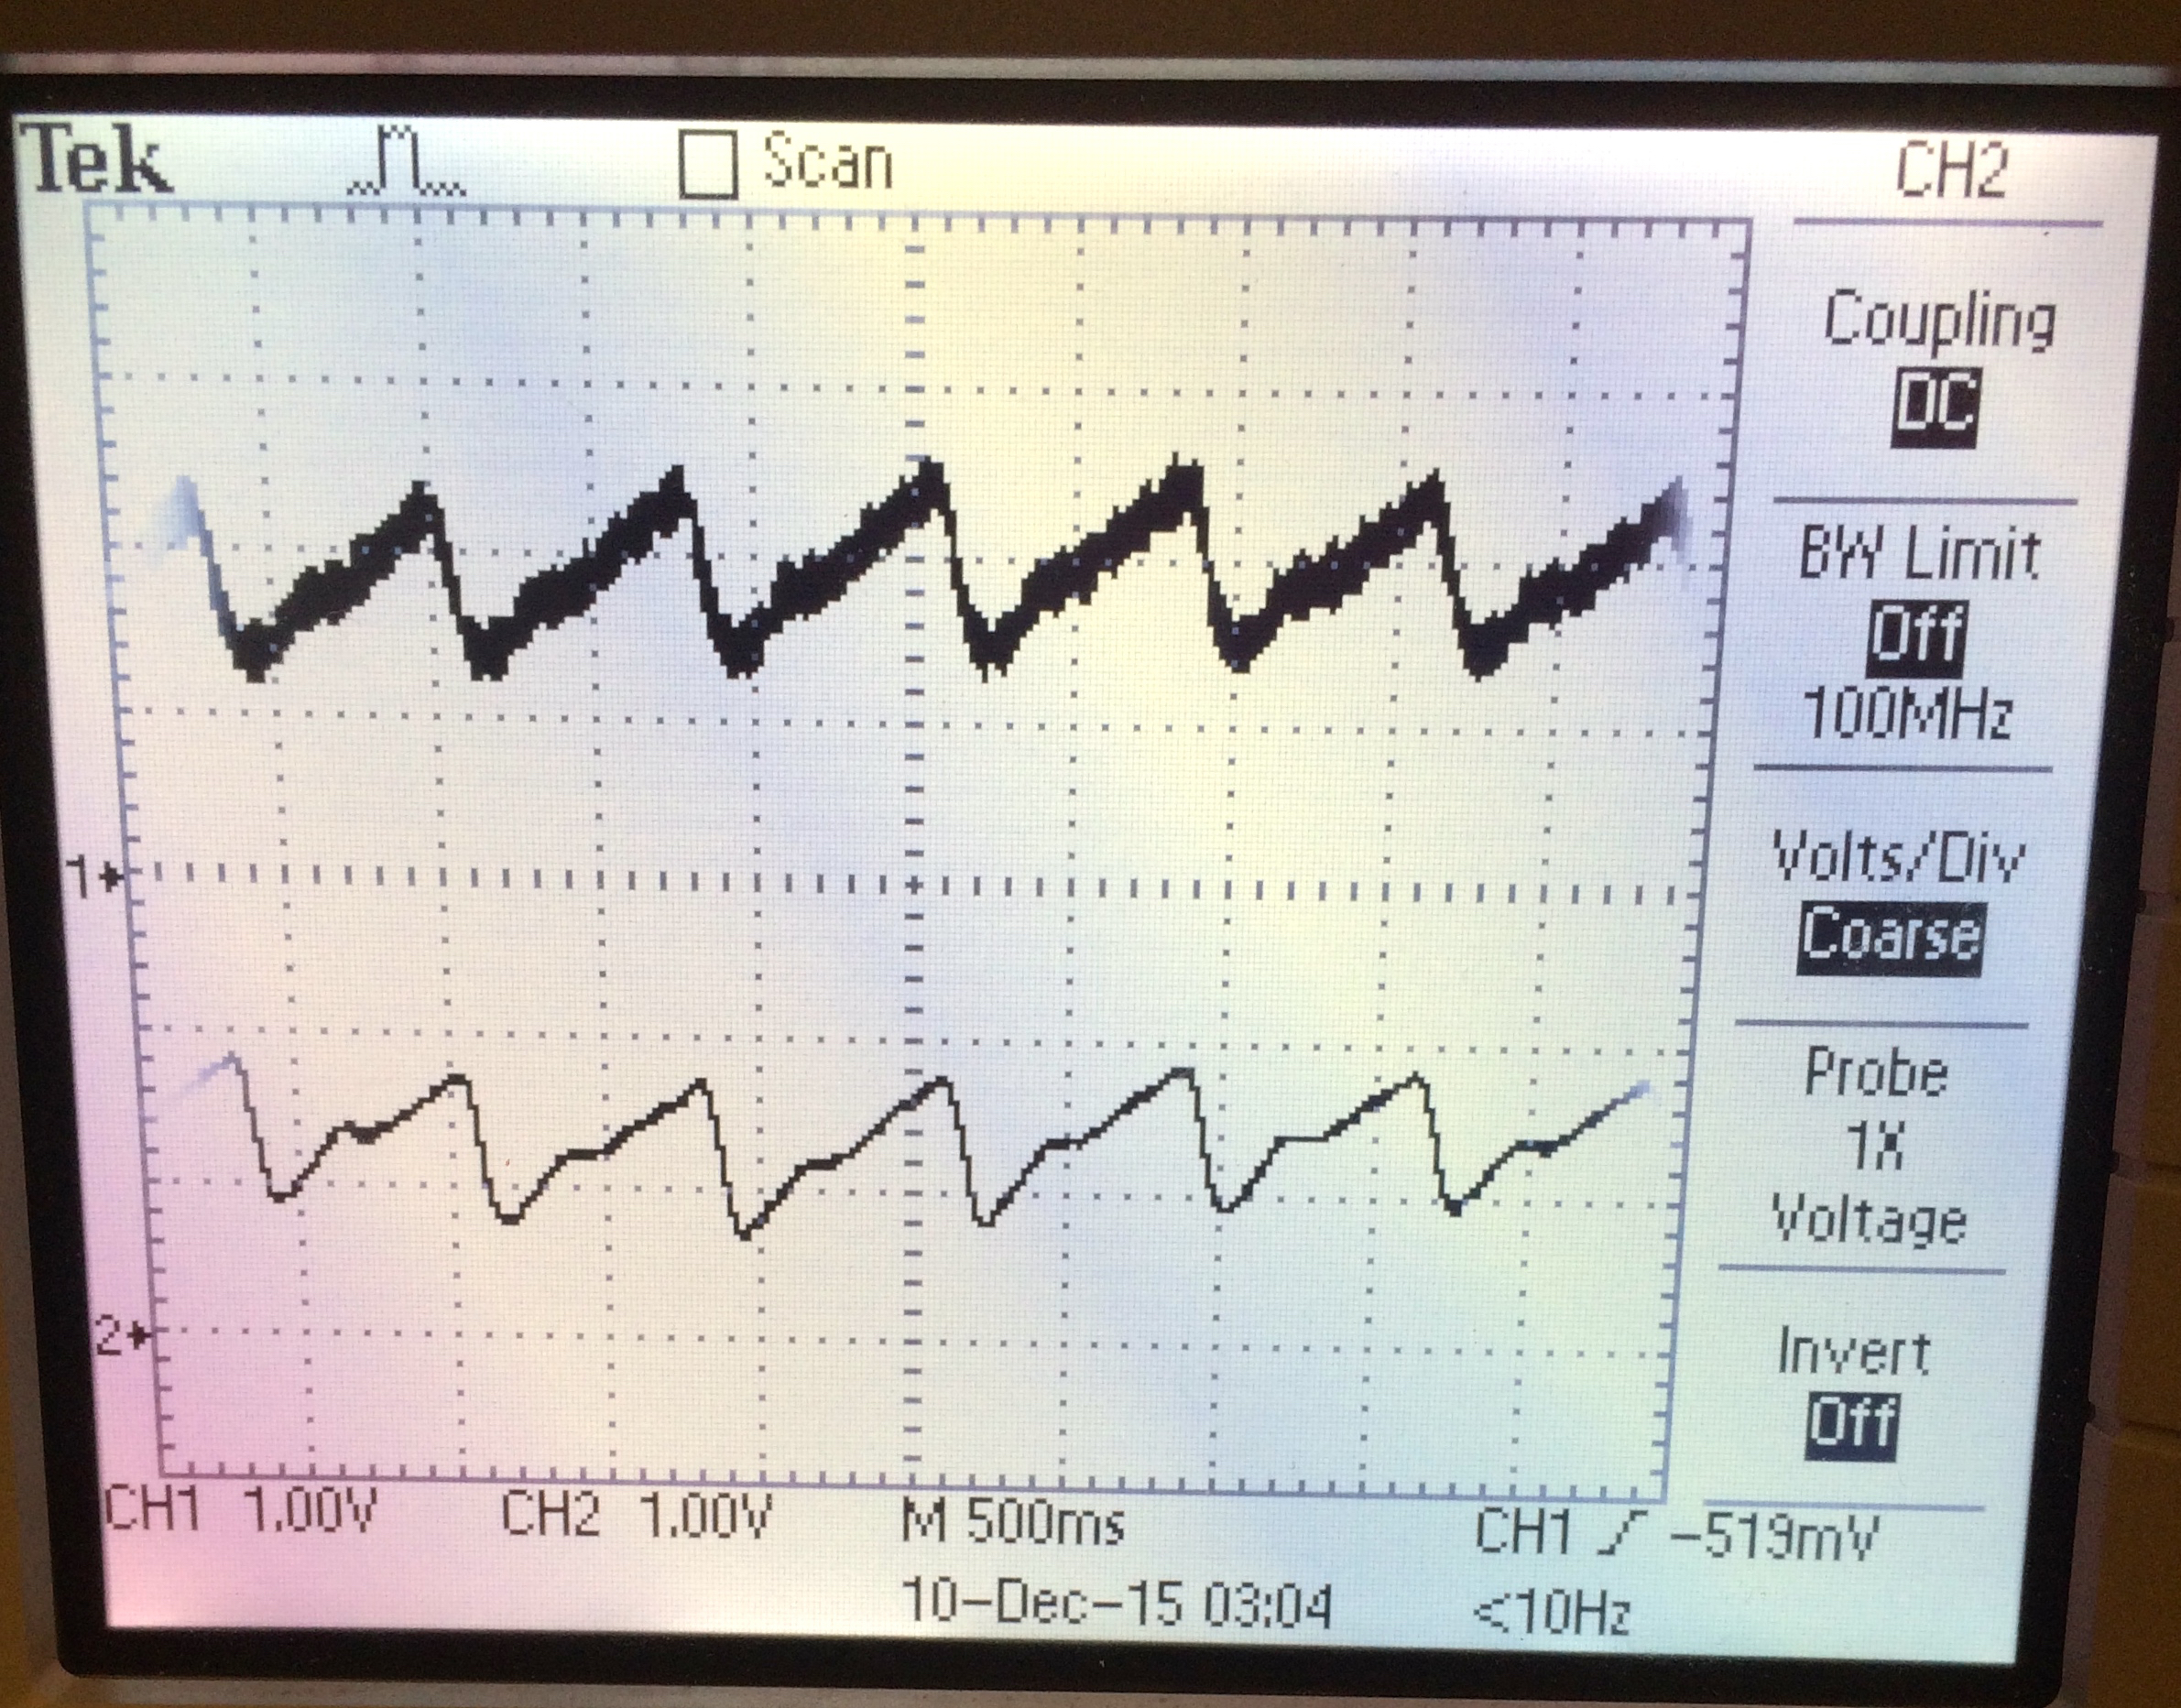
Figure 5. Oscilloscope Reading of Arm (Top) and Finger (Bottom) Pulse Signals
TFT Results:
In order to get a visualization of the data collection and respective analysis we were implementing with our hardware design and code, we made the TFT display what was happening with each pulse at every sample. The top yellow curve was the pulse measured at the upper arm, and the blue curve was the pulse measured at the index finger. We chose our sampling frequency and number of samples to take data over approximately one pulse period. The red circles indicate what values were calculated to be the maximum and minimum points, and the green circles indicate the respective midpoints that would be used in calculating the time difference in our velocity calculation. During the duration of collecting data, the TFT would display the phrase "Collecting data please stand by" at the top of the screen and when the blood pressure estimate was complete it would display the calculated Systolic Blood Pressure as seen below.
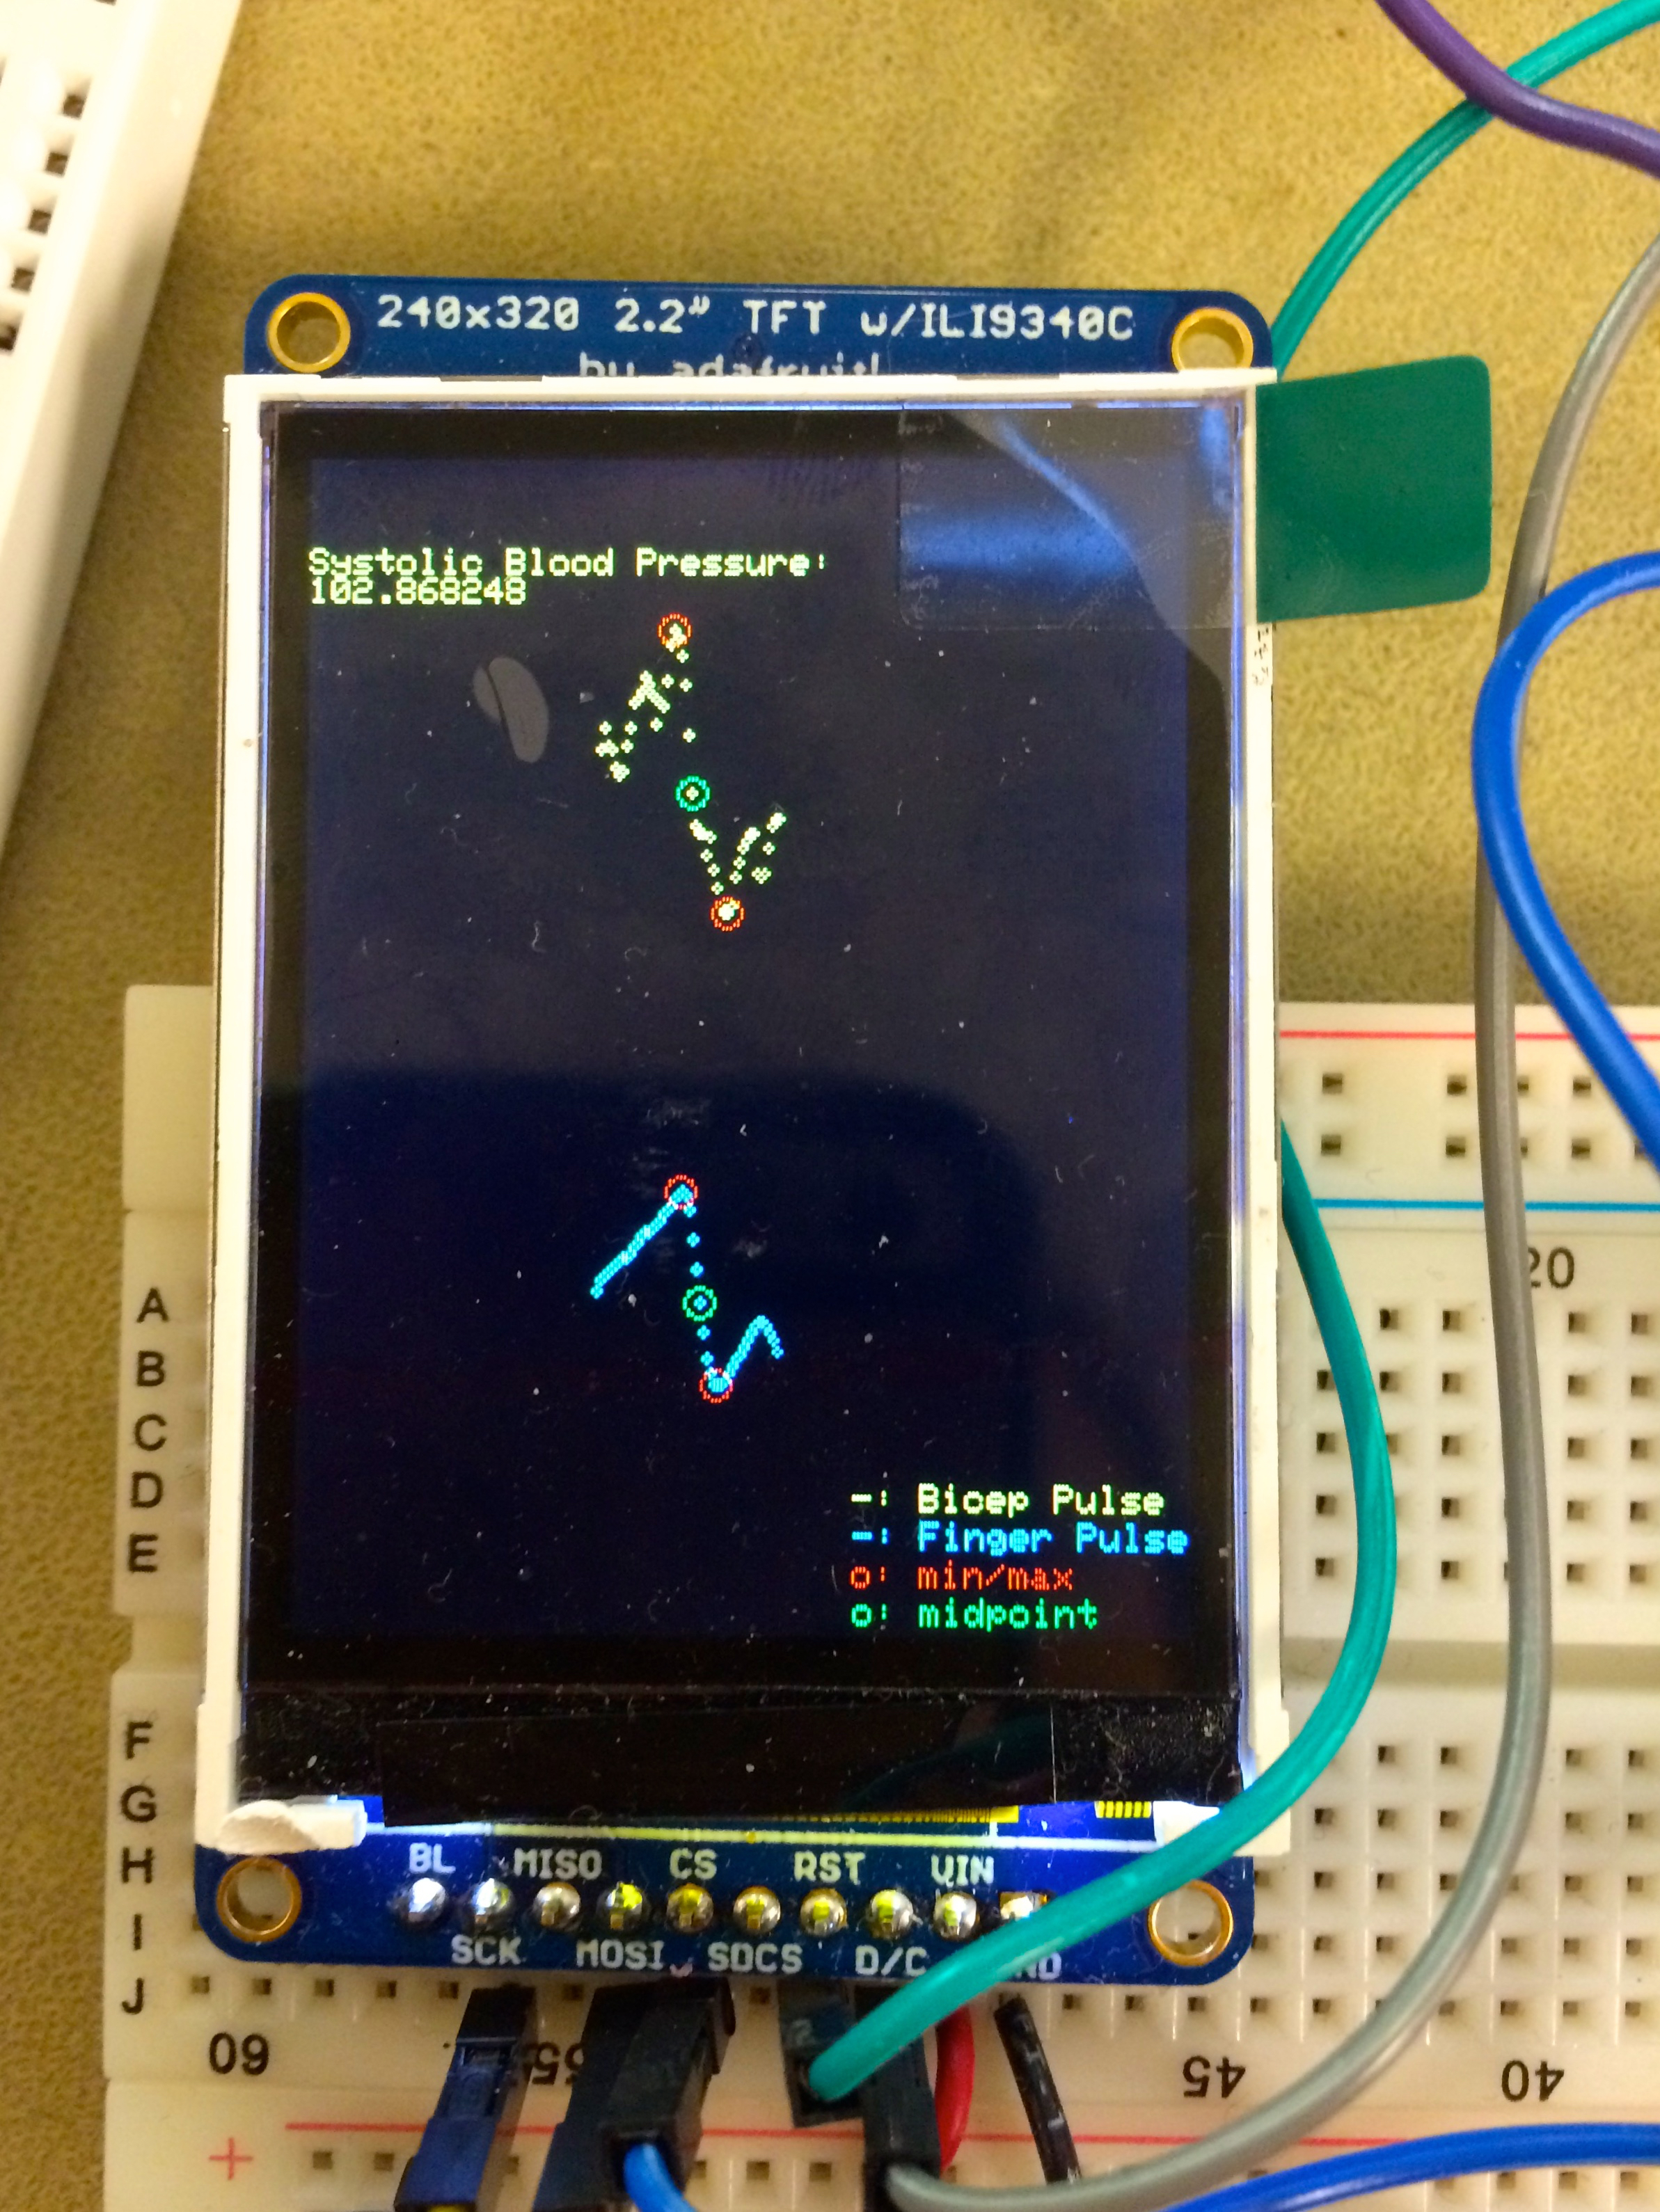
Figure 6. TFT Display of Systolic Blood Pressure Reading
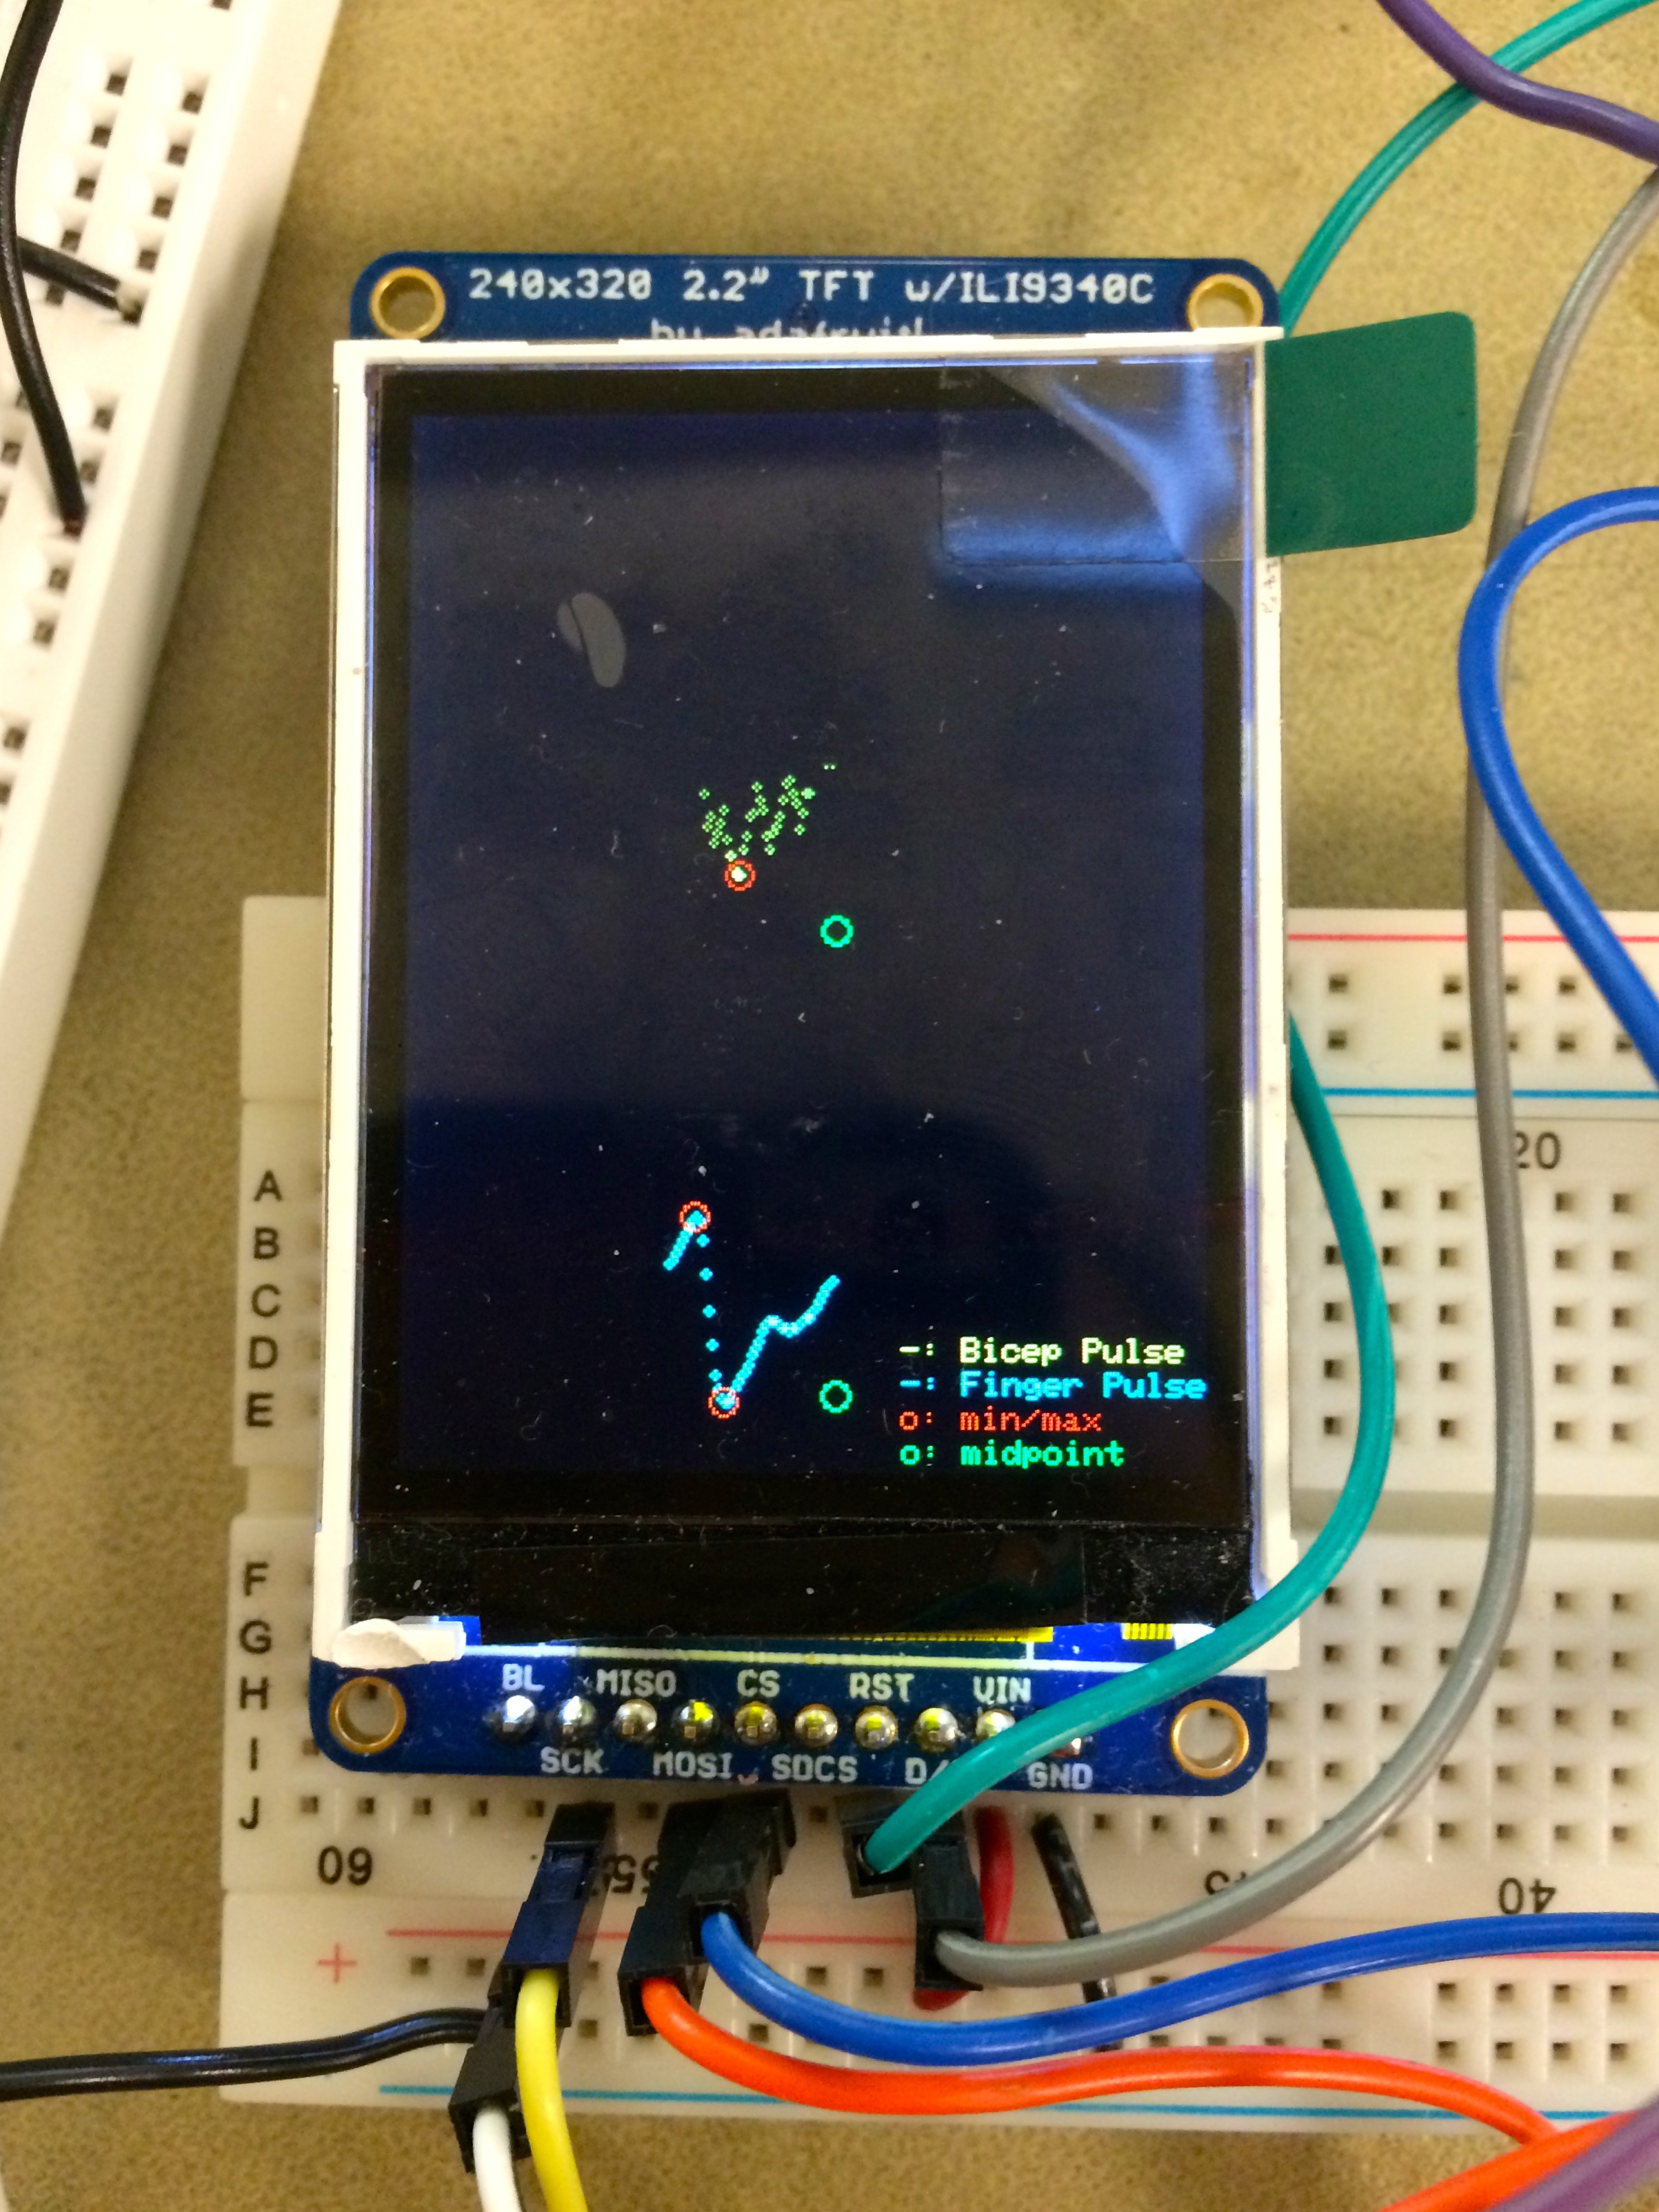
Figure 7. TFT Display example of when calculated midpoint value is discarded
Speed of Execution
Based on our decision to take 50 samples at a sampling frequency of 66.67 Hz, the runtime of estimating a user's frequency was approximately two minutes accounting for when the program had to discard invalid midpoints. We could have taken less data at a faster sampling frequency, however we found that this often decreased the accuracy of our blood pressure measurement.
Accuracy
Our blood pressure estimations were highly accurate at times, but showed variation depending on the nature of how the data was collected. For example, when measuring Michelle's blood pressure while in a resting state with a real blood pressure cuff, her systolic blood pressure was 102. Values within a tolerance of +/-1 of her actual systolic blood pressure, 102, were consistently reached with our own design. Despite this, we would occasionally also get a few values ranging from a minimum of ~70 to a maximum of ~130.
Interference with other people's designs
Our project did not have a factor of interference coming from other groups in lab. The way we collected data was independent of background noise since there were no wireless components.
Usability by Other People
Due to the time constraints of working on this project, we were only able to create an accurate blood pressure sensor for the person with which the project was continuously tested on (Michelle). Based on her pulse while at rest, we would calibrate the gains at each part of the circuit to best account for collecting data for her blood pressure. Depending on how strong a user's pulse is and the speed at which it travels throughout the body, our device would probably need to be adjusted to account for these variances in data.
Back to top
Conclusion
In conclusion, our project did not meet our original expectations of creating a brain-computer interface that could detect binary states of brain activity, however our final results successfully met our expectations of creating a blood pressure sensor. Our design is accurate within a degree, with some error due to incomplete calibration of our device. Our blood pressure monitor varies from person to person as well as within one individual, due to various physiologic attributes (arm length, body position, etc.). If we were to continue this project, we would make our design more robust and overall easily calibrated for each user.
Our design was noninvasive and did not have any aspect that changed any human physiological attributes (only took measurements from them), and thus was easily conformed to standards. The only thing we had to take into consideration was the power of the IR LED. The maximum power allowed and considered safe is the same amount of IR light emitted from normal sunlight, which we were well below.
Our blood pressure monitor was largely an original design, with some aspects of it being adapted from others' past work. Our use of near-infrared spectroscopy to detect pulse has been implemented in other research, from which we drew ideas of how the setup of IR light and a photodetector could be used in order to make measurements on the skin. Our program was adapted from Prothreads_1_2, the code used for Cornell University's ECE 4760 Lab 3: Particle Beam Video Game in order to correctly configure the 10-bit analog-to-digital converter on the PIC32, but most of the code content itself was written by us. Our filtering stage in hardware was adapted from Cornell University's ECE 1810 Laboratory 7: Pulse Meter. All of these references canl be found at the end of this page.
Ethical considerations
Throughout the duration of the time we spent working on our final project, we made sure to follow the IEEE Code of Ethics at all times so that our decisions and actions aligned with the highest ethical and professional conduct. Specifically addressing several of these points:
- 1. To accept responsibility in making decisions consistent with the safety, health, and welfare of the public, and to disclose promptly factors that might endanger the public or the environment
Since our project incorporated the use of hardware wearables meant to be placed at the upper arm and index finger, we ensured that there were no loose wires or exposed circuit elements sticking out that could compromise the safety of a user. To use our project, we require that a user sits down while taking their blood pressure data, as components of our circuitry must still be hooked up to a power source in order to run. During the design stage, we also made sure that all circuit components remained at a level under their power limits by scaling output signals to meet the limits of the inputs that they were fed into.
- 3. To be honest and realistic in stating claims or estimates based on available data
We made sure not to overstate any of our findings and only report data we actually collected in lab. We were honest in describing all of our design decisions, and realistic in acknowledging that it was sometimes difficult to get a reliable blood pressure reading based on signal noise and the robustness of our maximum first derivative detection method.
- 5. To improve the understanding of technology; its appropriate application, and potential consequences
Our original goal in working with near infrared spectroscopy was to better understand the human body and how we can use technology to further that knowledge and create relevant applications. Designing a blood pressure sensor using NIRS allows us to explore a non-invasive way of taking systolic blood pressure.
- 6. To maintain and improve our technical competence and to undertake technological tasks for others only if qualified by training or experience, or after full disclosure of pertinent limitations
Through undertaking this project, we learned a breadth of knowledge concerning near infrared spectroscopy and biological concepts that we were not deeply familiar with prior. The entire concept of finding blood pressure estimations based on the pulse transit time between two parts of the body was new to us, and served as the basis of our project which we were able to dive deeply into. In addition, our experience with designing filters, analog-to-digital converters, and
- 7. To seek, accept, and offer honest criticism of technical work, to acknowledge and correct errors, and to credit properly the contributions of others
We used past research and projects to design our blood pressure monitor, drawing on their ideas as well as creating our own. We reference all projects and papers used in our References section.
Legal considerations
We do not believe that our work infringes upon any existing patent available to the public. There has already been considerable work done finding ways to relate pulse transit time and pulse wave velocity with blood pressure, but not implemented in the way that we have done for our final project. We also do not intend in pursuing any type of patent.
Back to top
Appendices
Commented program listing
Below is a zipped folder of all the code used in our program. As stated previously, our code was adapted from Protothreads_1_2 from ECE 4760 Lab 3. We used it as a template, and therefore used all of the same header files, libraries, and configuration files. These are all included in the zipped folder. The code that we wrote is in the TFT_ADC_read.c file, while all other files were left unchanged. For convenience, we have also included a link below that leads to this file only. (Please note that we did not change any of the file names due to the fact that doing so originally created errors preventing our program from running.)
Protothreads_1_2.zip
main program file (TFT_ADC_read.c)
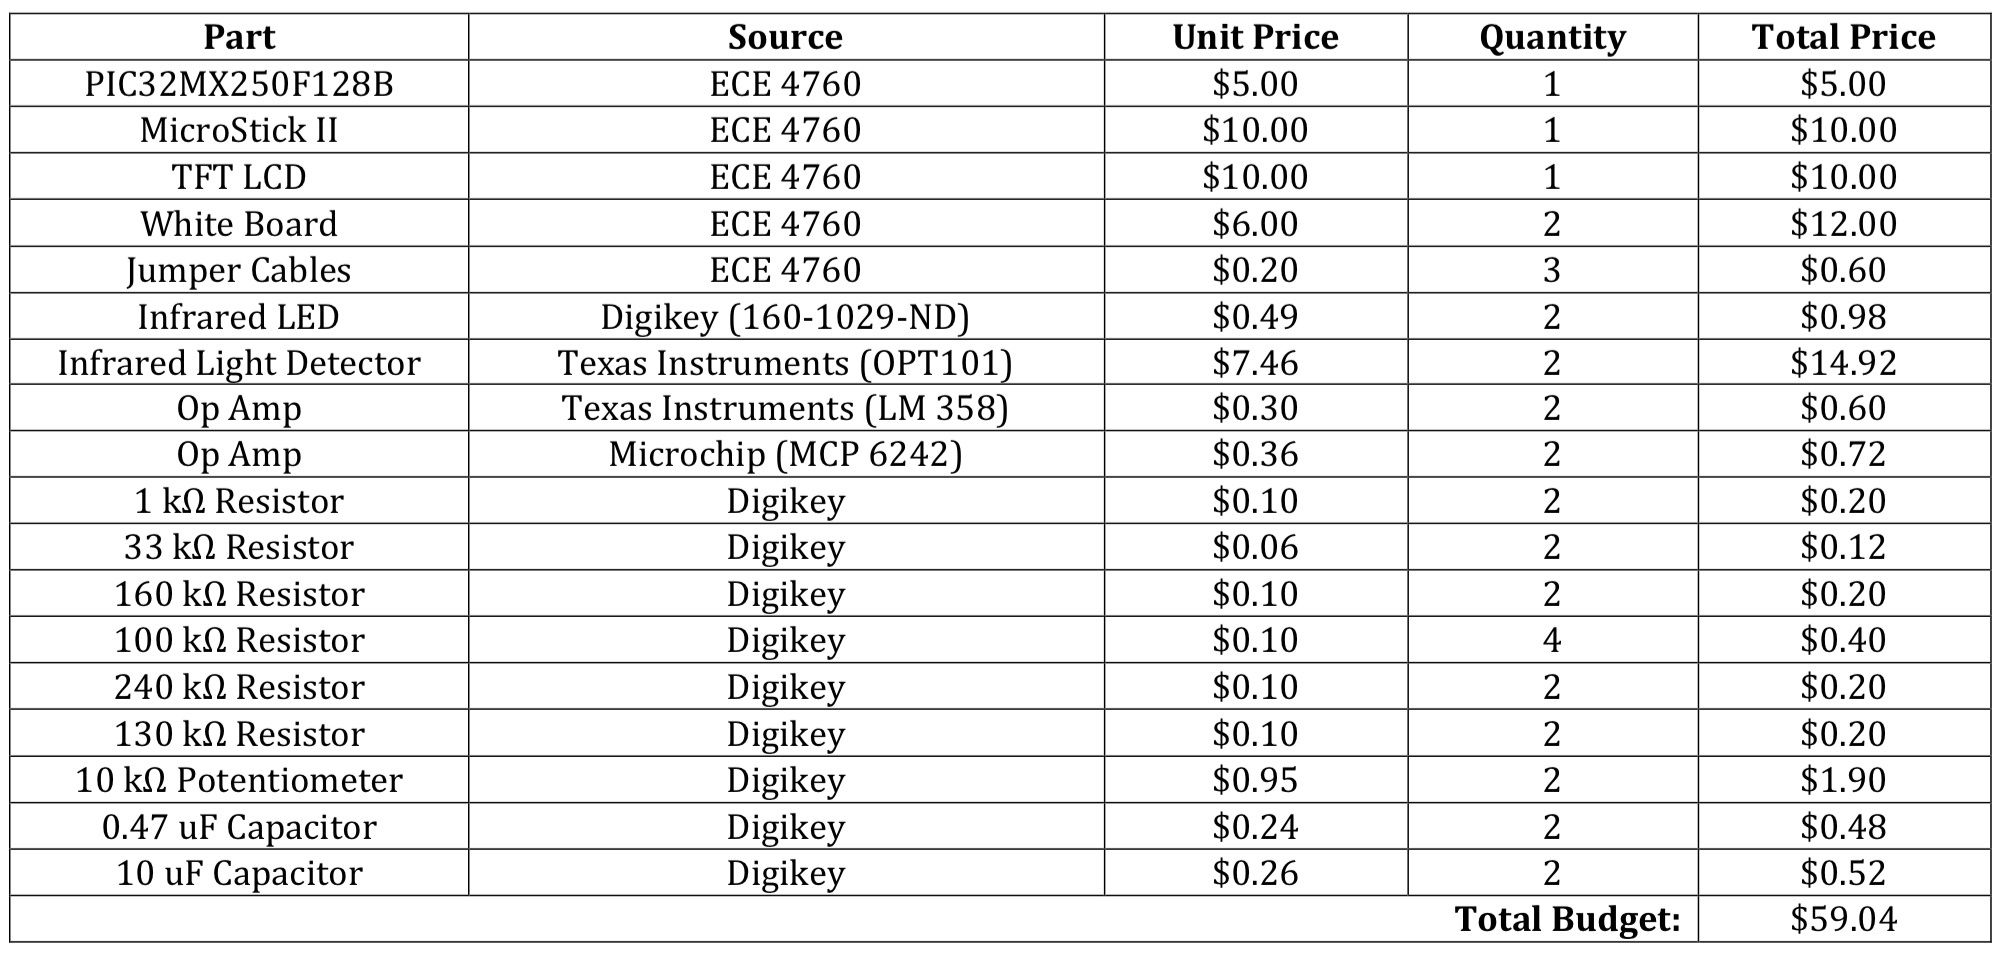
Cost/Parts List/Vendors/etc.
Specific Tasks by Team Member
The majority of all tasks were handled as a pair:
- Writing the code: both
- Testing the code: both
- Designing the first op-amp circuit: Hannah
- Designing the second op-amp circuit: both
- Testing the hardware: both
- Soldering the sensors: Michelle
- Integration and final testing: both
- Creating the webpage: both
References
Below are links to external reference documents and websites we used throughout the duration of our project:
- Datasheets
- Vendor Sites
- Code & Design References
- Background Information
Back to top