Music Visualizer
By Cynthia Zelga (cnz5), Asena Ulug (ayu2), Jocelyn Gilbert (jyg9)
Introduction
Our ECE 4760 final project is a music visualizer which displays the real time Fast Fourier Transform (FFT) of music on an RGB LED matrix. Our motivation for this project was to create a fun and aesthetically-pleasing way of displaying music. Additionally, our music visualizer provides an alternate avenue for experiencing music for those that are deaf or hard of hearing.
Demo
Watch a demonstration of our finished project below!
High-Level Design
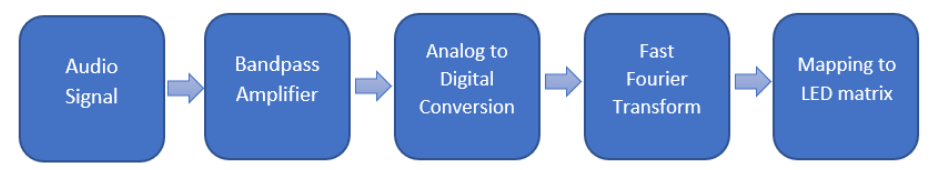
We take music as input through a microphone circuit which amplifies the audio signal, and filters out noise. We then perform the FFT algorithm on the audio input, and map the results of the transform onto the LED matrix.
Bandpass Amplifier
Instead of directly feeding our audio signal into the analog to digital converter on the PIC32, we first amplify the signal and put it through a bandpass filter to reduce noise. The gain of our amplifier is 30. Our lower cutoff frequency is 100 Hz, and our higher cutoff frequency is 4000 Hz.
Analog-to-Digital Conversion
The continuous audio signal is converted to a discrete signal using the analog to digital converter (ADC) of the PIC32 microcontroller. The resulting discrete signal is 10 bits. The sampling rate is 8 kHz. In order to avoid aliasing, we must sample at a rate that is double the highest frequency of our signal (Nyquist-Shannon sampling theorem). The majority of energy in music is less than 4 kHz, which is why we chose 2*(4 kHz) = 8kHz as our sampling rate.
Fast Fourier Transform (FFT)
Fourier transforms convert signals from the time domain into the frequency domain. The Fast Fourier Transform is an algorithm that rapidly computes the Discrete Fourier Transform (DFT) by decomposing the DFT matrix into a product of sparse factors. The time complexity of the FFT is O(n*log(n)) where n is the the number of samples. We decided to perform a 64-point FFT because this transform resulted in 32 bins, which easily mapped to our 32-column LED matrix.
Mapping to the RGB LED Matrix
Our LED Matrix is a 16X32 matrix. Each column corresponded to a different bin as calculated by the FFT. The leftmost bin corresponded to the lowest frequency, and the rightmost bin corresponded to the highest frequency. In each bin, a line was drawn with a height corresponding to the amplitude of the frequency represented by the bin. For visual effect, we also colored the line based on the height from zero to 15. We created custom colors by experimenting with varied RGB values and arranged them in rainbow order to make a smooth visual change in height while also making the output very colorful. We included the typical rainbow colors - red, orange, yellow, green, blue, and purple - and additionally included pink, white, and various shades of green, blue, and pink to have a selection of 16 colors. To make the output more pleasing to watch, we also added a filter that caused the amplitude at bins to slowly decrease as the frequencies change rather than just disappearing. If the next amplitude of frequency in the specific bin was less than the previous one, then the line height represented the previous amplitude with a small decay. If the next amplitude was greater than the previous one, the height represented the next amplitude.
Hardware/Software Trade-offs
In our project, there were not many hardware/software trade-offs involved. However, it was important to consider code optimization within our software. The FFT algorithm was computationally intensive, so due to our desire for a real-time display, certain approximations were made to speed up the time of the calculation. For example, we used fixed-point calculations rather than floats.
Our primary goal was to create a pleasing display on our music visualizer. The LED matrix required a decent amount of current, so due to this hardware constraint, we decided to power the LED matrix separately from the microcontroller and microphone circuit.
Hardware Design
Overview
The microcontroller we used for this project is Microchip’s PIC32. We ran the PIC32 at 40 MHz clock frequency. The key hardware components we used were an electret microphone and the 16X32 RGB LED matrix. All pin connections to the microcontroller are described in the table below. The schematic for the circuit is given in the Appendix.
| Device | Pin | MCU Pin | Function |
|---|---|---|---|
| LED matrix | R1, G1, B1 (color data) | 4-6 | I/O |
| LED matrix | R2, G2, B2 (color data) | 16-18 | I/O |
| LED matrix | CLK (clock) | 2 | I/O |
| LED matrix | LAT (latch) | 3 | I/O |
| LED matrix | OE (output enable) | 3 | I/O |
| LED matrix | A, B, C (row select) | 7, 14, 25 | I/O |
| Microphone | Signal Out | 24 | ADC |
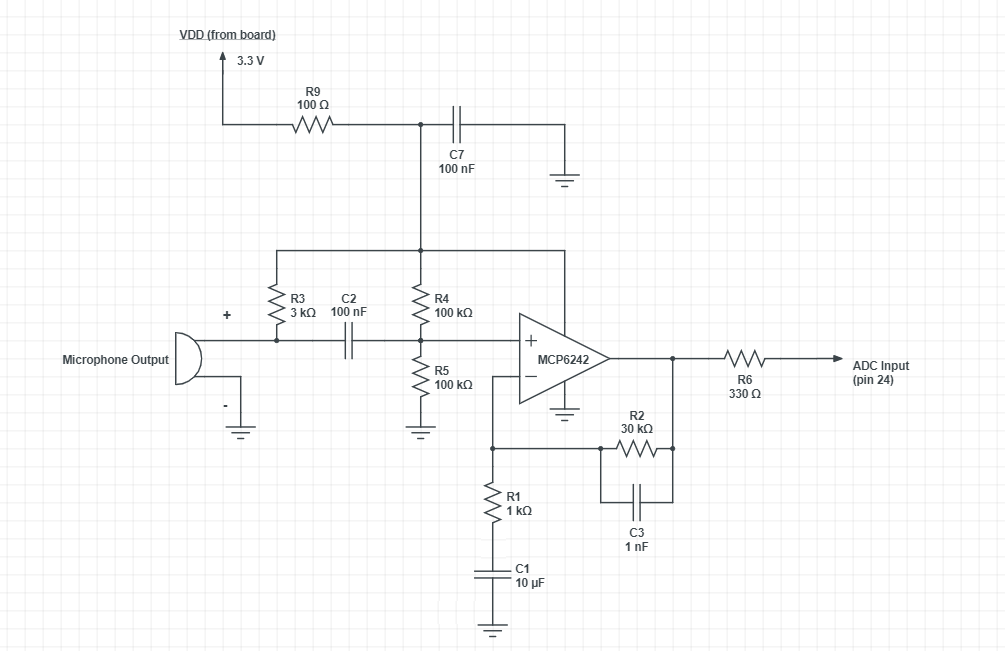
Microphone Circuit
The electret microphone when used alone resulted in a noisy signal with a small amplitude. In order to reduce the noise and increase the amplitude of our audio signal, we created a bandpass amplifier circuit. The schematic for this circuit can be found in Appendix B. To increase the amplitude of our audio signal, we created an amplifier with a gain of 30. We decided on cutoff frequencies according to the frequencies present in music. Our lower cutoff frequency was 100 Hz, and our higher cutoff frequency was 4000 Hz. Most of the frequencies present in music exist between these two frequencies.
LED Matrix Connections
The LED matrix we used is an Adafruit RGB 16 x32 LED matrix. We powered this matrix using a 3.3 V power supply. We did not use the microcontroller power because the LED matrix required, on average, 2 A of current.
The connections required to drive the LED matrix are described below:
- R1, G1, B1 - the upper RGB pins deliver color data to the top half of the display.
- R2, G2, B2 - the lower RGB pins deliver color data to the bottom half of the display.
- A, B, C - the row select lines used to select which two rows of data are currently lit. If using the Adafruit 32x32 LED matrix, there is an additional D pin to account for the additional rows.
- LAT - the latch signal marks the end of a row of data.
- OE - the output enable signal switches the LEDs off when transitioning to a new row.
- CLK - the clock signal indicates the arrival of each bit of data.
Software Design
Overview
The software portion of this project utilizes the Protothread library provided by Professor Bruce Land. We used the ADC in an Interrupt Service Routine to collect the audio signal data, and we used a light-weight FFT library written by Bruce Land for converting the audio signal from time domain into frequency domain. Lastly, we used the work of past students Sam Miller and Craig Andres for driving the LED matrix.
ADC
To sample the output of the microphone circuit, we use an Interrupt Service Routine (ISR). The ISR source is Timer5 with a period of 5000 cycles, which corresponds to a sampling rate of 8 kHz. In the ISR, if the LED matrix is finished displaying each column of the FFT, we sample the ADC, which gives us a 10-bit value. We store this value in the input array for the FFT algorithm. Each iteration of the ISR, we increment the index into which we put the ADC value. Once we fill up our FFT input array, we reset the index to zero, and set a “done” flag to True to notify our display thread that the FFT algorithm is ready to run.
FFT
To compute the FFT of our input array, we use a light-weight FFT library written by Professor Bruce Land. The algorithm computes the FFT in fixed-point to speed up the calculation. We have a thread for computing the FFT, which yields until its input array is completely filled by the ISR. We compute a 64-point FFT which results in 32 bins. Since our sampling frequency is 8 kHz, each bin is (8000 Hz/64) = 125 Hz wide. The top bin’s cutoff frequency is 4 kHz. After computing the FFT, we approximate the magnitude of each bin using the formula |amplitude|=max(|Re|,|Im|)+0.4*min(|Re|,|Im|). This approximation is accurate within about 4% rms. We then take the log of the amplitude of each bin so that we can display the wide range of amplitudes on our LED matrix. After the FFT is calculated, a flag is raised to notify the animate thread, which maps the results to the LED matrix, that the FFT has been computed and is ready to be displayed.
Driving the LED Matrix
We chose to use an RGB LED matrix as our display in order to be able to include a multitude of colors for maximum aesthetic appeal. Since this part was purchased from Adafruit, there are libraries that exist for interfacing the LED matrix with an Arduino microcontroller, however, none that we could find for use with our microcontroller and there was no datasheet. When looking through past projects on the ECE 4760 website, we noticed that there was a group in the past which had utilized a 32X32 RGB LED matrix display from Adafruit. The students had ported the Arduino Adafruit library for the PIC32 themselves and had useful documentation on how to connect up the LED matrix to the microcontroller, which was helpful. We adapted their code for use with our 16x32 LED matrix and utilized functions for filling the display screen with a specific color, for experimenting with RGB values to create custom colors, as well as for drawing a line on the display. This group’s documentation and our adapted code can be referenced in the Appendix.
After making initial modifications to this group’s library for interfacing our LED matrix with the PIC32, we tested out our custom colors and the functions for manipulating the pixels on the display by running a color test. As mentioned previously, we wanted to feature 16 different colors so that each corresponds to a row on the LED matrix. Our color test loops through all 16 colors and displays them in rainbow order. Once we had confirmed that colors were properly displaying and we were pleased with our custom colors, we were able to start implementing the animate thread.
Mapping to the LED Matrix
After the FFT was calculated, we mapped each bin to one of the 32 columns on our LED matrix. For each bin in the FFT, we used the log amplitude to determine the height of the line displayed in each column. Each row in the LED matrix was mapped to log amplitudes that were three apart from each other except for the lowest row. The lowest row, which is always lit up red, displays when the bin has a value of less than 80 for the log amplitude. We chose this to be the lowest log amplitude in order to avoid picking up the white noise of the room. Each row-height was also mapped to a specific color for visual effect. We stored an array of colors to make the line in each column based on the height.
For better visual appeal, we included a gradual decay effect with the displayed output. We did this by low passing the output. We saved the previous FFT and compared its log amplitudes with those of the current FFT. If, in a specific bin, the log amplitude of the current signal was less than the log amplitude of the previous signal, then we changed the log amplitude to 0.97 times the previous signal. If, instead, the log amplitude of the current signal in that bin was greater than or equal to the previous signal, then we kept the log amplitude as the current signal. This created a dynamic visual that reacts quickly to a change in frequency by flashing different colors, but slowly fades and slows down in movement when the frequency becomes softer.
The first bin represents the DC signal, so the magnitude of that bin was always high. The second bin represents frequencies 125 Hz to 250 Hz, but due to the noisy input and an approximate FFT algorithm, the magnitude at this bin was also high due to the DC offset. Instead of keeping these bins at a high constant amplitude, we decided to make the second bin 0.9 times the third bin, and the first bin 0.8 times the third bin. This way, the first two bins change in amplitude and the display is more dynamic.
Design Changes and Optimizations
For testing the output of the FFT algorithm, we used a serial interface connection to the PC in order to print the output to the PC. In order to connect the UART to USB serial cable to the microcontroller, we disconnected some of the connections for the LED matrix. We first ensured the FFT output was as expected using the serial output. Then, we disconnected the serial cable and reconnected the LED matrix.
Initially, for the FFT algorithm, we planned to use the PIC32 DSP library. We tested this for a while, however, the setup function for the FFT function was deprecated, and we could not figure out how to properly set up the FFT function. Ultimately, we decided to use Professor Bruce Land’s fixed-point FFT code rather than the PIC32 DSP library.
Results
Our completed music visualizer met our design goals and we were pleased with its fast responsiveness, which produces an eye-catching, dynamic display. Not only does the LED matrix offer aesthetically-pleasing visuals, but the frequencies detected and displayed are accurate. We verified this by playing a few tones at different frequencies and confirming that the spikes produced on the display were occuring at the expected columns.
As mentioned, each bin in the FFT algorithm spans a frequency range of 125 Hz and the first frequency interval ends at the 2nd column, or index 1 column on the LED matrix. We first tested playing a tone at 440 Hz, utilizing a frequency generator application on a smartphone.
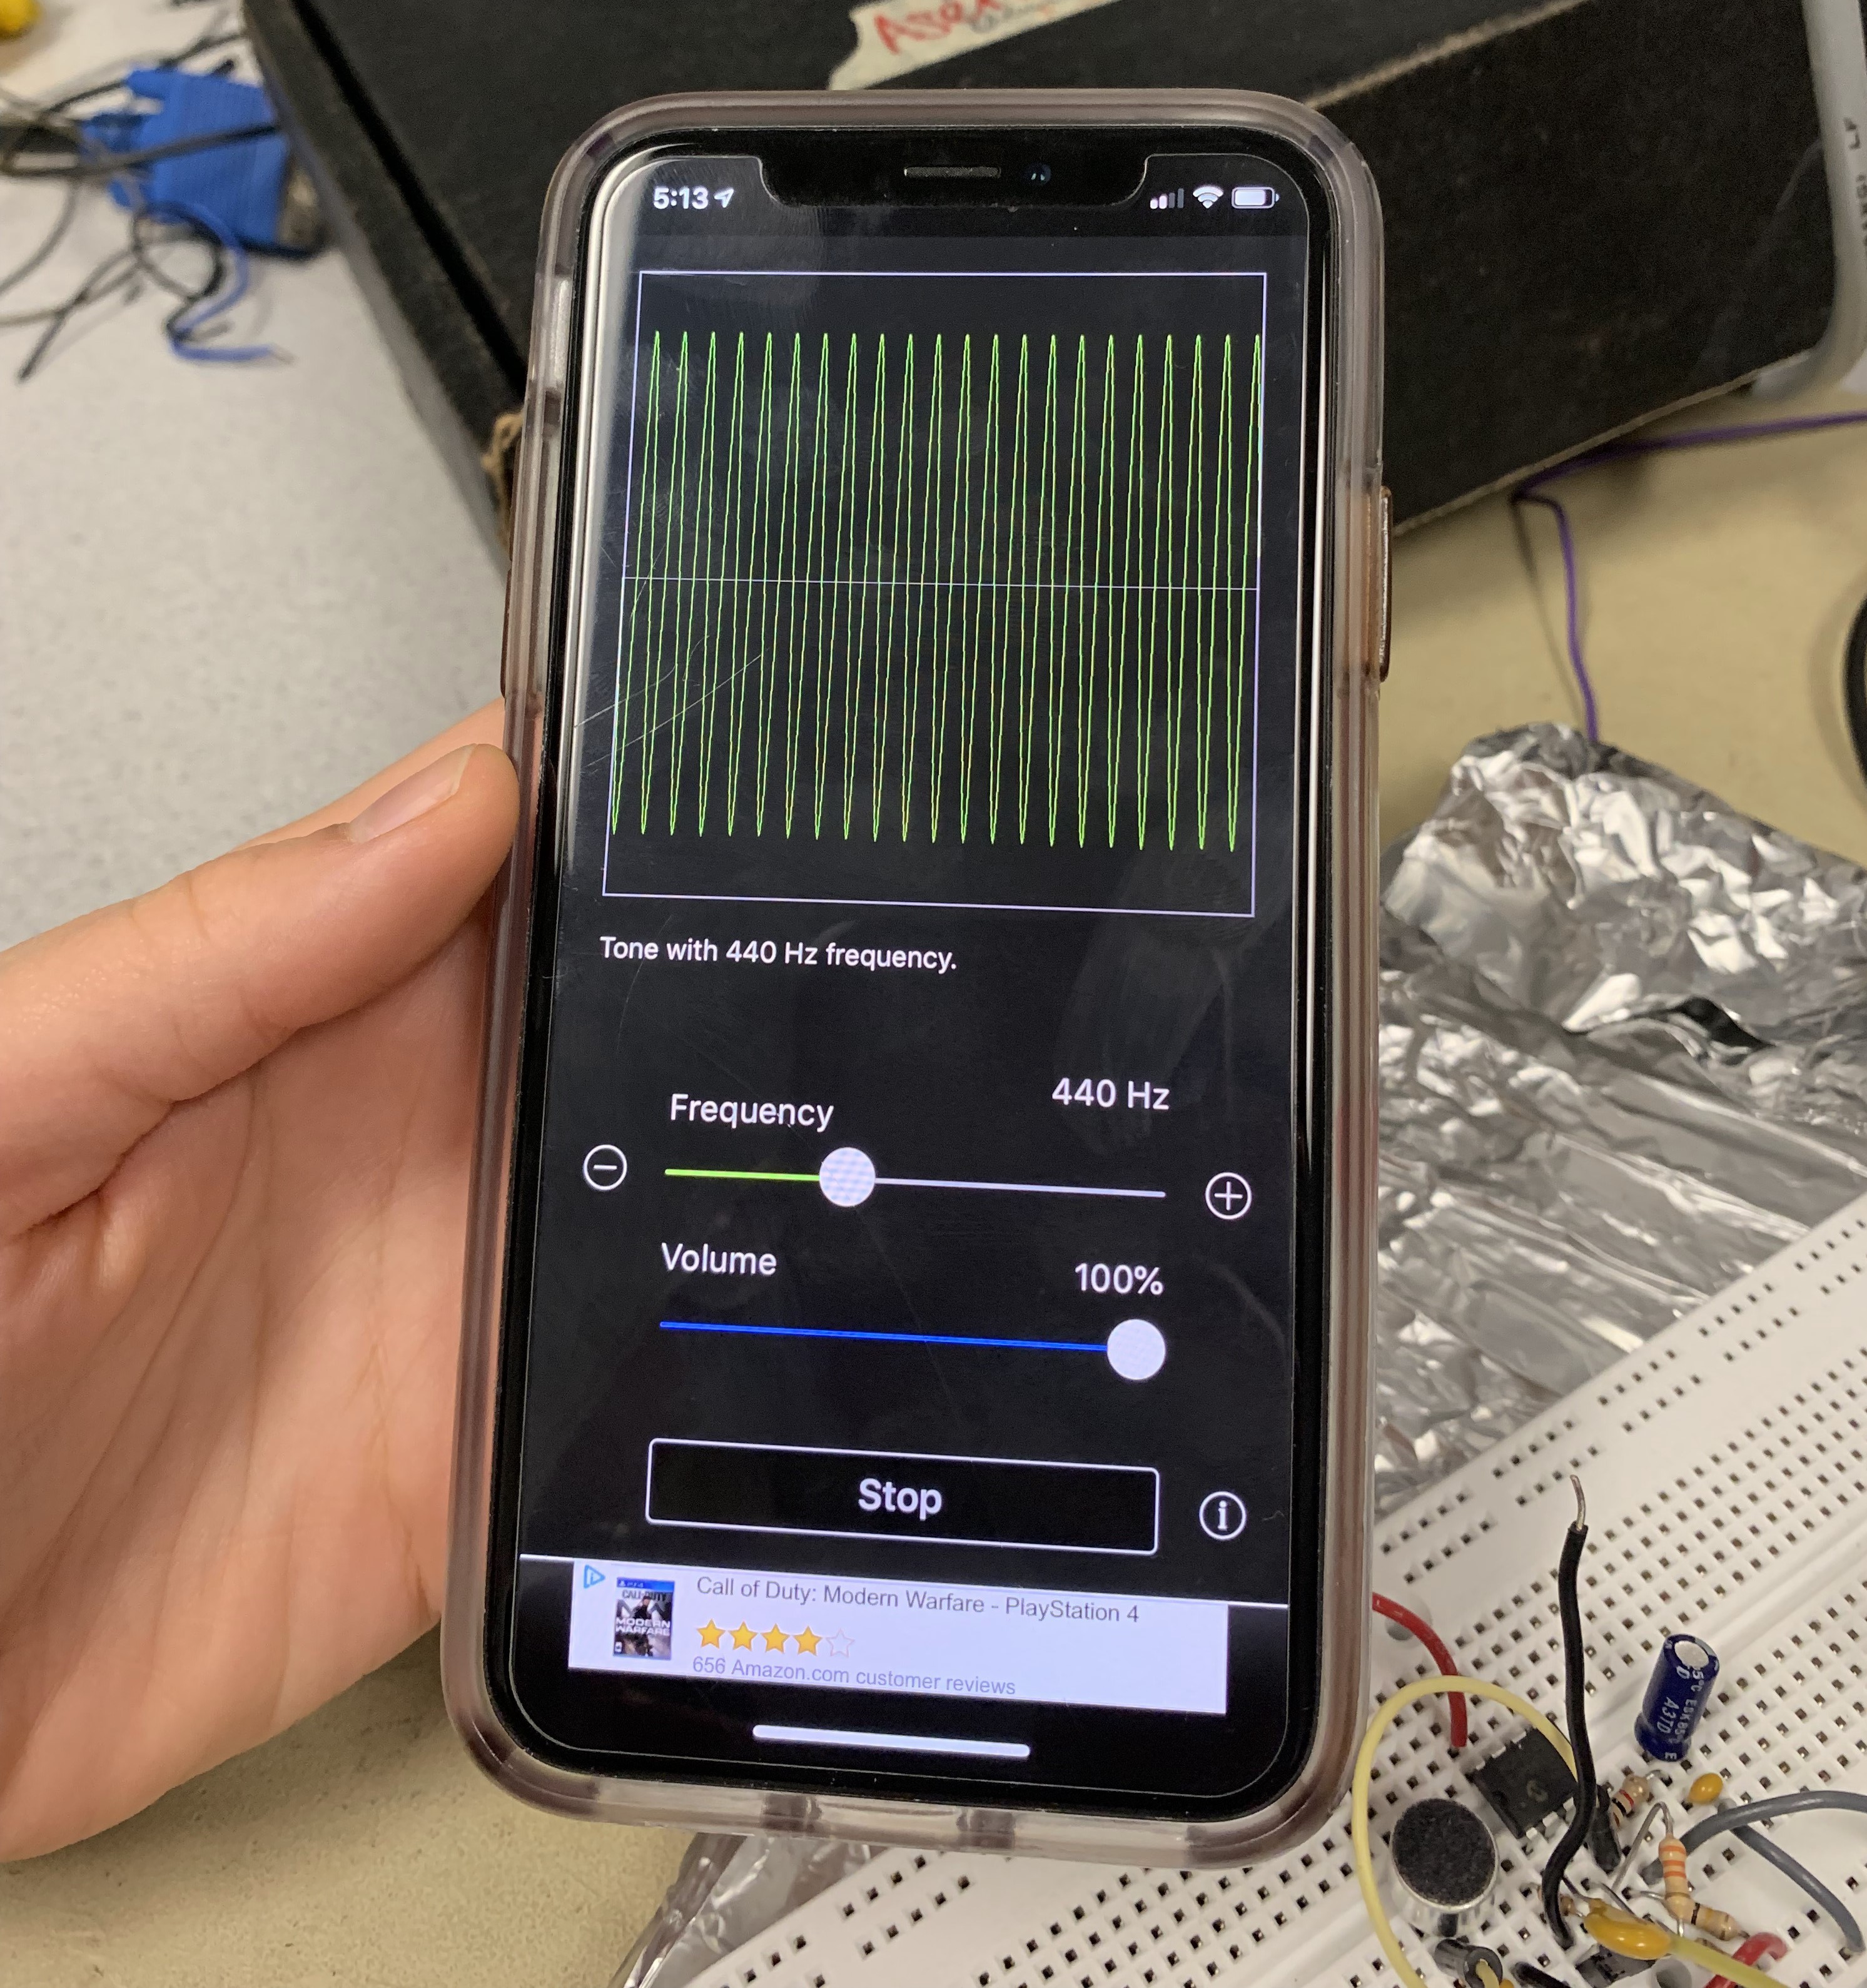
As 440 Hz/125 Hz is 3.52, we expect a spike within the 3rd frequency bin, which corresponds to the index 3 column on the LED matrix, if counting the leftmost column as beginning at index 0. The first column at index 0 accounts for the DC signal. The video below shows us playing a 440 Hz tone and the LED matrix correctly producing a spike in amplitude at the index 3 column.
We reran the same test for a tone at 820 Hz. As 820 Hz/125 Hz is 6.56, we expect a spike within the 6th frequency bin.
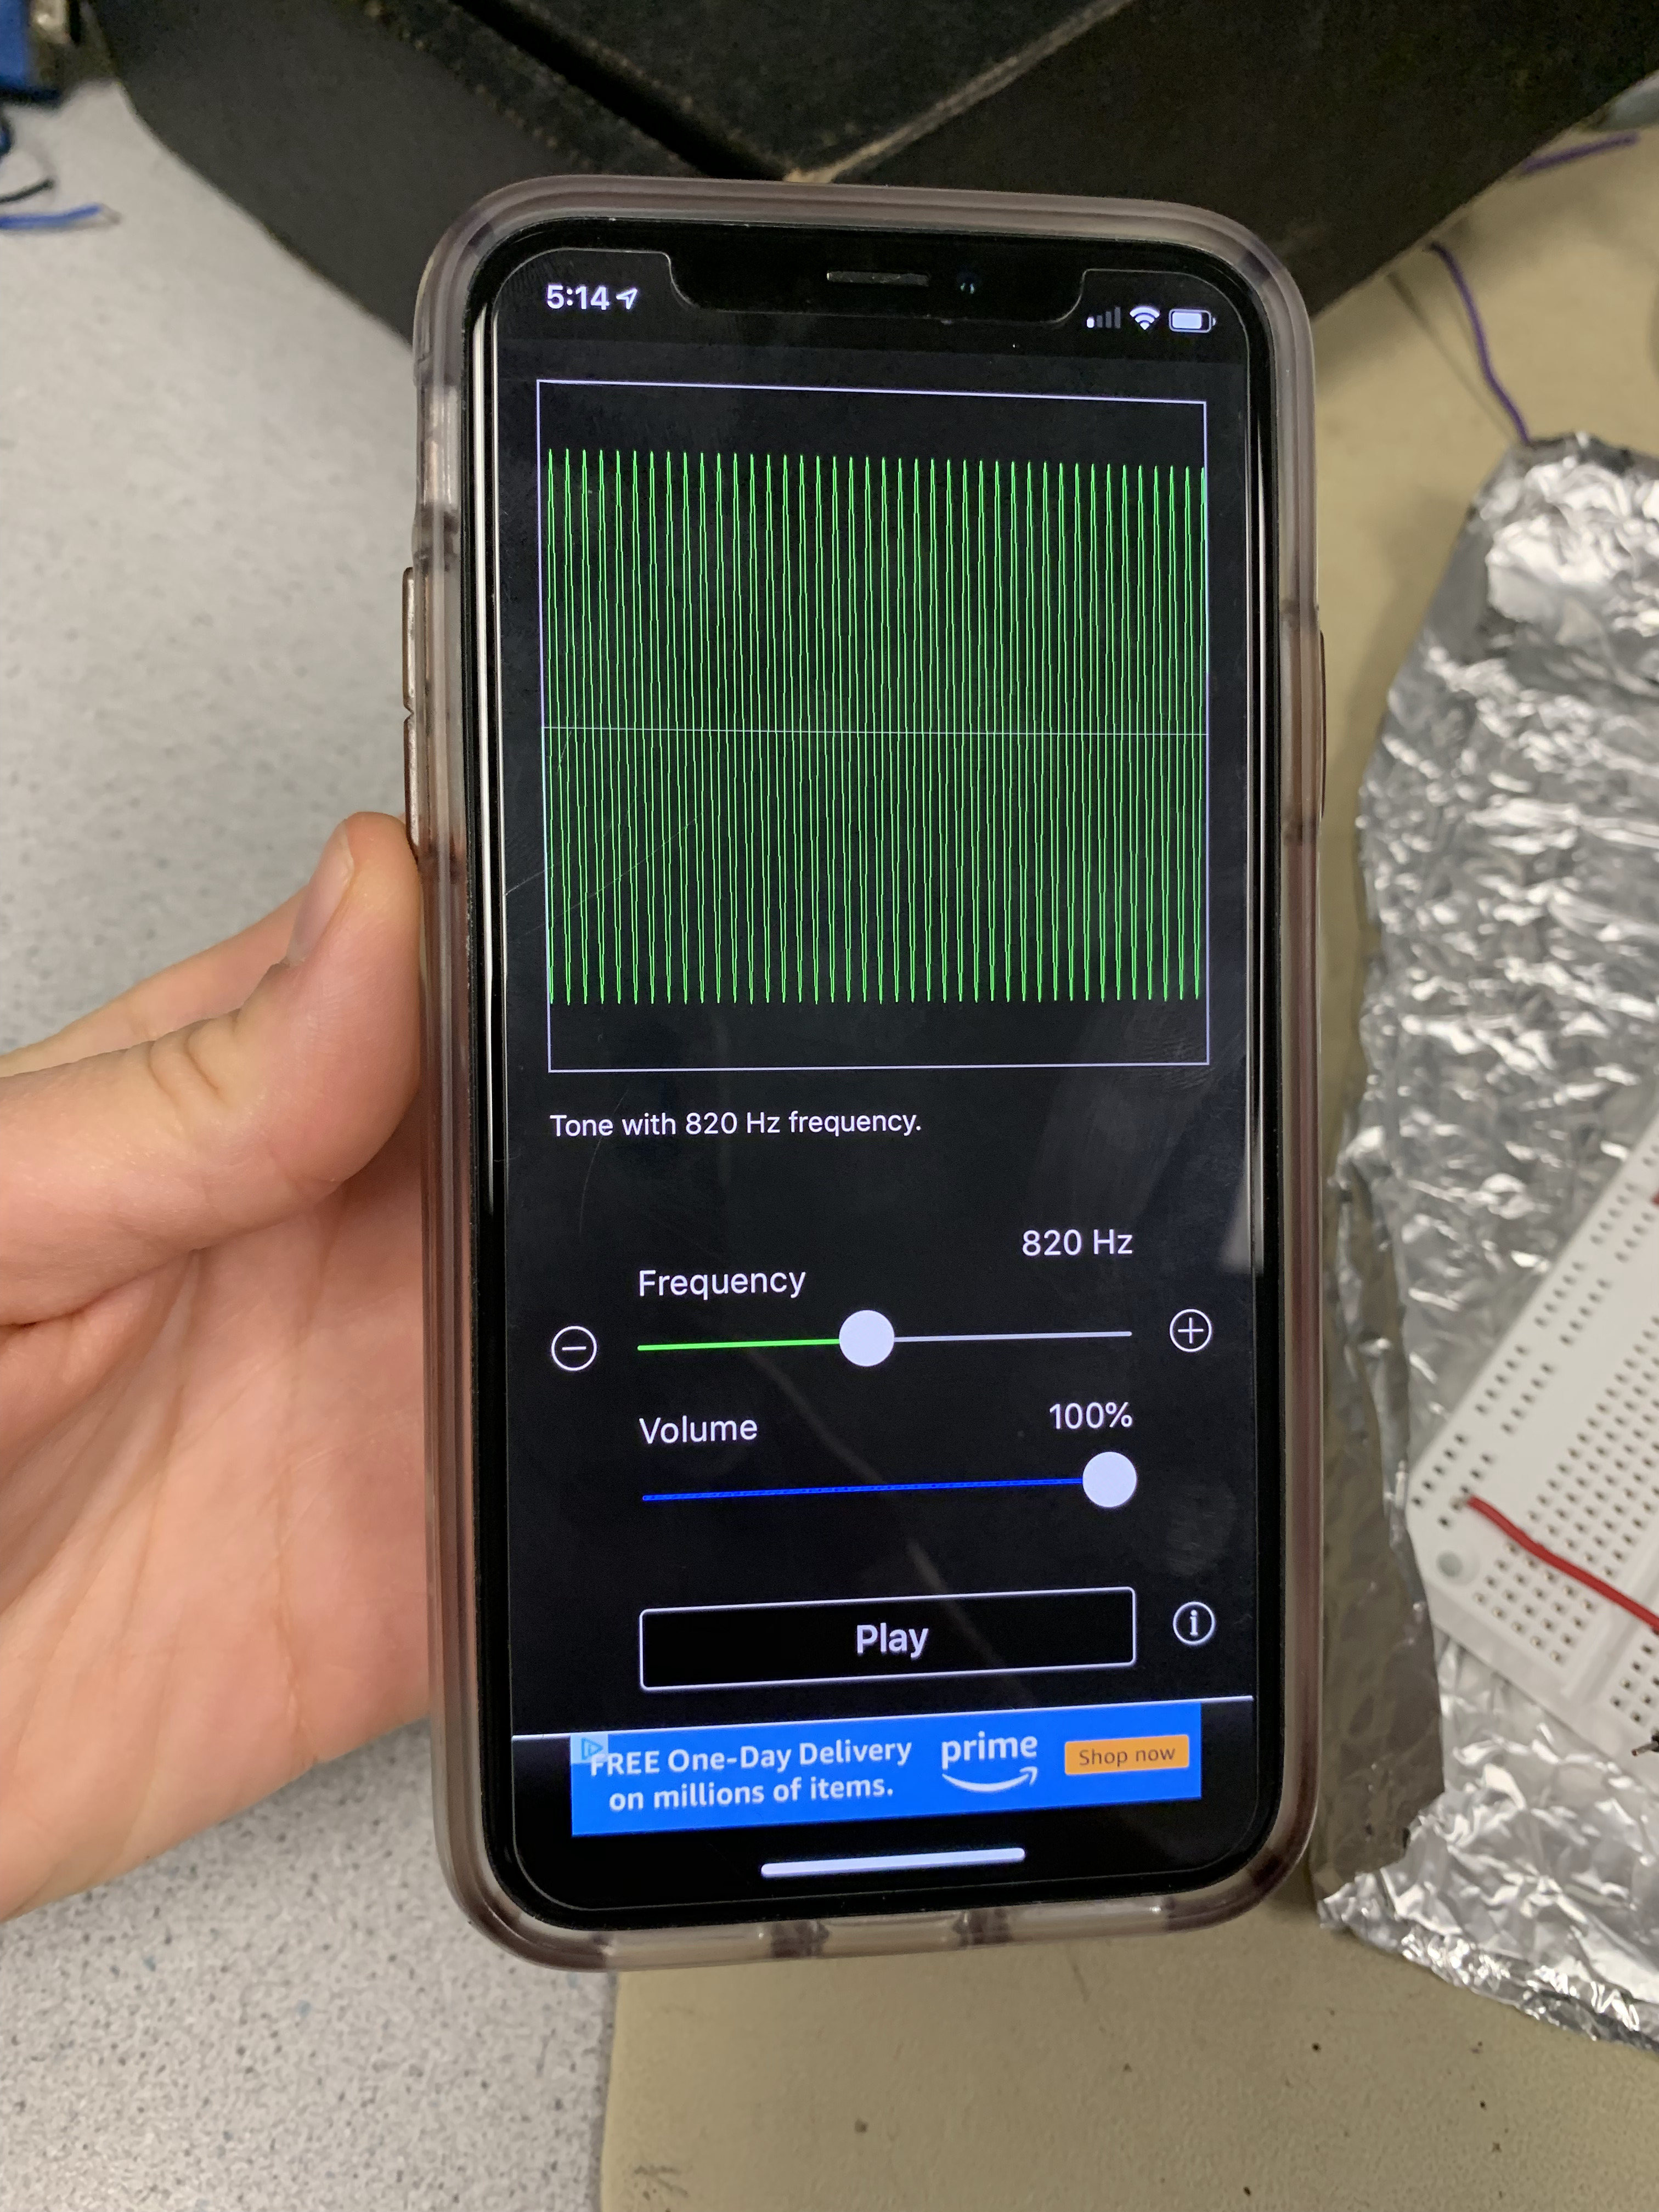
The video belows shows us playing an 820 Hz tone and the LED matrix, once again, correctly producing a spike at the expected index 6 column.
After we verified that the FFT algorithm and our mapping to the LED matrix was accurate, we next played a song to see how our display would react to audio featuring different instruments and a wide range of frequencies playing at once. The result was a bright display of fast-changing colors, and we were also able to see how the slight decay we added to drops in frequencies made the rapid changes in color more pleasing to the eye.
The video below shows the output of the LED matrix when playing "Jingle Bells".
Safety
We enforced safety throughout the design and implementation process. There were no major safety concerns in this project because we did not use any moving parts or high voltages, and we did not take any measurements from humans.
Interference
We observed high frequency interference from the CPU with the analog input. Originally, to combat this interference, we covered our microphone circuit with aluminum foil. After further investigation, we noted that the high frequency noise came from the power line on the microcontroller. Before connecting the power from the board to the microphone circuit, we low passed the power in order to reduce the high frequency noise. This low pass filter is included in our microphone circuit schematic in Appendix B. If our microcontroller produced high frequency noise that interfered with another project in the lab, we could have surrounded our project with more aluminum foil to reduce interference.
Usability
We tried to make our project as user-friendly as possible. One motivation behind creating the music visualizer was to create an alternate avenue for people that are deaf or hard of hearing to enjoy music. Our design uses a variety of different colors to encode the amplitude of the audio signal at a specific frequency, but for people that are color-blind, the visualizer still represents the music because the height of each column changes with a change in amplitude. Furthermore, our device is easy to operate, as it simply needs to be powered on for frequency detection to begin.
Conclusion
Our Thoughts
This project met the majority of the goals we set. We talk about how we would like to improve this project below in our Future Improvements section. We were happy with the display we were able to create. We felt that there was a high degree of visual correlation between the musical input and the images we created, as the LED matrix responded quickly to audio input. The variety of colors and the added decay to column height for drops in frequencies created an aesthetically-pleasing display. The manner in which we mapped the FFT output to the LED matrix led to a dynamic display that captured the energy of the music we played.
Future Improvements
One improvement that we would like to make for the usability of our project is to make the music visualizer portable so that a user could take the visualizer to a concert. In order to make it portable, we would have to add a power source with sufficient current to drive the LED matrix. Additionally, we would have to encase the project in a weatherproof case so that the visualizer could be used outdoors.
Conformance with Standards
There are no applicable standards for this project.
Intellectual Property
All prior work used to create this project is acknowledged and cited.
Ethical Considerations
This project is consistent with the IEEE code of ethics to our knowledge. We upheld safety considerations, had no conflicts of interests, were honest throughout this report, and rejected bribery. We aimed to create a fun and impactful project.
Safety Considerations
There are no safety concerns with this project. We referenced datasheets for each hardware component to ensure voltage levels were not exceeded.
Legal Considerations
There are no legal considerations involved to the best of our knowledge.
Appendix
Appendix A - Project Inclusion
The group approves this report for inclusion on the course website.
The group approves the video for inclusion on the course youtube channel.
Appendix B - Schematic
Appendix C - Budget Considerations
| Vendor | Part Name | Quantity | Unit Cost | Total Cost |
|---|---|---|---|---|
| ECE Department | Electret Microphone | 1 | $1.50 | $1.50 |
| ECE Department | MCP6242 Op-Amp | 1 | $0.36 | $0.36 |
| ECE Department | Power Supply | 1 | $5.00 | $5.00 |
| ECE Department | Breadboard | 2 | $6.00 | $12.00 |
| ECE Department | PIC32MX250F128B | 1 | $5.00 | $5.00 |
| ECE Department | MicroStickII | 1 | $1.00 | $1.00 |
| ECE Department | Socket | 20 | $0.05 | $1.00 |
| ECE Department | Jumper cables | 40 | $0.10 | $4.00 |
| Adafruit | Medium 16x32 RGB LED matrix panel | 1 | $24.95 | $24.95 |
| Total Cost | $54.81 |
Appendix D - Code
Our commented code can be found on GitHub.
Appendix E - Work Distribution
We worked closely together throughout the project. We designed and programmed together in the lab. We each wrote part of this report.
Appendix F - References
Bruce Land’s Protothreads code