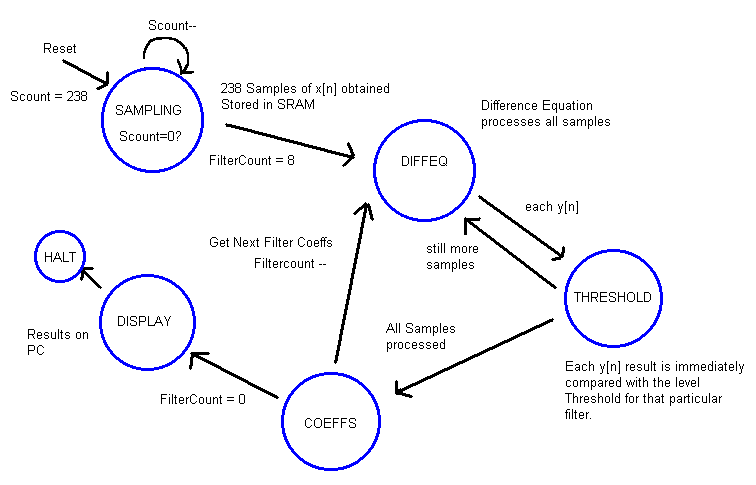
In essence, the software portion
of this project consists of implementing the chain of bandpass filters,
that constitute the core of our spectrum analyzer.
Initially, we intended to have the spectrum analyzer
operate in real-time, i.e. process a sample of input through the filters
before the next sampled input arrives. However, we encountered two important
issues with the hardware used, which eliminated the possibility of real-time
signal processing:
The subroutine DiffEq
(short for Difference Equation) basically implements the difference equation
described in the 'Filter Concepts' section.
The coefficients required by the difference equation is supplied by an
include file, "Coeffs. asm." This contains 101 coefficients
each for the 8 FIR bandpass filters constituting the spectrum analyser.
The filter frequencies are centered at: 200Hz, 400Hz, 600Hz, 800Hz, 1000Hz,
1200Hz, 1400Hz and 1600Hz. These coefficients were obtained
from MATLAB, and hard-coded into program memory.
Finally, thresholding was implemented,
to establishe a basis for determining the relative strengths of the selected
frequencies in a signal. This became more essential later in our
project when we observed that cascading bandpass filters produced regions
of 'filter overlap.' The overlaps in the frequency responses
produce frequencies of intermediate strength not really present in the
original input signal (please see section entitled 'Results').
In our design, we decided to set all the threshold levels as equal, somewhere
around 20% of the full swing voltage. This low threshold value provides
the resolution needed at all frequency points of interest.