Here, I will describe how to run the program. I will describe how to vary the program's parameters to observe the effect on the results. Throughout, I will explain what the program is doing and why. At the end, I will provide links to download the m-files. The main program is called MolterNetwork.m; all other m-files are functions that MolterNetwork.m calls.
Parameters
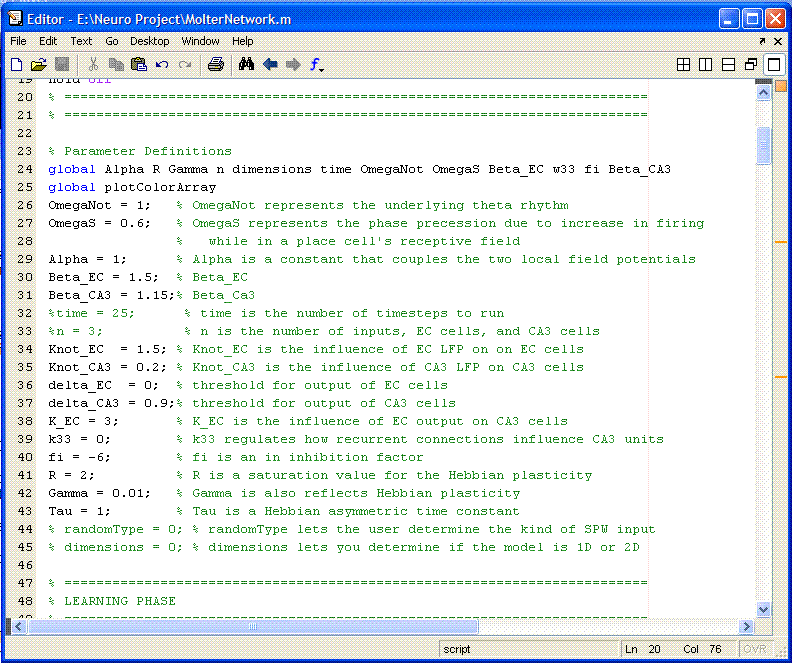
The model has a different set of equations for each cell layer, and different parameters for each equation. In total, there are around 15 parameters. Because these parameters generally do not change from run to run, and because they are so numerous, they are hard-coded. The first section of the code (following the title information) contains all of these parameters grouped together, as shown below. If the user wants to vary any of these parameters, here is the place to do it. Two important parameters are NOT included here; number of cells and computational time. As will be explained later, the user can input the number of cells, and then the program calculates the time.
Nodes and Inputs
As explained previously, there must be precisely 1 ECII cell for each place field, and precisely 1 CA3 cell for each ECII cell. The program refers to this number as the number of "nodes", n. When the user runs the program, the first thing that is displayed is an input prompt for the number of nodes. The program is hard-coded to calculate 10 time-steps per node. This makes certain that there will be sufficient computational steps to handle the inputs.
The sensory inputs are provided to the program through a function, molterInputCalculator.m. It is this function that actually simulates the rat's motion through the environment, and generates a matrix representing the sensory inputs to the ECII layer. The program prompts the user to chose whether to simulate a 1D or 2D environment. Currently, the mechanism for handling 2 dimensions is not yet coded. For now, only use 1 dimension. molterInputCalculator.m assumes a constant-speed path through consecutive, overlapping space fields. It outputs a (n x time) matrix, where each row is a particular cell, and each column is a computational time step. The output matrix contains a 1 if the cell is being activated at that timestep, and a 0 otherwise.
The Learning Phase
Next, the program does some necessary background calculations. The local field potential has already been described; here the program calculates it for each layer. It displays a graph of the phases of each LFP, just to show that they indeed phase-lock. In addition to LFP, each individual cell has its own native frequency, which is also calculated here. The native frequency for the ECII layer is more complex. It is believed that the frequency of a given ECII cell increases as its place field is inhabited for longer. To calculate this, I created a function, molterOmegaECCalculator.m, that automatically generates the ECII native frequencies. This is hard-coded to match the input function, so do not modify one without modifying the other.
Finally, the actual simulation of the network begins. As previously described, each cell recieves inputs, adjusts its phase, and then potentially outputs a spike. Thus, the simulation is based around three matrices, Input, Phase, and Output, for each layer. The CA3 layer depends on the ECII layer, so the first layer is solved completely first. ECII input is simply the input matrix derived from molterInputCalculator.m, combined with the LFP and native frequency; all of these can be solved simultaneously using vector math. The equation for phase is self-referencing, so it must be solved in a loop for time. The ouptut is dependant solely upon the phase, so it is solved in the same loop.
Due to the reccurrent connections, the CA3 layer is more complex. Its inputs depend upon its own outputs from the previous time step (as well as ECII outputs, LFP, and native frequency), so the entire CA3 layer must be solved in a time loop. The Input, Phase, and Output matrices are solved for each time step as expected. In addition, learning must occur in this layer for every time step. The "learned" information is stored in the weight vector w33, which represents the synaptic strength of each connection in the CA3 network. Thus, it is a (n x n) matrix. The learning itself is calculated through an equation which approximates the time derivative of w33, which I call wdot33. I wrote a function, wdot33Calculator.m that uses an equation to solve for wdot33. Very simplistically, wdot33 is calculated mathematicaly, and then w33 is updated by adding wdot33 to the previous w33. As previously mentioned, wdot33Calculator.m is prepared to use either of two different equations. The first is taken, as best as I could, from Molter's paper. The second is the one I derived that is more crude, but hopefully portrays the correct trends more accurately. Before beginning to simulate the CA3 layer, the program prompts the user to chose which equation wdot33Calculator should use.
The program now displays a variety of graphs. The first figure shows the outputs of the ECII and CA3 layers, displayed next to each other. The next two figures are Rastor plots of each layer's output. The Rastor plots are generated by another function I wrote, RastorPlot.m.
Reactivation Phase
After understanding the learning phase, the reactivation phase is relatively simple. There are a few parameters that require a new value for this phase, they are found at the top. Most importantly for program modification is the parameter delta_CA3. This parameter acts as a threshold, below which the cell will not spike. Molter's paper does not specify that this is variable in the reactivation phase, but I believed it to be a useful parameter to be able to control.
The SPW random inputs are generated simply by using Matlab's built-in randn function. The ECII layer recieves no external inputs, and both LFP generators are removed. The ECII layer is much less interesting, but otherwise the simulation is repeated in exactly the same way. The same graphs and Rastor plots are generated for the reactivation phase
Clicking on each link will open up the code as a text file in your browser. To download the code directly, right-click on the link and save the target. All four accompanying functions must also be downloaded in order for the program to run properly