Learning Phase
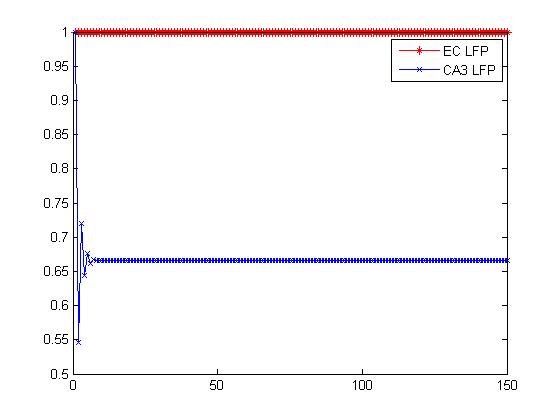
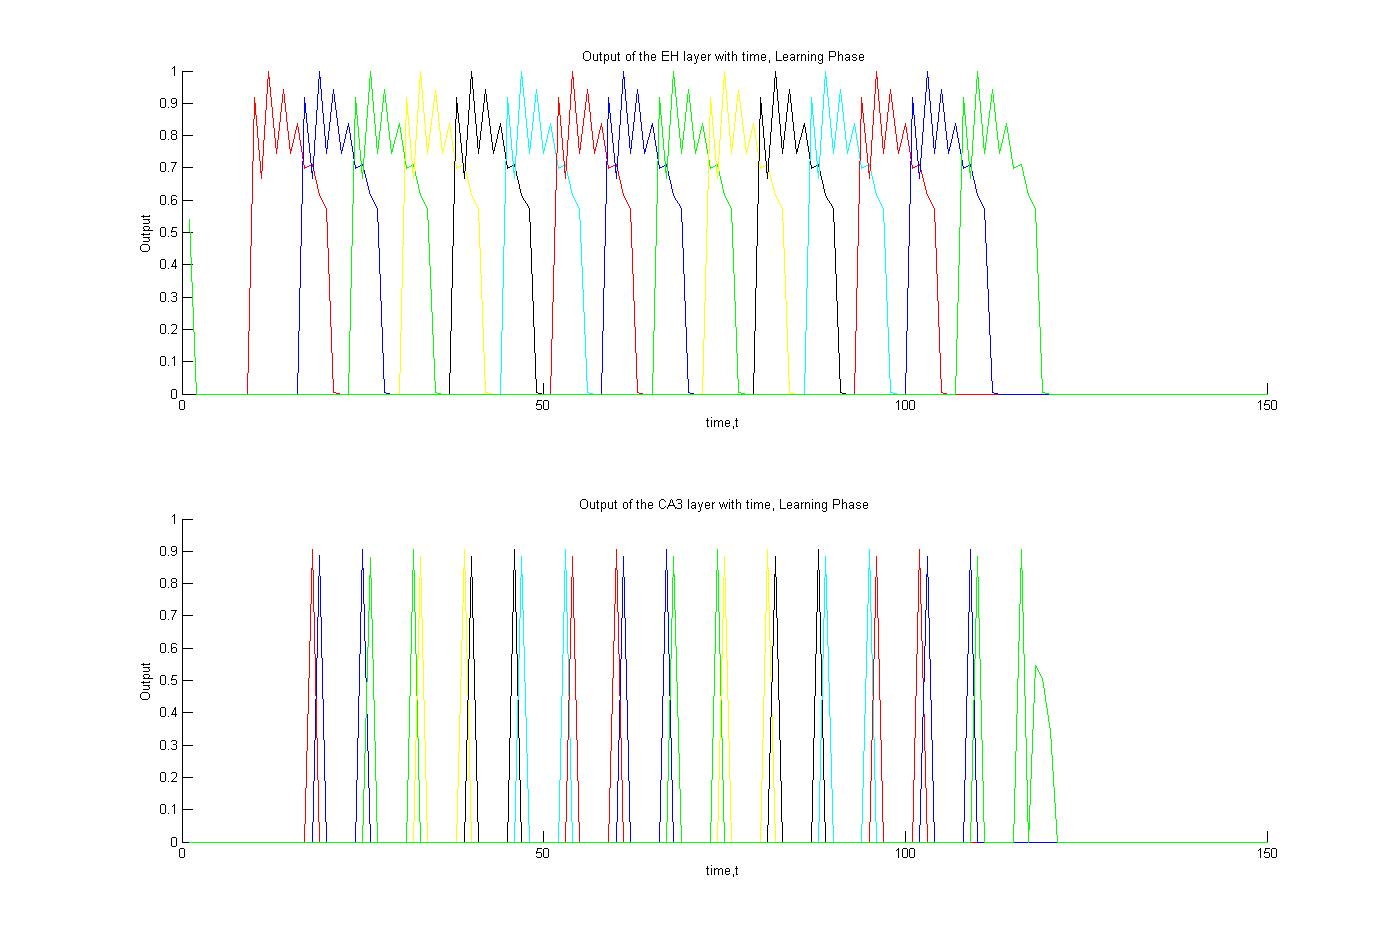
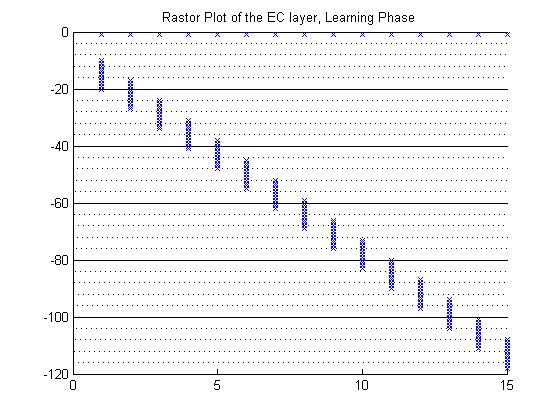
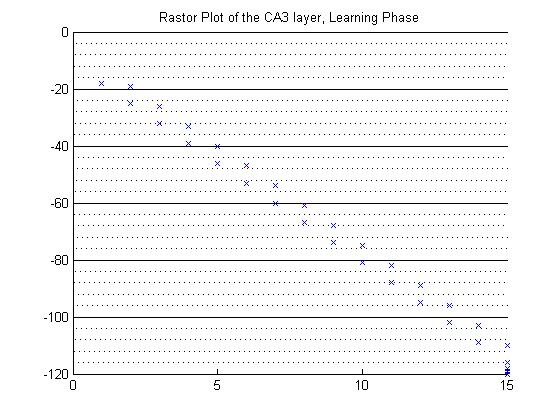
For the learning phase, my results seem very reasonable. Figure 1 shows that, after a short period of time, the CA3 local field potential phase-locks to the ECII LFP, as it should. The outputs of this phase also follow precisely as they should. Figure 2 shows that the ECII cells are triggered sequentially, precisely as they should. It also shows that the CA3 cells are also triggered sequentialy. The nature of the CA3 graph is somewhat surprising though. These cells seme to spike only when the rat crosses from one field to another. Each cell fires twice; once when the rat enters its field, and once when it leaves. This was not completely what I expected. Nothing in my intuition or in Molter's paper indicates that the CA3 cells should not fire continuously while the cell is in the field, just like the ECII cells do. This output pattern, however, could make sense, so could be correct. Interesting to note is that, when the equations were used directly from the paper, this CA3 graph appeared to be random nonsense spikes. The graph shown is a result of my modified equations, as were previously described. Figure 3 and figure 4 present the same data in a different form, that of the rastor plot. The fact that figures 3 and 4 agree precisely with figure 2 indicates that my Rastor plot function is working well. The Rastor plot is another way of displaying the results. It is easier to read a Rastor plot than an output graph when the spikes are less orderly and neat.
Reactivation Phase
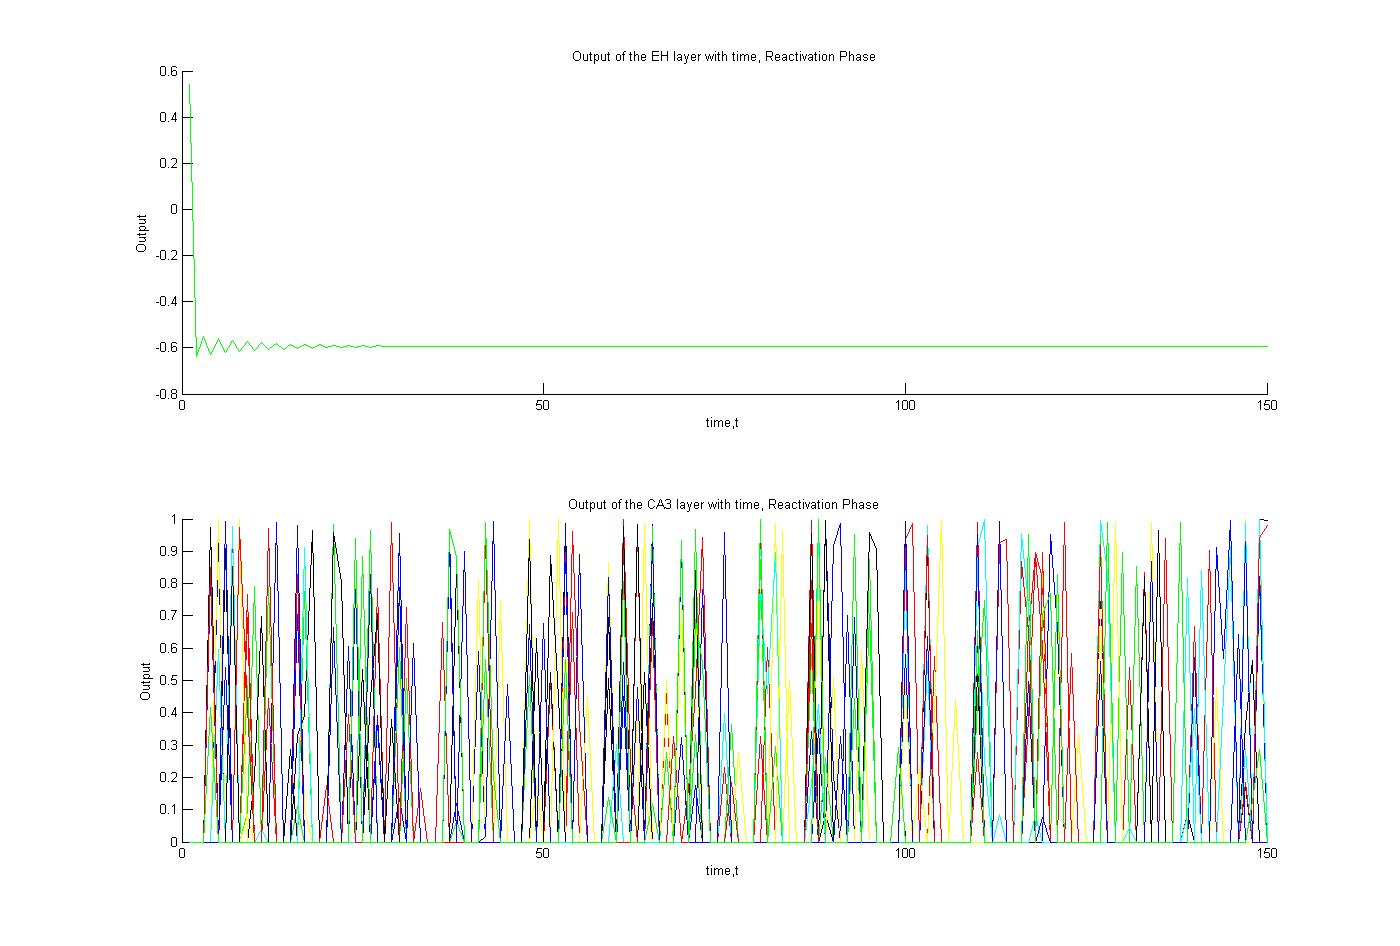
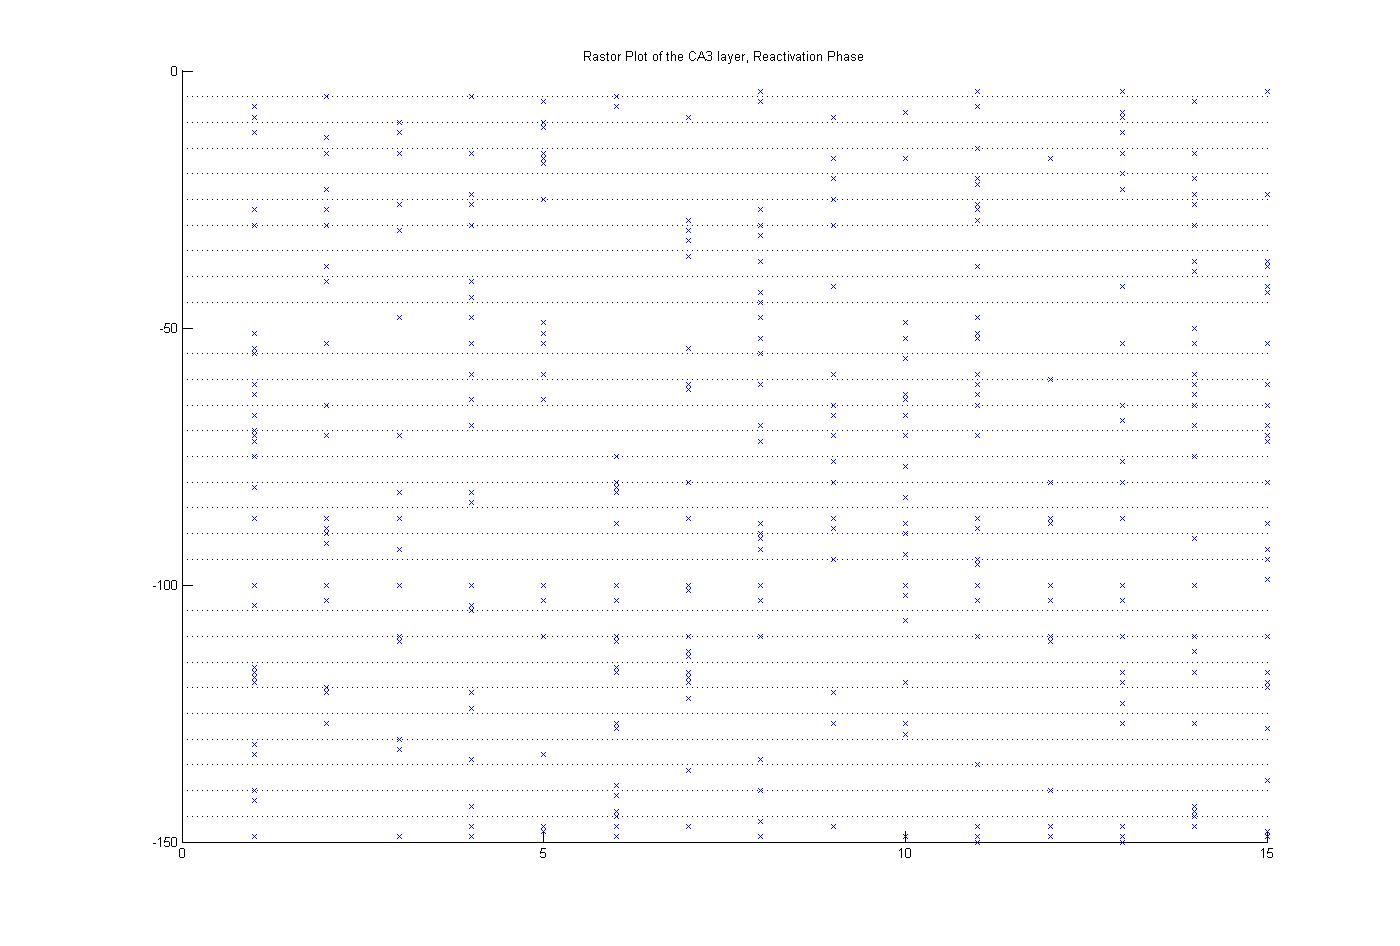
My results lose some credibility during the reactivation phase. Figure 5 shows that, as expected, the ECII layer is not interesting during reactivation. It is not recieving any inputs, so its output graph makes sense. The CA3 outputs, however, seem incorrect. It was expected that during reactivation, there would be a clear pattern recreating the path that was so clearly shown during the learning phase. The graph did not show a clear pattern, so I took the same results and made a Rastor Plot (figure 6). While it might be possible to make out some pattern in the scatter, there is so much noise that it is likely coincidence. There is no clear, obvious "replay" that Molter indicated should appear. I tried tweaking the output code, but could not make the graph any cleaner. I will discuss potential causes for this error in the 3rd page of discussion.